Capture reports with the asys CLI
The Asight Systems command-line tool, asys, lets you collect performance analysis data for a target application and generate a report without using a GUI tool. This report can be copied to another system for later analysis with the GUI tool.
The main features of asys include:
Trace information collection
Collecting execution information for CUDA, cuDNN, cuBLAS, NVTX, and OSRT APIs.
Collecting kernel execution and memory operation information on PPU devices, and correlating information between the CPU and the PPU.
Collecting execution information for PCCL communication.
Collecting call stacks for CUDA and OSRT APIs.
Collecting CPU scheduling information and call stacks during CPU execution, and calculating function execution time percentages based on their call stacks.
Collecting memory usage information for both the PPU and the CPU.
Collecting metrics, such as throughput, for network interfaces.
Collection process control
Controlling the collection duration, delaying the start of tracing, and manually interrupting the collection process.
Specifying the collection range using NVTX ranges.
Specifying the collection range using the CUDA profiler API (cudaProfilerStart/Stop).
Triggering trace collection in a loop and specifying the number of iterations.
Automatically generating report names and building report names using macros.
Customizing the application runtime environment, including configuring runtime environment variables and controlling the application's console output.
Collecting data from daemon applications, including specifying how to wait for the application to terminate.
Rotating report files during long-term collection.
Interactive trace collection
Separately controlling application launch and trace collection (
start,stop,launch, andshutdownsubcommands).Starting and stopping trace collection multiple times while an application is running.
Running multiple concurrent collection sessions and providing a list of active sessions.
Attaching to a running application to collect trace information (attach subcommand).
Post-processing for statistical analysis
Grouped statistics for device memory usage.
Statistical analysis of PPU time utilization.
To configure the environment for asys, see Get and install.
Run the asys -h command to view help. asys provides multiple subcommands for various trace collection methods:
root@0b0f55fa89fd:~# asys -h

usage: asys [--version] [--help] <command> [<args>] [application] [<application args>]

The most commonly used asys commands are:
profile       Run an application and capture its profile into a asysrep file.
attach        Attach to a process and capture its profile into a asysrep file.
launch        Launch an application ready to be profiled.
start         Start a profiling session.
stop          Stop a profiling session and capture its profile into a asysrep file.
cancel        Cancel a profiling session and discard any collected data.
shutdown      Disconnect launched processes from the profiler and shut down the profiler.
sessions      List active sessions.
status        Show the current status of CLI or the collection environment.
export        Export an asysrep file into another format.
stats         Generate statistics from an existing asysrep or SQLite file.
analyze       Identify optimization opportunities in a asysrep file.

Use 'asys --help <command> ' for more information about a specific command.
To view the help for a specific subcommand, run the asys <sub_command> -h command. For example, to view the help for the profile subcommand, run the following command:
asys profile -hAdditionally, to view the asys version, run the following command:
asys -v1. Collect tracing information
Run the asys profile command to specify tracers, run an application, and generate a trace report.
The syntax for the profile subcommand is: asys profile [option] <application> [application args]
1.1 Specify tracers
Use the --trace or -t option to specify which tracers to enable. Separate multiple tracers with a ,. For example:
asys profile -t hggc,hgtx,acblas -o baseline python test_linear.py-t hggc,hgtx,acblasenables the hggc, hgtx, and acblas tracers.-o baselinespecifies the output report name (no file extension required).python test_linear.pyruns the application.
After the application exits or you interrupt it by pressing Ctrl + C, asys generates the corresponding trace report (in this example, baseline.asysrep). You can then view the report in Asight Systems.
2. Control the collection process
2.1 Control collection time
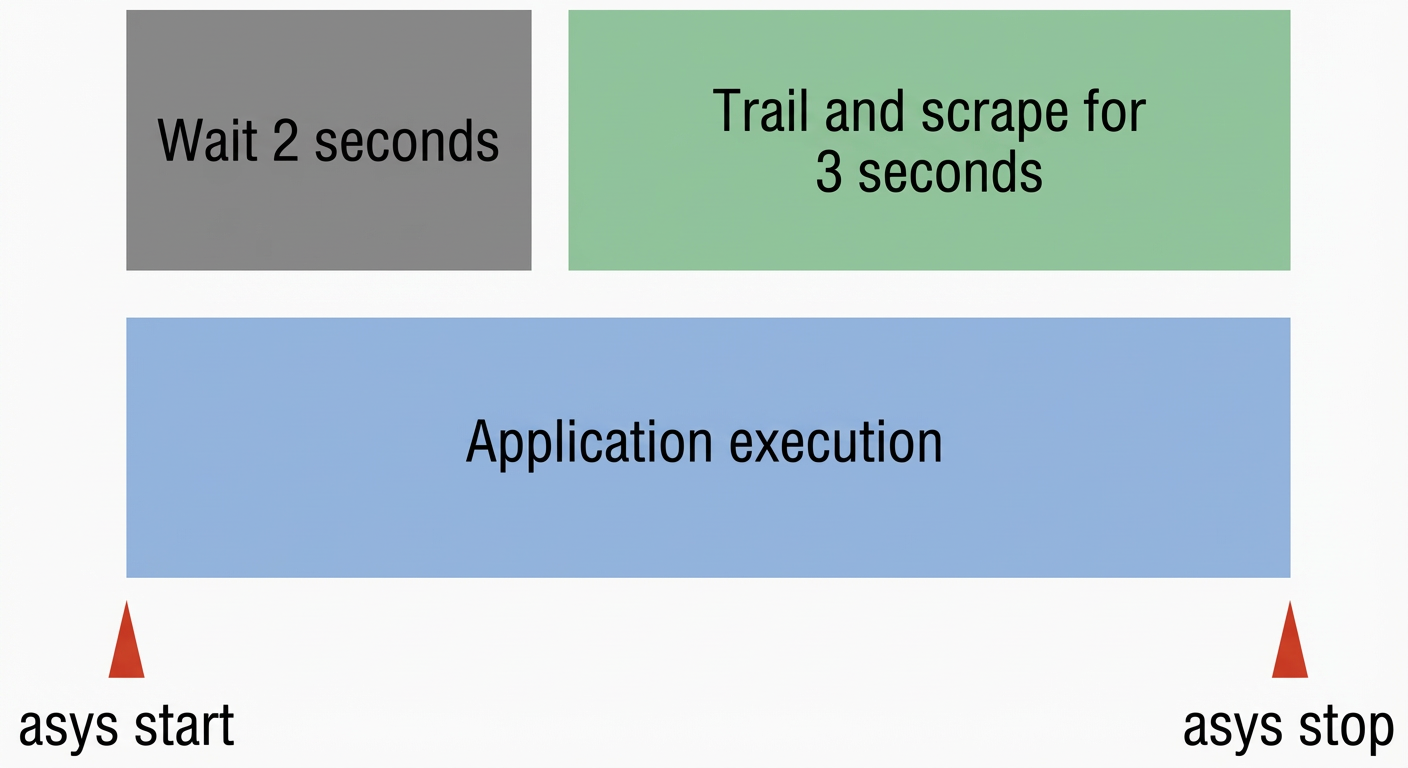
Use the--delay or-y option to delay the start of trace collection, and the--duration or-d option to set the collection duration. After the specified duration, asys stops the application and generates a report. For example:
asys profile -t hggc --delay 2 --duration 3 python test_linear.py--delay 2: Starts collection 2 seconds after the application starts.--duration 3: Sets the collection duration to 3 seconds. asys then stops the application and generates a report.
The following diagram illustrates the collection process:
Tips: To keep the application running after the collection duration ends, use the--kill none option.
2.2 Limit report file size
You can use the --max-report-size option to specify the maximum size of the asysrep report file generated during the collection process. The unit is megabytes (MiB). When the report file generated from the trace data exceeds this limit, asys stops trace collection. For example:
asys profile -t hggc --max-report-size 10 python test_linear.py--max-report-size 10limits the maximum report file size to 10 MiB. Collection stops when the report file exceeds this size.
Tips:
If you set both the
--max-report-sizelimit and the--durationlimit, asys stops trace collection when either condition is met.You can use the
--max-report-sizeoption with the--trace-rotationoption to limit the size of each report file during report file rotation.asys stops collection after the report reaches the size set by
--max-report-size. However, some final data may be appended during the stopping process, making the final file slightly larger than the specified limit.
2.3 Event-triggered trace collection
For precise control, insert specific events into your application code. You can then configure asys to use these trigger events to start and stop the collection process.
Specify a trigger type with the--capture-range or-c option. The available types and their trigger events are:
Value | Description |
hggcProfilerApi | Starts collection with hggcProfilerStart or cudaProfilerStart. Stops collection with hggcProfilerStop or cudaProfilerStop. |
hgtx | Uses an HGTX / NVTX range to trigger the start and end of collection. |
none | Default. Event-triggered collection is not used. |
For example, to usehggcProfilerApi as the event trigger to capture traces for a specific code range, insert the cudaProfilerStart/cudaProfilerStop event APIs into the application code:
cudaProfilerStart(); // profile start
DoProcess();
cudaProfilerStop(); // profile stop
DoOtherProcess();
asys profile -t hggc -c hggcProfilerApi cuda_test-c hggcProfilerApistarts trace capture atcudaProfilerStartand stops it atcudaProfilerStop, after which the application terminates. In this example, asys captures only the trace data for theDoProcessexecution.
Tips: IfhggcProfilerStart andhggcProfilerStop appear multiple times during the collection process (for example, if start is called twice before stop), asys uses the first start call and the first stop call to define the collection time range.
To usehgtx as an event trigger, insert an NVTX range into your code. For example, to trace a range named DoProcess:
for (int index = 0; index < 5; ++index) {
    nvtxRangePushA("DoProcess"); // start
    DoProcess();
    nvtxRangePop(); // stop
}
asys profile -t hggc,hgtx -c hgtx -p DoProcess cuda_test-c hgtxspecifies that HGTX/NVTX is used as the event trigger source.-p DoProcessspecifies the HGTX/NVTX range name. In this example, the range name isDoProcessand the domain is the default domain. Trace capture starts when theDoProcessrange begins and stops when the range ends, after which the application terminates.
When using HGTX/NVTX as the event trigger source, the--hgtx-capture or-p option supports multiple ways to specify the domain and range matching pattern:
Value | Description |
range@domain | Matches a time range named |
range | Matches a time range named |
range@* | Matches a time range named |
Regardless of whether the trigger type ishggcProfilerApi orhgtx, asys supports multiple event triggers (each trigger generates a separate report). You can also specify the behavior after an end trigger event using the--capture-range-end option:
| End event behavior |
none | Ignoring the end event allows sampling to continue after being triggered by an event until the program ends or is interrupted by |
stop | Trace collection stops after this end event, but the application continues to run. Subsequent trigger events are ignored. |
stop-shutdown | Default. Stops trace collection and terminates the application after the end event. |
repeat[:N] | Trace collection is triggered by events
A report is generated for each trigger, with an index number appended to the report name. |
repeat-shutdown:N | The behavior is similar to the A report is generated for each trigger, with an index number appended to the report name. |
merge[:N] | The current process performs event-triggered trace collection
After |
merge-shutdown:N | The behavior is similar to the After |
The following example uses therepeat-shutdown:2 option to collect two separate traces and then stop the application:
asys profile -t hggc,hgtx -c hgtx -p DoProcess --capture-range-end repeat-shutdown:2 cuda_test-c hgtxspecifies that HGTX/NVTX is used as the event trigger source.-p DoProcessspecifies the HGTX/NVTX range name, which isDoProcessin this example.--capture-range-end repeat-shutdown:2repeatedly triggers trace collection twice, and then stops the application.
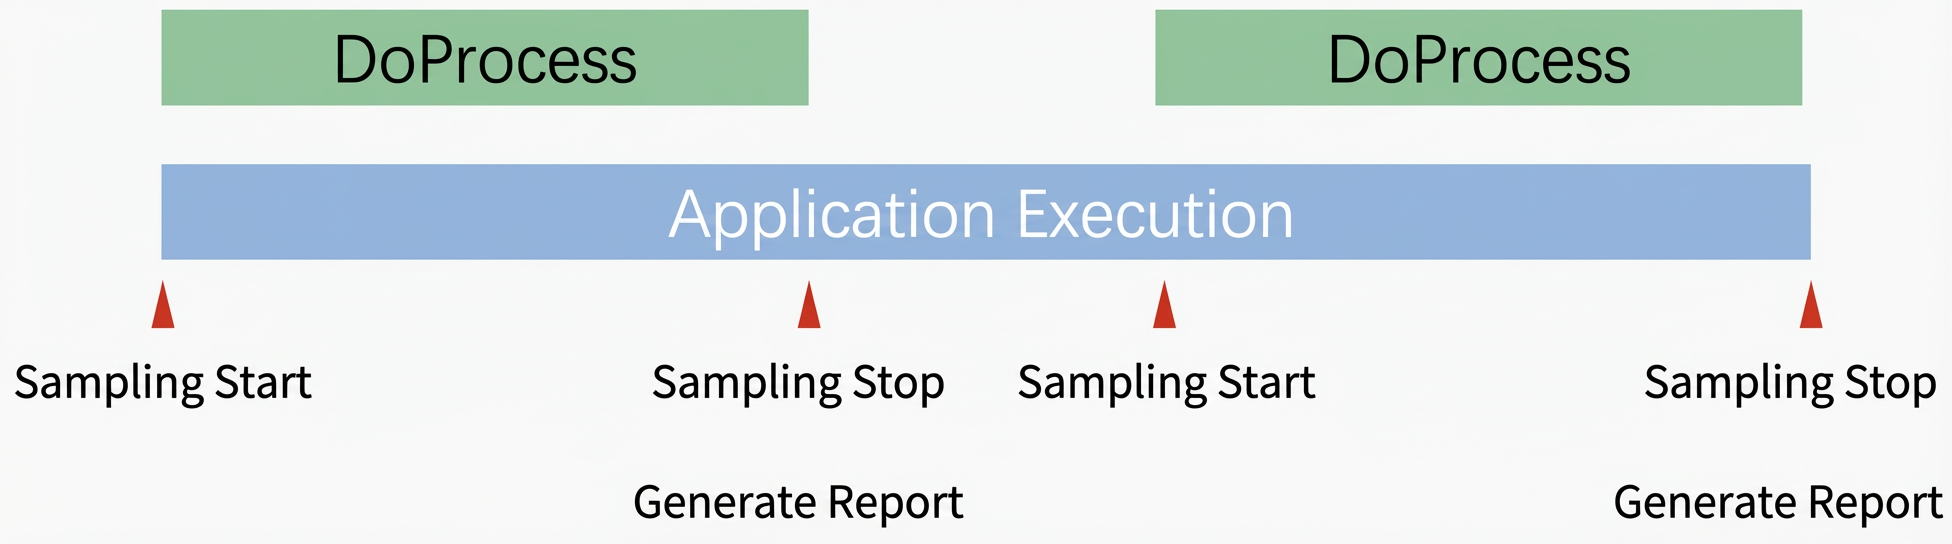
The following example shows repeated trace collection that generates a single report file. It uses themerge-shutdown:N option to collect traces twice, generate one report, and then stop the application:
asys profile -t hggc,hgtx -c hgtx -p DoProcess --capture-range-end merge-shutdown:2 cuda_test-c hgtxspecifies that HGTX/NVTX is used as the event trigger source.-p DoProcessspecifies the HGTX / NVTX range name. In this example, the range name isDoProcess.--capture-range-end merge-shutdown:2repeatedly triggers trace collection twice, and then stops the application.
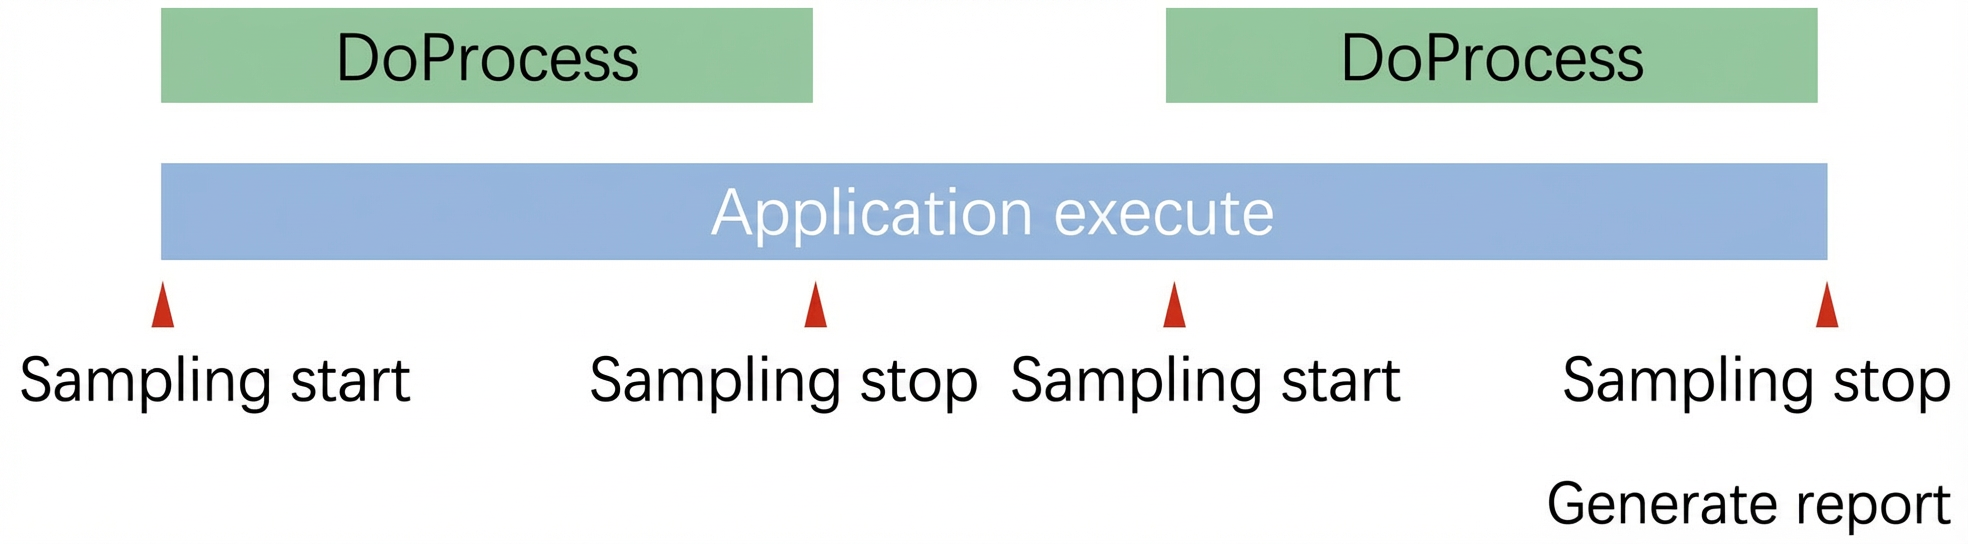
Tip: When --capture-range-end is set to repeat[:N] or repeat-shutdown:N, if the interval between a stop event and the next start event in the application is short:
asys might miss the start event and wait for the next one before beginning collection.
Trace data from other processes (with different triggerable events) may be lost at the beginning of collection.
Note: When --capture-range-end is set to merge[:N] or merge-shutdown:N, the start and stop events in the application apply only to the trace collection within the current process.
The start and stop events of the application's current process do not trigger the start or stop of trace collection in other processes.
Certain trace types, such as CPU and thread activity tracing and RDMA NIC metrics tracing, are not controlled by these events and will continue collecting data throughout the application's runtime.
2.4 Report file rotation
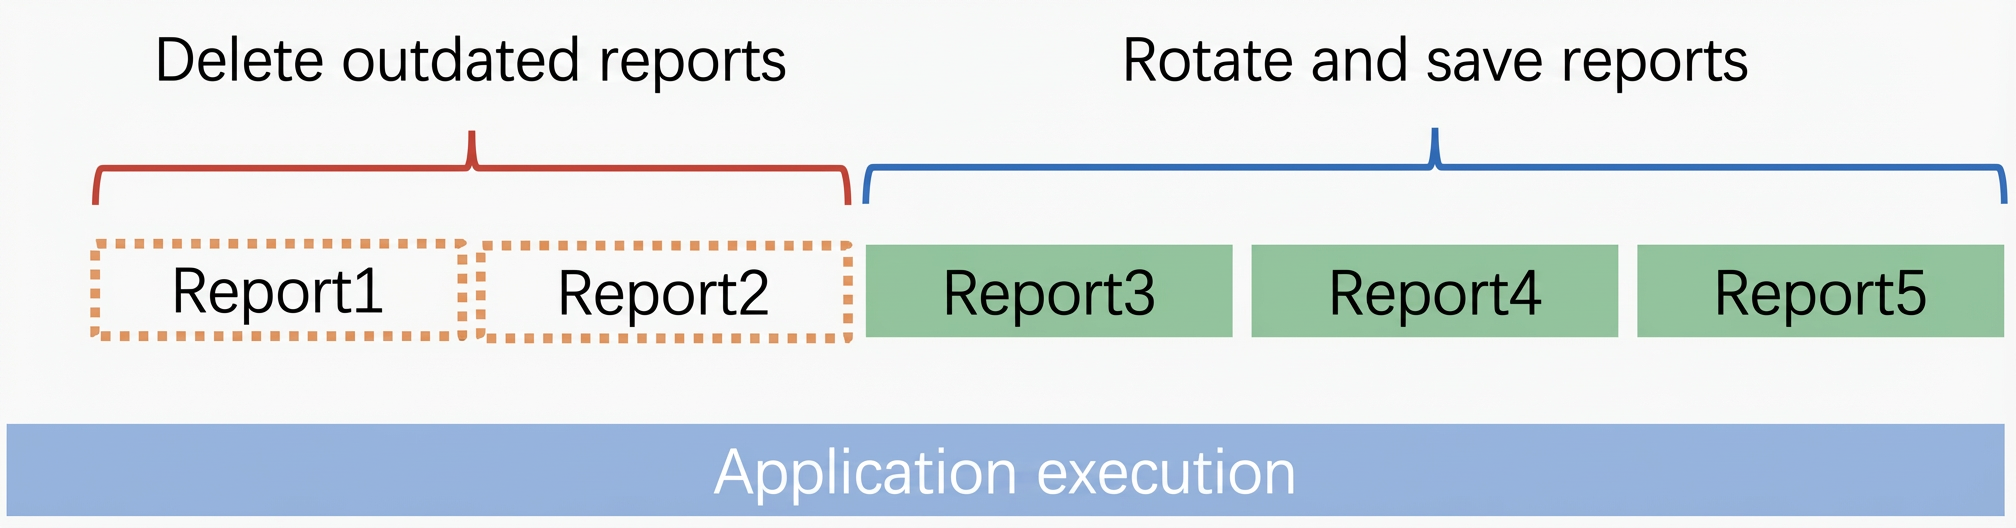
For scenarios that require long-duration trace collection, asys supports report file rotation using the--trace-rotation option with the--duration option:
asys collects data for the time specified by
--duration, generates a report file, and then starts the next round of trace collection.The
--trace-rotationoption specifies the number of recent report files to keep; older files are deleted.You can use the
--outputoption to specify a report name template. Use the%tparameter in the name to record the trace start time and avoid duplicate report filenames.
For example, to generate a report file every 30 seconds and keep the last 3 report files:
asys profile -t hggc --duration 30 --trace-rotation 3 --output test_report_%t cuda_test--duration 30specifies that each collection duration is 30 seconds.--trace-rotation 3specifies to keep the last 3 report files.--output test_report_%tspecifies the name template for the generated report. In the template, %t is replaced with the trace start time. For example:test_report_08_09_33.asysrep.
Tips:
The
--trace-rotationoption cannot be used with the--capture-rangeoption.A small amount of trace data is lost during the brief gap between collection cycles.
asys continuously collects trace data until the application terminates. You can press
Ctrl + Cto stop the application and end the trace collection.
2.5 Specify the report name
Use the--output or-o option to specify the report name. You do not need to add the file extension; asys automatically adds the .asysrep suffix. To allow overwriting an existing file with the same name, use the--force-overrite true or-f true option.
When you specify the report name with the-o option, asys recognizes macro variables and replaces them with their corresponding values. The supported macro variable formats are as follows:
Parameter | Value |
%q{ENV} | Value of the "ENV" environment variable |
%h | Hostname |
%p | PID of the application |
%i | An index number that avoids name collisions in the directory |
%t | Tracking start time, in the format |
For example:
asys profile -t hggc -o report_%q{HGGC_DRIVER_CANDIDATE}_%i python test_linear.py-o report_%q{HGGC_DRIVER_CANDIDATE}_%i, and in this example, the generated report file isreport_UMD_2.asysrep.%q{HGGC_DRIVER_CANDIDATE}is replaced with the value of theHGGC_DRIVER_CANDIDATEenvironment variable.%iis replaced with an index value that ensures the filename, with its prefix, is unique within the directory.
Tips: The default value for the -o option is report%i. Therefore, report files are not overwritten when the -o option is not specified.
2.6 Customize the application environment
asys allows you to specify the environment configuration for the application at runtime.
You can use the --env-var or -e option to add environment variables for the application at runtime, using , as the separator for multiple environment variables.
Use the--inherit-environment false or-n false option to prevent the application from inheriting system environment variables.
Use the--show-output false or-w false option to suppress the application's console output.
For example:
asys profile -e ENABLE_DEBUG=1,LOG_LEVEL=DEBUG -n false -w false python test_linear.py-e ENABLE_DEBUG=1,LOG_LEVEL=DEBUG: Configures theENABLE_DEBUGandLOG_LEVELenvironment variables when running the application.-n false: Prevents the application from inheriting system environment variables.-w false: Suppresses the application's console output.
2.7 Wait for the application to terminate
asys allows you to specify how to determine when an application has terminated. By default, asys stops collection only after the application and all its descendant processes have terminated. This is useful for applications that run as a daemon process. Use the--wait option to specify the waiting method:
Value | Termination condition |
primary | asys waits for the application's primary process (the initial process) to terminate. |
all | Default. asys waits for the application process and any processes that are re-parented to the application to terminate. |
2.8 System-wide tracing
By default, asys performs application-level tracing, collecting data only from the application's process tree. However, if other background processes are competing for system resources, you may need to analyze all system activity. You can enable system-wide tracing to collect trace data from all processes on the operating system to analyze the impact of background applications.
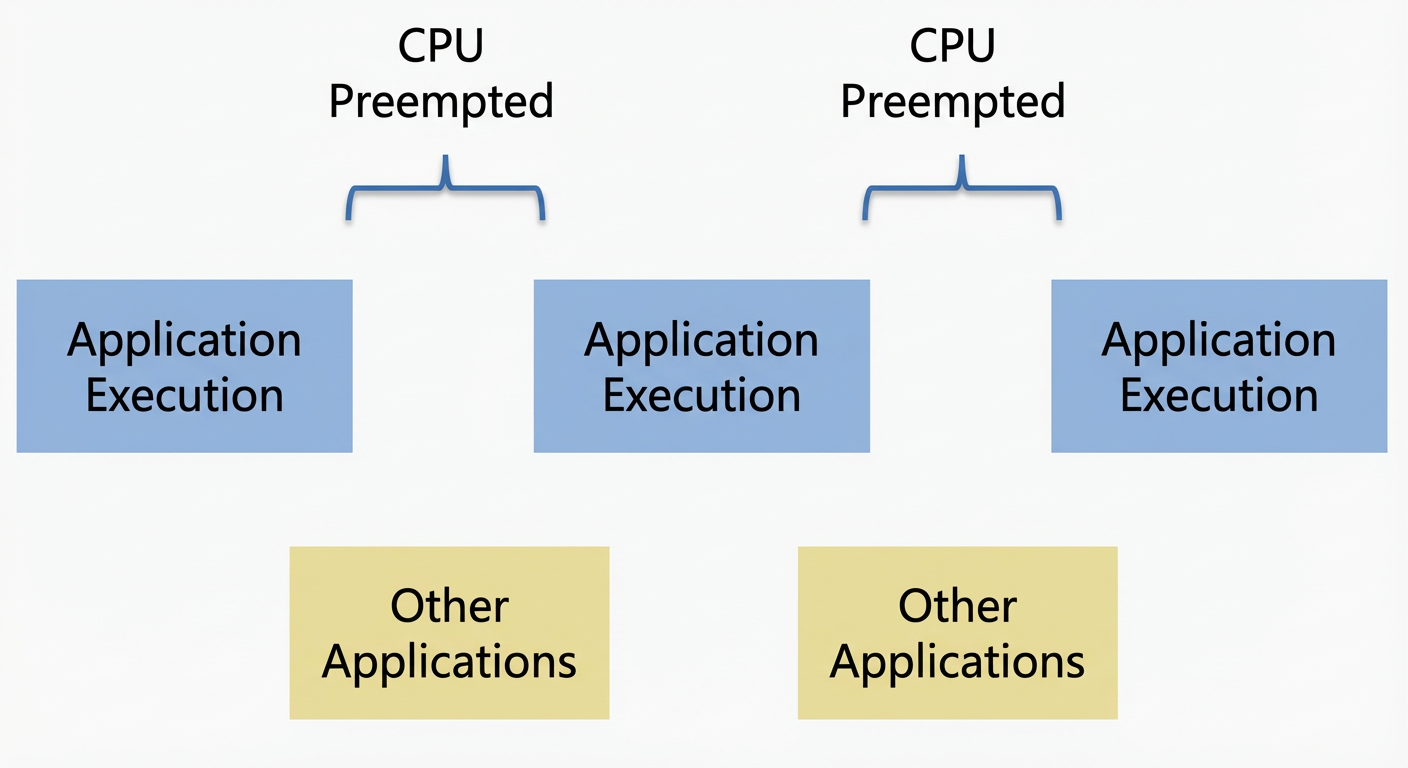
Use the--sample or-s option to enable system-wide tracing. For example:
asys profile -s system-wide -t hggc python test_linear.py-s system-wide: Collects CPU scheduling trace data for all processes on the system.
System-wide tracing can run without a specified application. When no application is specified, application-level tracing items cannot be collected. For example:
asys profile -s system-wide --ppu-metrics-device all --nic-metrics true-s system-wide: Collects CPU scheduling trace data for all processes on the system.--ppu-metrics-device all: Enables metrics sampling for all PPU devices.--nic-metrics true: Collects NIC metrics.
asys supports various system-wide tracers, such as --ppu-metrics-device, which are labeled as System scope in the help message. Similarly, asys supports various application-level tracers, such as --trace, which are labeled as Application scope in the help message. The -s option can be set to system-wide or process-tree to switch CPU scheduling trace collection to system-wide or application-level. For more information about the types of tracers, see the asys profile -h help message.
2.9 Restrict collection to specific processes
By default, asys collects trace data from all of an application's processes and records it in a single report file. This can result in a large amount of data. To collect data from only some of the processes, you can specify filtering conditions.
You can use the --process-ppu-include option to specify a list of PPU device IDs to trace, separating multiple PPU device IDs with a comma ,. For example, to collect trace data only from processes that use PPU device IDs 0 and 2:
asys profile --process-ppu-include 0,2 python test_linear.pyTips:
If you use
--process-ppu-includeto filter by PPU device ID, asys still collects trace data for processes that do not use any PPU device.If a process uses multiple PPU devices, trace data for that process will not be collected unless all of its associated device IDs are in the specified list.
You can use the --process-rank-include option to specify the Rank IDs of the processes from which to collect trace data. Separate multiple Rank IDs with a comma ,. For example, to collect trace data for only the processes with Rank IDs 0 and 2:
asys profile --process-rank-include 0,2 python test_linear.pyWhen you specify the--process-rank-include option, asys detects the Rank ID of a process by checking the following environment variables by default:
OMPI_COMM_WORLD_RANK
SLURM_PROCID
RANK
PMI_RANK
If you need to obtain the Rank ID of a process from a different environment variable, you can use the --process-rank-env option to specify the name of the environment variable. For example, to obtain the Rank ID from the PROCESS_RANK_ID environment variable:
asys profile --process-rank-include 0,2 --process-rank-env=PROCESS_RANK_ID python test_linear.pyTips: If you use--process-rank-include to specify the Rank IDs of processes to collect from, trace data from processes whose Rank ID cannot be detected will not be collected.
3. Interactive trace collection
In addition to using the asys profile command, asys offers dedicated subcommands to launch an application, start and stop trace collection, and stop the application. This approach provides flexible control over the trace collection process.
3.1 Interactive subcommands
asys provides the following subcommands to control the trace collection process. The options for these subcommands are similar to those of asys profile. To view help information for a specific subcommand, run asys <subcommand> -h.
asys subcommand | Description |
launch |
|
start |
|
stop |
|
cancel |
|
shutdown |
|
sessions |
|
By combining these subcommands, you can flexibly control when to run the application and when to perform trace collection.
Example: Launch the application, perform two separate trace collections, and then shut down the application.
asys launch -t hggc cuda_test
asys start -o test_report1
asys stop
asys start -o test_report2
asys stop
asys shutdown
asys launch ...launches the application.asys start ...starts a trace collection and specifies a report file.asys stopstops the trace collection. The application continues to run, so you can start a new trace collection by runningasys start ...again.asys shutdownshuts down the application.
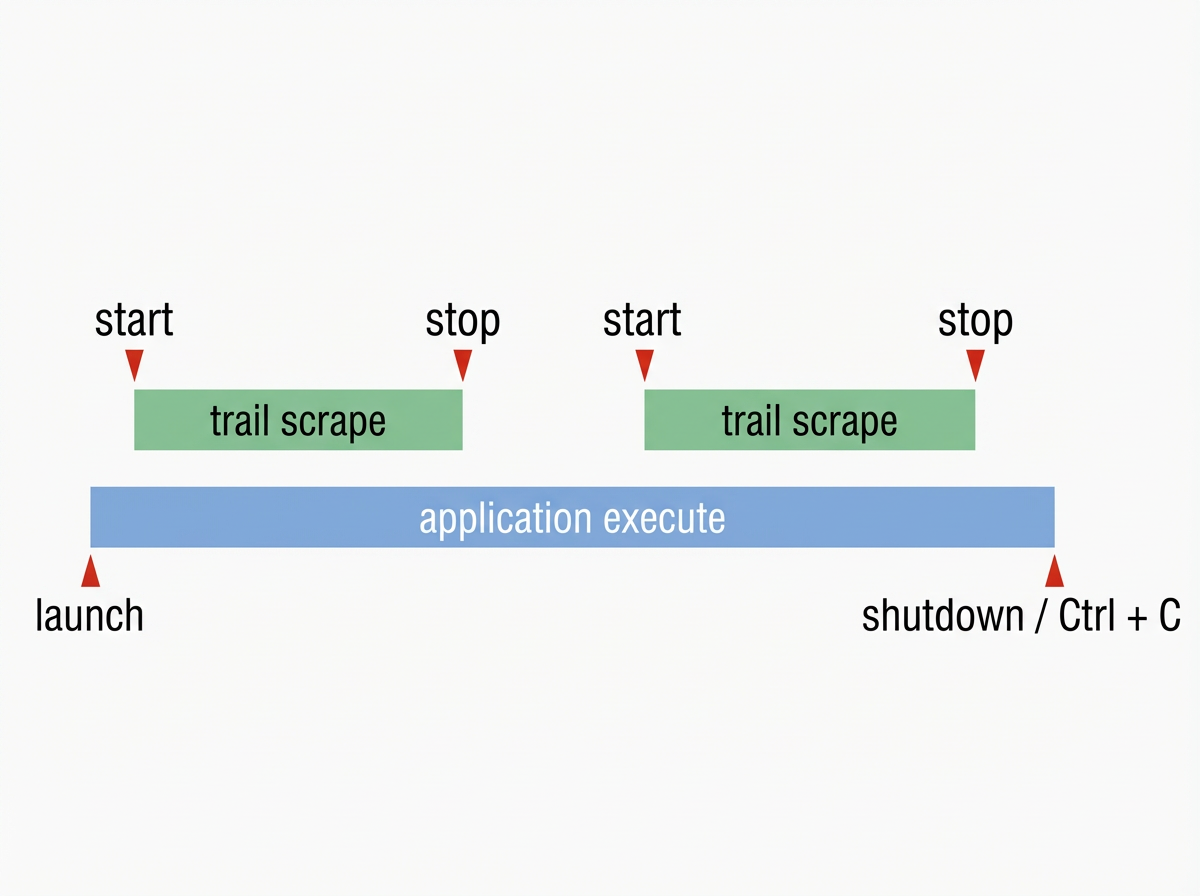
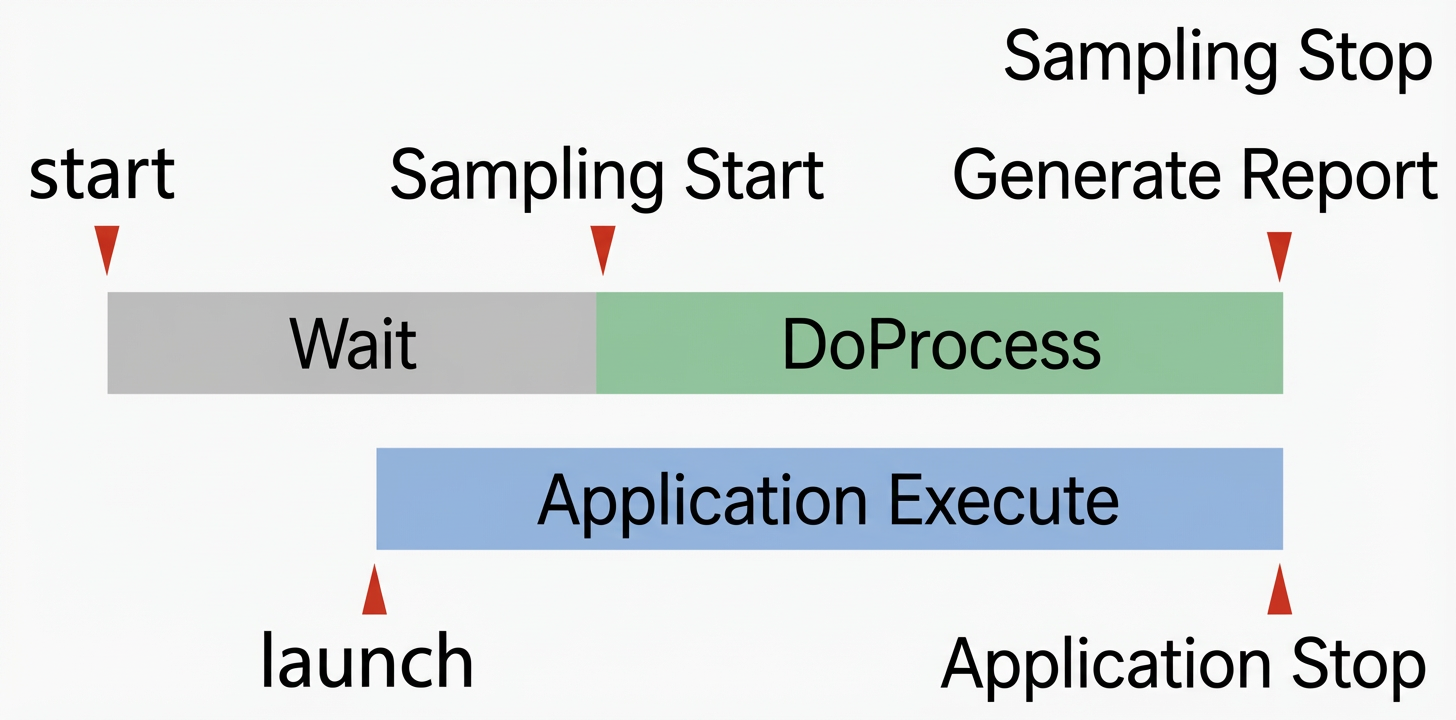
Example: Start a trace collection with an event trigger condition, and then launch the application.
asys start -o test_report -c hgtx -p DoProcess
asys launch -t hggc,hgtx cuda_test
asys start ...starts a trace collection and uses the-cand-poptions to specify an event trigger condition. The collection process waits for the application to launch before capturing data.-c hgtx: Enables an HGTX range event to trigger trace collection.-p DoProcess: Specifies that an HGTX range namedDoProcesstriggers the trace collection.
The
asys launch ...command launches the application. Because trace capturing has already been enabled by usingasys start,asys launch ...can start capturing traces as soon as the application launches. Tracing starts recording when an event trigger condition is met.
3.2 Manage multiple concurrent collections
asys supports multiple concurrent collections. For example, you can run multiple asys profile or asys launch / start commands simultaneously. Each collection runs in a session. Specific options let you create a new session or attach to an existing one. Each session has a unique name and a session ID.
session option | Description |
--session-new |
|
--session |
|
For example, run asys launch to create a session. When you run asys start, associate this session to begin trace collection.
asys launch -t hggc --session-new test cuda_test
asys start --session test
--session-new testcreates a session namedtest.--session testattaches to the session namedtest.
To view the list of active collection sessions:
asys sessions list
The ID column displays the session ID for each session. You can use this ID with the --session option to specify a session.
If you do not specify a session option, the default session names are as follows:
asys profilesubcommand:profile-<pid>-<application>asys launch / start / stop / cancel / shutdownsubcommands:[default]
Tip: Multiple asys profile commands can run concurrently by default because asys assigns a unique session name to each. For interactive subcommands, only one session with the default name ([default]) can exist at a time.
4. Attach trace collection (Beta)
asys supports collecting trace data by attaching to a running application without first launching it with asys. The asys attach command lets you connect to multiple application processes simultaneously and attach repeatedly to the same application. After trace collection finishes, the application continues to run uninterrupted.
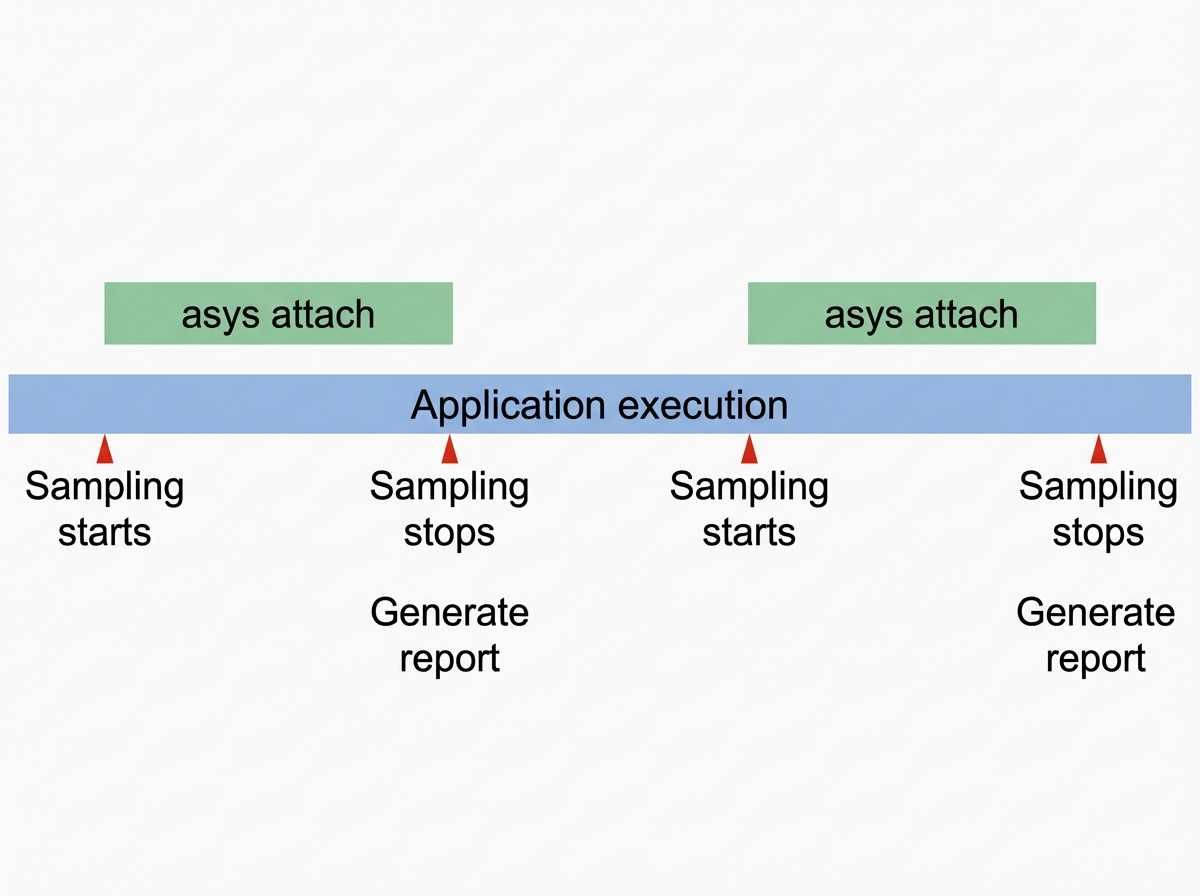
4.1 Attach trace collection
The following example shows how to use asys attach to collect trace data from multiple application processes:
asys attach -t hggc -f true -o attach_report 94644,94923-t hggccollects HGGC-related trace data.-f trueallows overwriting a report file with the same name.-o attach_reportspecifies the report name asattach_report.94644,94923Simultaneously attaches to the processes with PIDs 94644 and 94923. A,is used to separate multiple PIDs.
asys attach starts trace collection after it is run. You can press Ctrl + C to stop trace collection and generate a report file, or use --duration to specify the collection duration. For example:
asys attach -t hggc --duration 10 94644,94923 --duration 10collects data for 10 seconds, then stops collection and generates a report. The application's execution is not affected.
asys attach supports repeatedly attaching to an application to collect trace data and does not stop the application after collection is complete. asys attach has a minimal impact on application performance after collection stops and does not interfere with the application's continued operation.
4.2 Supported trace collection scope
The trace collection feature of asys attach is similar to that of asys profile, and you can run asys attach -h to view the specific supported features.
The option-t supports various trace categories. The following table describes the information collected for each category.
Tracer | Description |
hggc | Execution time and call stack information for HGGC runtime/driver APIs Execution time and call stack information for CUDA runtime/driver APIs PPU execution information: kernel, memcpy, and memset Correlation between HGGC/CUDA APIs and PPU execution |
pccl | Execution time for each phase of PCCL communication |
Other asys attach features include:
Supports
--samplefor CPU execution information and--backtracefor call stack collection.Supports
--python-samplingto sample Python call stacks.Supports the
--python-functions-traceoption for Python function tracing.Supports using
--python-backtraceto collect the Python backtrace of the HGGC API.Supports sampling of system memory usage via
--host-memory-sampling.Supports using
--ppu-metrics-deviceto collect device runtime metrics.Supports
--nic-metricsfor NIC metrics collection.Supports
--hggcbacktracefor HGGC call stack collection.Supports the collection of device memory usage and pinned memory usage through the
--hggc-memory-usageflag.
4.3 Usage notes
When you use asys attach for trace collection, note the following:
asys attachruns only in environments with the x86_64 or ARM instruction set.asys attachmay cause an application deadlock during the attachment process.An application process does not support using different release versions of
asys attachtogether.
asys attach has the following limitations:
Trace data collection for HGTX, ACDNN, ACBLAS, OSRT, and Video is not currently supported.
Trace collection is not supported for legacy HGGC graphs that were instantiated before attaching.
Attaching to processes that are already using the HGPTI library is not supported.
5. Multi-node trace collection
The asys profile command supports a multi-node trace collection mode. By running a single asys profile command, you can generate a report file on each server without modifying your application code. This mode supports various frameworks for launching multi-node applications.
Note: Ensure that the PPU-SDK is installed on each server and its initial configuration is complete.
5.1 Collect traces for Ray applications
asys supports collecting trace data from multi-node applications launched by the Ray framework, such as model applications that use vLLM. After you set up your Ray framework cluster, enable multi-node trace collection mode by using the --multi-node-mode ray option when you launch the application with asys profile. For example:
asys profile --multi-node-mode ray -f true -o qwen_vllm bash eval_llm_infer.sh--multi-node-mode ray: Enables multi-node trace collection mode for theRayframework.-f true: Overwrites existing report files.-o qwen_vllm: Specifies the report name asqwen_vllm.
In multi-node trace collection mode, asys profile generates a report file on each server. The suffix _node_<hostname> is appended to the report name. For example, if the base name is qwen_vllm, the actual report file names on each server might look like this:
qwen_vllm_node_swu137.asysrep
qwen_vllm_node_swu140.asysrep
Note:
You must run this command as the root user or a user with equivalent permissions. Enabling multi-node trace collection mode for the
Rayframework may cause your application to crash or enter a deadlock.When multi-node trace collection is enabled with the
--multi-node-modeoption, collecting heap memory usage trace data and capturing application stdout or stderr output are not supported.Due to the way
Rayframework workers terminate, trace collection may be incomplete during the application shutdown phase. We recommend using event-triggered trace collection with the--capture-rangeoption or enabling the--flush-on-context-synchronize trueoption to save trace data promptly.
5.2 Collect traces for mpirun applications
To collect trace data from multi-node applications launched by mpirun, use the --multi-node-mode mpirun option when you launch the application with asys profile. For example:
asys profile --multi-node-mode mpirun -f true -o pccl_all_reduce mpirun -np 16 -npernode 8 -H swu92:8,swu93:8 all_reduce_perf--multi-node-mode mpirun: Enables multi-node trace collection mode for applications launched bympirun.-f true: Overwrites existing report files.-o pccl_all_reduce: Specifies the report name aspccl_all_reduce.
In multi-node trace collection mode, asys profile generates a report file on each server. The suffix _node_<hostname> is appended to the report name. For example, if the base name is pccl_all_reduce, the actual report file names on each server might look like this:
pccl_all_reduce_node_swu92.asysrep
pccl_all_reduce_node_swu93.asysrep
Note:
When multi-node trace collection is enabled with the
--multi-node-modeoption, collecting heap memory usage trace data and capturing application stdout or stderr output are not supported.You cannot specify the mpirun command using an absolute path, such as
/usr/bin/mpirun.