ACU CLI
Asight Compute provides the Asight Compute CLI (acu), a command-line tool to profile a target application and generate a report file without a GUI tool. You can copy this report to another platform where a GUI tool can parse and display it.
Key features of acu:
-
Supports collecting performance data for an application running on a PPU and aggregating the data into various metrics, such as:
-
Theoretical peak performance metrics
-
Compute workload
-
Memory workload
-
Warp scheduler statistics
-
Warp state and instruction stall reason statistics
-
Instruction statistics
-
ICN link metrics
-
-
Supports specifying the metrics for collection at three levels of granularity:
set,section, andmetric. -
Supports automatic application replay to gather required performance data when the specified metrics exceed the PPU's hardware capabilities.
-
Application Replay mode
-
Kernel Replay mode
-
Range Replay mode
-
Application Range Replay mode
-
-
Supports specifying the scope for performance data collection using multiple kernel filtering methods.
-
Specifying the PPU device
-
Specifying the Context ID and Stream ID
-
Specifying the kernel name
-
Specifying the collection range using
cudaProfilerStart/Stop()andhggcProfilerStart/Stop() -
Specifying the number of kernels to collect
-
Specifying the number of kernels to skip
-
-
Supports Warp Sampling.
1. Collect performance data
1.1 Supported metrics
A metric set defines the scope of performance data collection. You can specify it at three granularities:
-
Metric: A measure of a specific aspect of PPU performance. It is the most granular unit for data collection in
acu. -
Section: A group of logically related metrics.
acuprovides several built-in sections, and you can also define custom sections by creating or modifying a section file. -
Set: A collection of one or more sections. It is the highest-level grouping for data collection in
acu.
Query metric sets
Use the --list-sets command-line option to list the metrics sets supported by acu. The following table describes the columns in the output:
root@d29fb2dd227a:/# acu --list-sets
 ------------ ----------------------------------------------------------------------------- --------- -------------------
  identifier   sections                                                                      enabled   estimated metrics
 ------------ ----------------------------------------------------------------------------- --------- -------------------
  default      occupancy,memory_workload_analysis,SpeedOfLight,SpeedOfLight_TensorRooflineC-   yes       314
               hart,compute_workload_analysis,SpeedOfLight_RooflineChart,launch_stats

  detailed     memory_workload_analysis_tables,scheduler_stats,occupancy,source_counters,memo-   no        520
               ry_workload_analysis,SpeedOfLight,warp_state_stats,SpeedOfLight_TensorRoofline-
               Chart,instruction_stats,compute_workload_analysis,SpeedOfLight_RooflineChart,-
               launch_stats

  full         Icnlink_tables,memory_workload_analysis_tables,internal_debug,scheduler_stats,-   no        821
               occupancy,Icnlink_topology,source_counters,memory_workload_analysis,professio-
               nal,SpeedOfLight,warp_state_stats,SpeedOfLight_TensorRooflineChart,memory_wor-
               kload_analysis_chart,instruction_stats,compute_workload_analysis,SpeedOfLight_-
               RooflineChart,launch_stats,Icnlink

systems systems no 0 -
Identifier column: The name of the metrics set. Use this name with the
--setoption to specify the set to collect. -
Sections column: The list of sections included in the set. Review this list to determine if the set meets your collection requirements.
-
Enabled column: Indicates whether a set is enabled. The default set is enabled by default.
-
Estimated metrics column: The number of metrics in the set. Use this number to estimate the relative overhead of the collection.
Note: The details of a set can differ between versions. The query result should be considered the source of truth.
Querying metric sections
The --list-sections command-line option displays the supported sections, their display names in the GUI, and their preset file paths. By default, this option displays information about the sections in the default set. The following table describes the output:
root@d29fb2dd227a:/# acu --list-sections
 ---------------------------------- ------------------------------------------------- --------- --------------------------------------------------
  Identifier                         Display Name                                      Enabled   FileName
 ---------------------------------- ------------------------------------------------- --------- --------------------------------------------------
  InstructionStats                   instruction statistics                            no        /usr/sections/InstructionStatistics.section
  MemoryWorkloadAnalysis             memory workload analysis                          yes       /usr/sections/MemoryWorkloadAnalysis.section
  MemoryWorkloadAnalysis_Chart       memory workload analysis chart                    no        /usr/sections/MemoryWorkloadAnalysis_Chart.sect-
                                                                                                 ion
  MemoryWorkloadAnalysis_Tables      memory workload analysis tables                   no        /usr/sections/MemoryWorkloadAnalysis_Tables.sec-
                                                                                                 tion
  SchedulerStats                     scheduler statistics                              no        /usr/sections/SchedulerStatistics.section
  SpeedOfLight_RooflineChart         PPU Speed of Light roofline chart                 yes       /usr/sections/SpeedOfLight_RooflineChart.section
  SpeedOfLight_TensorRooflineChart   PPU Speed of Light roofline chart (Tensor Core)   yes       /usr/sections/SpeedOfLight_TensorRooflineChart.-
                                                                                                 section
  ComputeWorkloadAnalysis            PPU compute workload analysis                     yes       /usr/sections/ComputeWorkloadAnalysis.section
  Icnlink                            ICNLink                                           no        /usr/sections/Icnlink.section
  InternalDebug                      debug all PPU metrics                             no        /usr/sections/InternalDebug.section
  SpeedOfLight                       PPU Speed of Light throughput                     yes       /usr/sections/SpeedOfLight.section
WarpStateStats warp state statistics no /usr/sections/WarpStateStatistics.section-
Identifier column: The name of the metrics section. Use this name with the
--sectionoption to specify which section to collect. -
Display Name column: The section's display name in Asight Compute.
-
Enabled column: Indicates whether the section is enabled.
-
FileName column: The path to the corresponding section file.
Note: Section details may vary between versions. Please refer to the actual query results.
You can also use the --set option to view section information for a specific set. A 'yes' in the 'Enabled' column indicates that the section is enabled:
root@eb8b441561f7:~# acu --set=full --list-sections
 ---------------------------------- ------------------------------------------------- --------- --------------------------------------------------
  Identifier                         Display Name                                      Enabled   FileName
 ---------------------------------- ------------------------------------------------- --------- --------------------------------------------------
  InstructionStats                   Instruction Statistics                            yes       /usr/sections/InstructionStatistics.section
  MemoryWorkloadAnalysis_Chart       Memory Workload Analysis Chart                    yes       /usr/sections/MemoryWorkloadAnalysis_Chart.sect-
                                                                                                 ion
  MemoryWorkloadAnalysis_Tables      Memory Workload Analysis Tables                   yes       /usr/sections/MemoryWorkloadAnalysis_Tables.sec-
                                                                                                 tion
  ComputeWorkloadAnalysis            PPU Compute Workload Analysis                     yes       /usr/sections/ComputeWorkloadAnalysis.section
  Icnlink                            ICNLink                                           no        /usr/sections/Icnlink.section
  InternalDebug                      Debug PPU All Metrics                             yes       /usr/sections/InternalDebug.section
  MemoryWorkloadAnalysis             Memory Workload Analysis                          yes       /usr/sections/MemoryWorkloadAnalysis.section
  SchedulerStats                     Scheduler Statistics                              yes       /usr/sections/SchedulerStatistics.section
  SpeedOfLight                       PPU Speed Of Light Throughput                     yes       /usr/sections/SpeedOfLight.section
  SpeedOfLight_RooflineChart         PPU Speed Of Light Roofline Chart                 yes       /usr/sections/SpeedOfLight_RooflineChart.section
  SpeedOfLight_TensorRooflineChart   PPU Speed Of Light Roofline Chart (Tensor Core)   yes       /usr/sections/SpeedOfLight_TensorRooflineChart.-
                                                                                                 section
WarpStateStats Warp State Statistics yes /usr/sections/WarpStateStatistics.sectionNote: The sections in a set may differ between versions. Always refer to the actual query results.
Specifying the section file search path
You can use acu to specify a search path for section files. If a search path is specified, acu will search that path for all files with the .section suffix. There are two ways to specify the search path:
-
--section-folder: Specifies the search path for section files. acu searches the specified folder for files with a.sectionextension. The search is not recursive. -
--section-folder-recursive: Specifies the search path for section files. acu recursively searches the specified folder for files with a.sectionextension.
For example, to view the section for /usr/custom:
acu --list-sections --section-folder=/usr/custom/1.1.3 Query metric list
The --list-metrics command-line option lists supported metrics. By default, it lists metrics from the default set. Use the --section or --set option to list metrics from a specific section or set.
List metrics in a section
Use --section to query the metrics for a specific section.
root@d29fb2dd227a:/# acu --section SpeedOfLight --list-metrics
breakdown:cu__throughput.avg.pct_of_peak_sustained_elapsed
breakdown:ppu__compute_memory_throughput.avg.pct_of_peak_sustained_elapsed
ce__cycles_active.max
ce__cycles_elapsed.avg.per_second
ce__cycles_elapsed.max
cu__cycles_active.avg
cu__throughput.avg.pct_of_peak_sustained_elapsed
dram__cycles_elapsed.avg.per_second
l1__throughput.avg.pct_of_peak_sustained_active
l2__throughput.avg.pct_of_peak_sustained_elapsed
llc__throughput.avg.pct_of_peak_sustained_elapsed
ppu__compute_memory_throughput.avg.pct_of_peak_sustained_elapsed
ppu__dram_throughput.avg.pct_of_peak_sustained_elapsed
ppu__time_duration.sum
Query the metrics in a set
Use --set to query the metrics for a specified set.
root@d29fb2dd227a:/# acu --set=default --list-metrics
breakdown:cu__throughput.avg.pct_of_peak_sustained_elapsed
breakdown:ppu__compute_memory_throughput.avg.pct_of_peak_sustained_elapsed
ce__cycles_active.max
ce__cycles_elapsed.avg.per_second
ce__cycles_elapsed.max
cu__cycles_active.avg
cu__inst_executed.avg.pct_of_peak_sustained_active
cu__inst_executed.avg.per_cycle_active
cu__inst_executed.avg.per_cycle_elapsed
cu__inst_executed_pipe_falu_fp16.avg.pct_of_peak_sustained_active
cu__inst_executed_pipe_falu_fp32.avg.pct_of_peak_sustained_active
cu__inst_executed_pipe_lsu.avg.pct_of_peak_sustained_active
cu__inst_executed_pipe_sfu.avg.pct_of_peak_sustained_active
cu__inst_executed_pipe_simt_control.avg.pct_of_peak_sustained_active
cu__inst_executed_pipe_sls.avg.pct_of_peak_sustained_active
cu__inst_executed_pipe_tensor_fp16.avg.pct_of_peak_sustained_active
cu__inst_executed_pipe_tensor_tf32.avg.pct_of_peak_sustained_active
cu__instruction_throughput.avg.pct_of_peak_sustained_active
cu__memory_throughput.avg.pct_of_peak_sustained_elapsed
cu__throughput.avg.pct_of_peak_sustained_elapsed
dram__bytes.sum.peak_sustained
dram__bytes.sum.per_second
dram__cycles_elapsed.avg.per_second
ksd__transaction_hit_rate.pct
kvd__transaction_hit_rate.pct
l1__throughput.avg.pct_of_peak_sustained_active
l2__throughput.avg.pct_of_peak_sustained_elapsed
l2__transaction_hit_rate.pct
llc__average_lcu_input_transaction_success_rate.pct
llc__average_lcu_output_transaction_compression_achieved_rate.ratio
llc__throughput.avg.pct_of_peak_sustained_elapsed
llc__transaction_hit_rate.pct
ppu__compute_memory_access_throughput.avg.pct_of_peak_sustained_elapsed
ppu__compute_memory_request_throughput.avg.pct_of_peak_sustained_elapsed
ppu__compute_memory_throughput.avg.pct_of_peak_sustained_elapsed
ppu__dram_throughput.avg.pct_of_peak_sustained_elapsed
ppu__time_duration.sum
pu__cycles_elapsed.avg.per_second
1.1.4 Querying metrics
Run acu --query-metrics to retrieve metric descriptions:
root@0549cf16bb85:~# acu --query-metrics
------------------------------------------------------------------------------------------------------------------------------------------------------------------------------------------------
 metric name                                                                                    type        unit           metric description
------------------------------------------------------------------------------------------------------------------------------------------------------------------------------------------------
 ce__cycles_active.avg                                                                          counter     cycle          Average active cycles across CEs
 ce__cycles_active.max                                                                          counter     cycle          Maximum active cycles on any single CE
 ...
 dram__bytes_read.sum                                                                           counter     byte           Total bytes read from DRAM
 dram__bytes_read.sum.pct_of_peak_sustained_elapsed                                             counter     %              Percentage of peak sustained read throughput
 dram__bytes_read.sum.per_second                                                                counter     byte/second    Bytes read from DRAM per second
 ...
 l2__transaction_hit_rate                                                                       ratio       unitless       Hit rate for cacheable requests to the L2 cache
 l2__transaction_hit_rate.pct                                                                   ratio       %              Hit rate for cacheable requests to the L2 cache, as a percentage
 ...
-
Metric namecolumn: The name of the metric. -
Typecolumn: The metric type. Valid types are:-
Counter: A raw counter from the PPU. -
Ratio: A ratio of twoCountervalues. -
Throughput: A value calculated from a group ofCounter-type metrics. The value of each metric is then expressed as a percentage of the PPU's peak performance. The throughput is the highest of these percentages.
-
-
Unitcolumn: The unit of the metric. -
Metric descriptioncolumn: Describes what the metric measures.
Tips: In the Asight Compute GUI, hover over a performance metric or open the Metric Details page to view its description.

1.2 Specify the metric set
Specify the set of metrics to collect at one of three granularity levels: set, section, or metric.
The combined effect of the three granularities is as follows:
-
If you do not specify the
--set,--section, or--metricsoption, the default set is used. -
If you specify
--sectionor--metrics, the--setoption is ignored. -
The
--sectionand--metricsoptions can be used together. The effective metric set is the union of both.
Tips: The higher the granularity, the more metrics are collected. If the number of metrics to collect exceeds PPU capacity, the application might be replayed multiple times to collect all metric data. This increases the ACU's profiling time.
1.2.1 Specify collection set
Use the --set option to enable a metric set. The basic rules are as follows:
-
Only one set can be enabled.
-
If
--setis not specified, and neither--sectionnor--metricsis specified, the default set is enabled automatically.
To enable the detailed set, run the following command:
acu -o test_report -f --set="detailed" ./cuda_test 10The default set excludes certain metrics, such as memory throughput. To collect all metrics, enable the full set with the following command:
acu -o test_report -f --set="full" ./cuda_test 101.2.2 Specify collection section
Use --section to specify which metric sections to enable. The basic rules are as follows:
-
Each
--sectionoption specifies a matching rule for a section. -
Sections can be matched in two ways:
-
Exact match: Specify the section identifier. Only sections whose identifiers match exactly will be enabled. (You can view section identifiers with the
--list-sectionsoption.) -
Regular expression match: Specify a regular expression using the syntax
regex:<expression>. All sections whose identifier matches the expression will be enabled.
-
-
If you specify multiple
--sectionmatching rules, only the last one applies.
For example, the regular expression "regex:.*WorkloadAnalysis" enables all sections ending with WorkloadAnalysis, such as ComputeWorkloadAnalysis and MemoryWorkloadAnalysis.
acu --section="regex:.*WorkloadAnalysis" python test_linear.pyFor example, if you specify SpeedOfLight and then SchedulerStats as precise matching rules, only sectionSchedulerStats is collected.
acu --section SpeedOfLight --section SchedulerStats python test_linear.pyTip: Because the Linux shell may interpret regular expression syntax, enclose the parameter in double quotes when using a regular expression to specify a section. For example: --section="regex:.*Analysis.*".
1.2.3 Specify metrics
Use the --metrics option to specify which metrics to enable. The basic rules are as follows:
-
Separate multiple metric names with a
,. Use--list-metricsto view supported metric names. -
If you specify the
--metricsoption multiple times, only the last instance takes effect. -
If you also specify
--section, both the metrics in that section and those specified by--metricsare collected. -
The
--metricsoption supports two name matching patterns:-
Exact match. This can be one of the following:
-
The full name of the metric.
-
A metric group, using the syntax
group:<group name>. This collects all metrics in the specified group. -
A metric breakdown, using the syntax
breakdown:<metric name>. This collects and calculates all sub-metrics for the specified metric.
-
-
Regex matching: Use the syntax
regex:<expression>to collect all metrics matching the regular expression<expression>.
-
Tip:
-
Use the
--list-metricscommand-line option to query metric groups and breakdowns. -
Because the Linux shell might interpret regular expression syntax, enclose the parameter value in
""when specifying a metric with a regular expression. For example:--metrics="regex:dram.*".
For example, to collect the ce__cycles_active.max and dram__bytes.sum.per_second metrics, run the following command:
acu --metrics=ce__cycles_active.max,dram__bytes.sum.per_second python test_linear.pyFor example, to collect all metrics in the memory__chart group, run the following command:
acu --metrics="group:memory__chart" python test_linear.pyFor example, to collect and calculate all sub-metric values for cu__throughput.avg.pct_of_peak_sustained_elapsed and ppu__compute_memory_throughput.avg.pct_of_peak_sustained_elapsed without calculating the parent metrics, run the following command:
acu --metrics=breakdown:cu__throughput.avg.pct_of_peak_sustained_elapsed,breakdown:ppu__compute_memory_throughput.avg.pct_of_peak_sustained_elapsed python test_linear.pyFor example, to collect all metrics whose names contain cycles_elapsed, such as ce__cycles_elapsed.avg.per_second and ce__cycles_elapsed.max, run the following command:
acu --metrics="regex:cycles_elapsed.*" python test_linear.pyFor example, to use a regular expression to collect all metrics that start with 'dram' (such as dram__bytes.sum.peak_sustained and dram__bytes.sum.per_second, while excluding ppu__dram_throughput.avg.pct_of_peak_sustained_elapsed), run the following command:
acu --metrics="regex:^dram.*$" python test_linear.py1.2.4 Metric collection from custom sections
If the built-in metrics in Asight Compute's Section files do not meet your analysis needs or you need to define custom metric calculation formulas, create a custom Section file.
Place a custom section file in the $PPU_SDK/asight/sections directory. To make it available in the GUI, you must also place it in the <Asight Install Path>/sections directory.
A section file must contain the following:
Identifier: "Custom"
DisplayName: "Custom"
Description: "Custom"
Sets {
    Identifier: "default"
}
MetricDefinitions {
    MetricDefinitions {
        Name: "derived__test_metric"
        Expression: "dram__bytes_read_sum + dram__bytes_write.sum"
    }
    ...
}
Header {
    Metrics {
        Label: "Dram Total Bytes"
        Name: "derived__test_metric"
    }
    ...
}-
The
Identifiermust be unique across all section files. -
Setsspecifies the set to which the current section belongs. If this is set todefault, theacucommand can collect data for this section without specifying themetric,section, orsetparameters. -
MetricDefinitions: Defines custom metrics. Metrics defined here are used for calculations but do not automatically trigger data collection. This section has a two-level structure.-
The first level is a list of metric definitions.
-
The second level specifies the details for each metric.
-
Name: Specifies the name of the metric, which must be unique. Use the prefix
derived__. The name cannot contain special characters other than the underscore (_). -
Expression: Specifies the expression to calculate the custom metric. It can use built-in metrics as operands, but not other custom metrics. The expression supports the
+ - * /operators and themaxandminfunctions.-
For example:
Expression: "M1 + M2 * (M3 + M4) + max(M5, M6, M7) ".
-
-
-
-
Header: Defines the metrics to be collected and displayed. You can define multiple
Metricsblocks within theHeader. Metrics defined here appear on the detail page.-
Metricsdefined in the Header can be displayed by usingacu --list-metricand are used for collection. The Name inMetricsmust be an internal Metric Name or a Metric Name declared in theMetricDefinitionsabove.
-
1.3 Specify replay mode
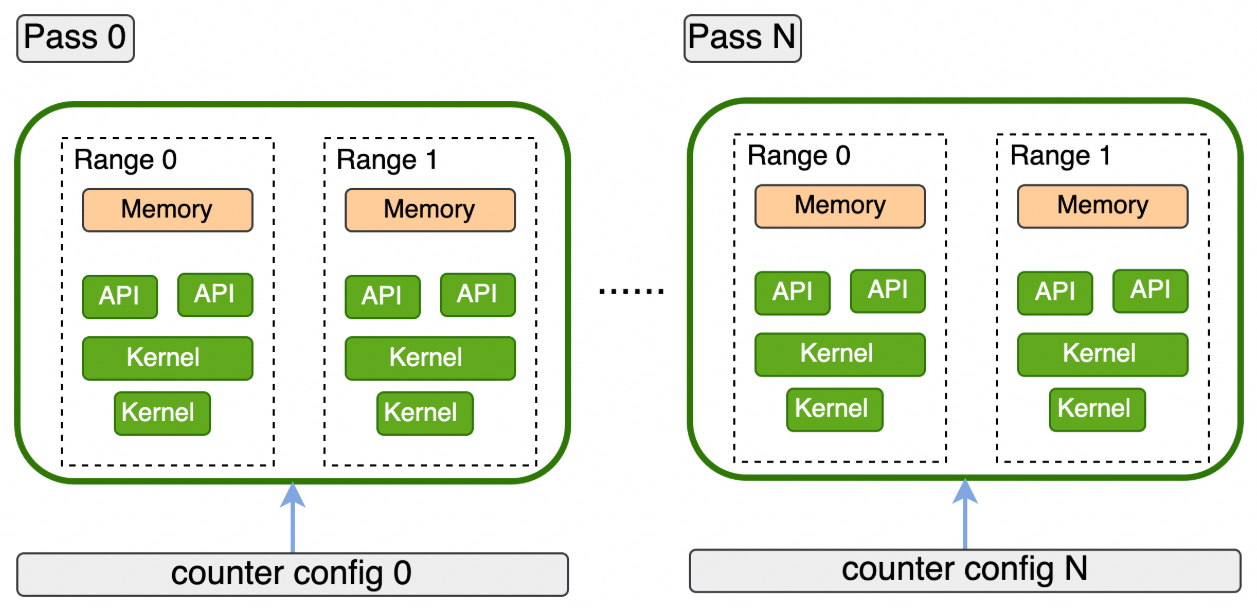
A PPU can collect a limited number of hardware performance counters simultaneously. If the metrics require more counters than this limit, acu replays the kernel multiple times. Each replay is called a pass, and for each pass, acu applies a different counter configuration to ensure all metric data is collected.
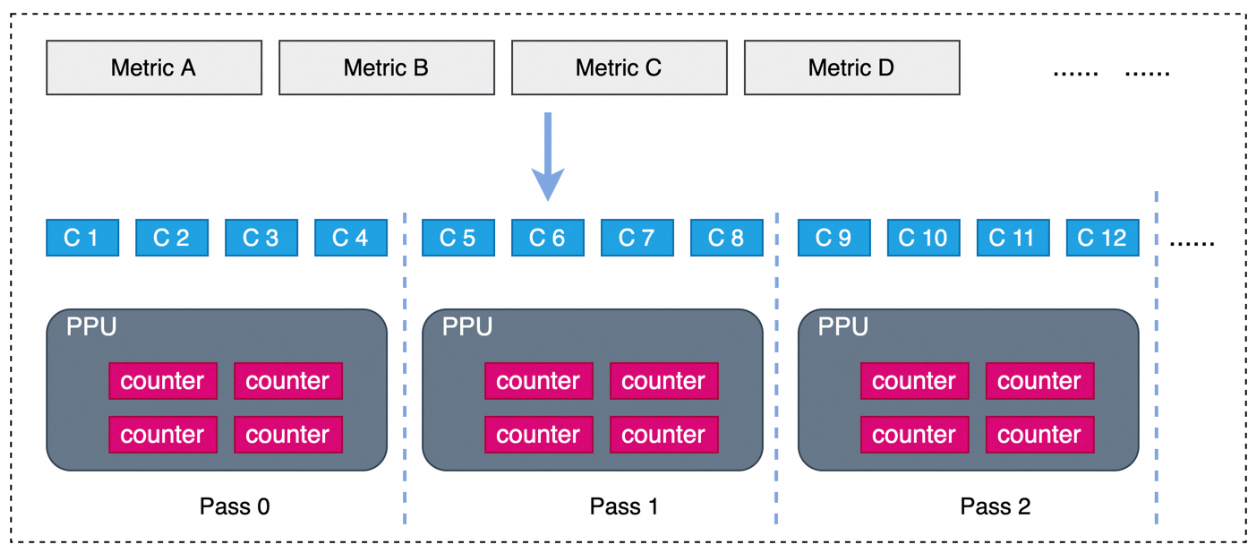
acu defaults to kernel replay mode for data collection. Use the --replay-mode option to specify a different mode:
|
Replay mode |
Description |
Profiling object |
Number of executions |
Save/restore memory |
Overhead |
Inapplicable scenarios |
|
kernel |
Replays each kernel sequentially within a single application execution. |
kernel |
1 |
Yes |
|
When kernels must execute concurrently. |
|
application |
Executes the application multiple times. Each execution is a replay pass to sequentially collect performance metrics for each kernel. |
kernel |
Multiple |
No |
Time for multiple application startups |
|
|
range |
Replays each range sequentially within a single application execution. A range can include kernel launches and HGGC API calls. |
range |
1 |
Yes |
|
|
|
app-range |
Executes the application multiple times. Each execution is a replay pass to sequentially collect performance metrics for each range, which can include kernel launches and HGGC API calls. |
range |
Multiple |
No |
Time for multiple application startups |
Applications with non-deterministic behavior. |
Since each replay mode affects an application differently (for example, by altering the execution order of kernels or introducing performance overhead), select the mode best suited to your application.
For example, you can use kernel replay mode to collect performance data.
acu --replay-mode kernel python test_linear.py1.3.1 Kernel replay mode
Kernel Replay mode collects all metric data by running each kernel multiple times within a single application execution. It first backs up the PPU device memory before the initial kernel run. It then restores this backup from the first pass before each subsequent kernel replay.
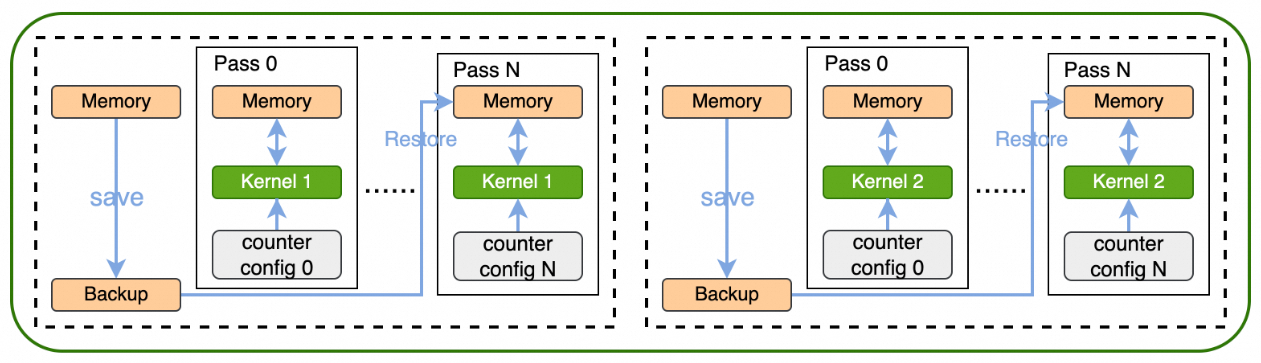
The key features of kernel replay mode are:
-
The replay completes within a single application execution.
-
Performance data is collected at the kernel level.
-
The application's kernels are forced to run serially.
-
Backing up and restoring memory before each kernel execution increases the total application runtime.
-
Memory backup consumes device memory.
Because Kernel Replay forces kernel serialization during profiling, it is not suitable for all applications. The following sections detail its use cases and limitations.
Scenarios
-
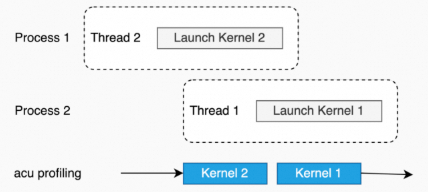
Single-process, single-thread (all kernels launch sequentially in a single thread).
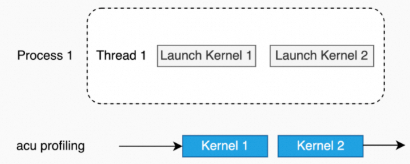
-
Single-process, multi-thread (kernels in different threads are independent).
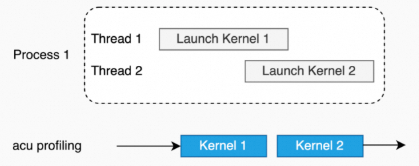
-
Multi-process (kernels in different processes are independent).

-
Graph scenario
You can profile kernel nodes in a Graph. To enable this feature, use the
--graph-profiling nodeoption. For more information, see Graph Profiling in node mode.
Inapplicable scenarios
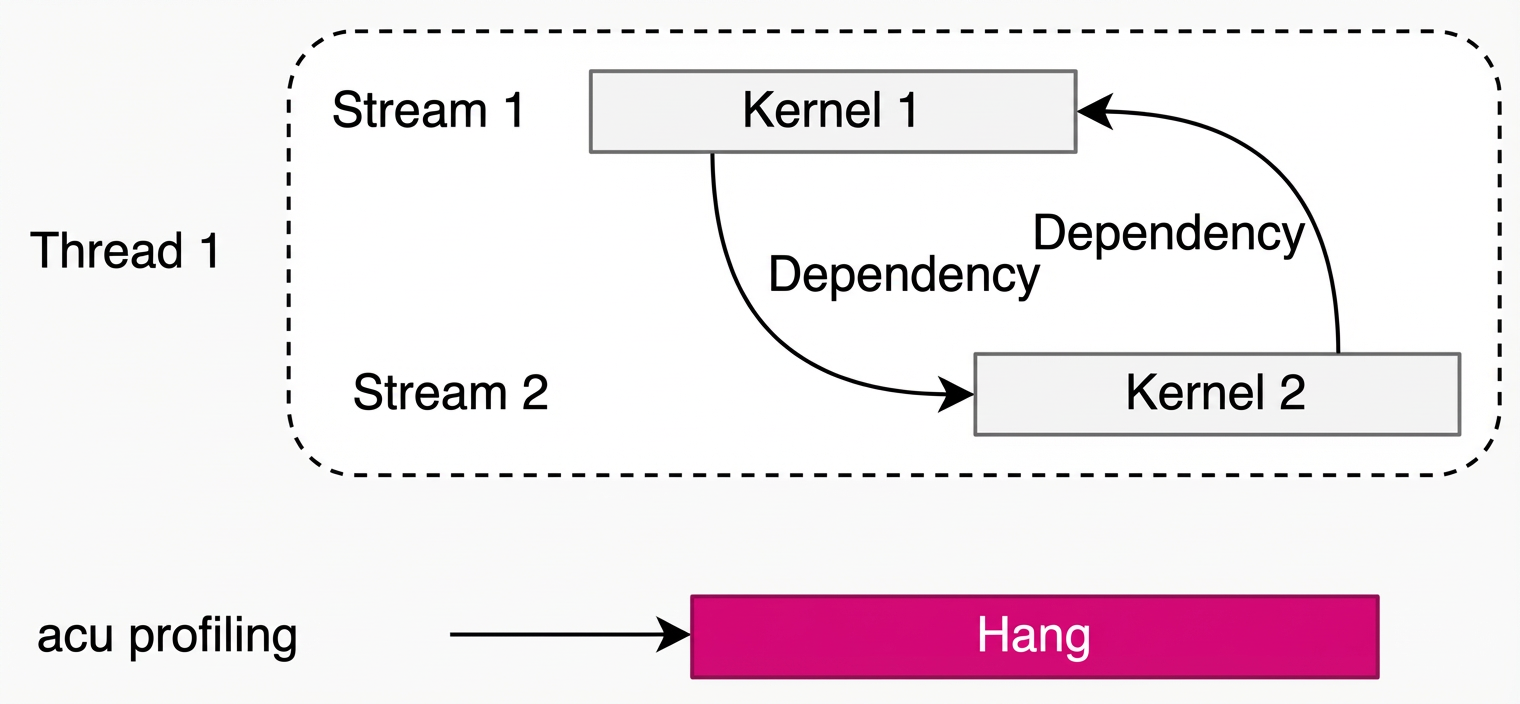
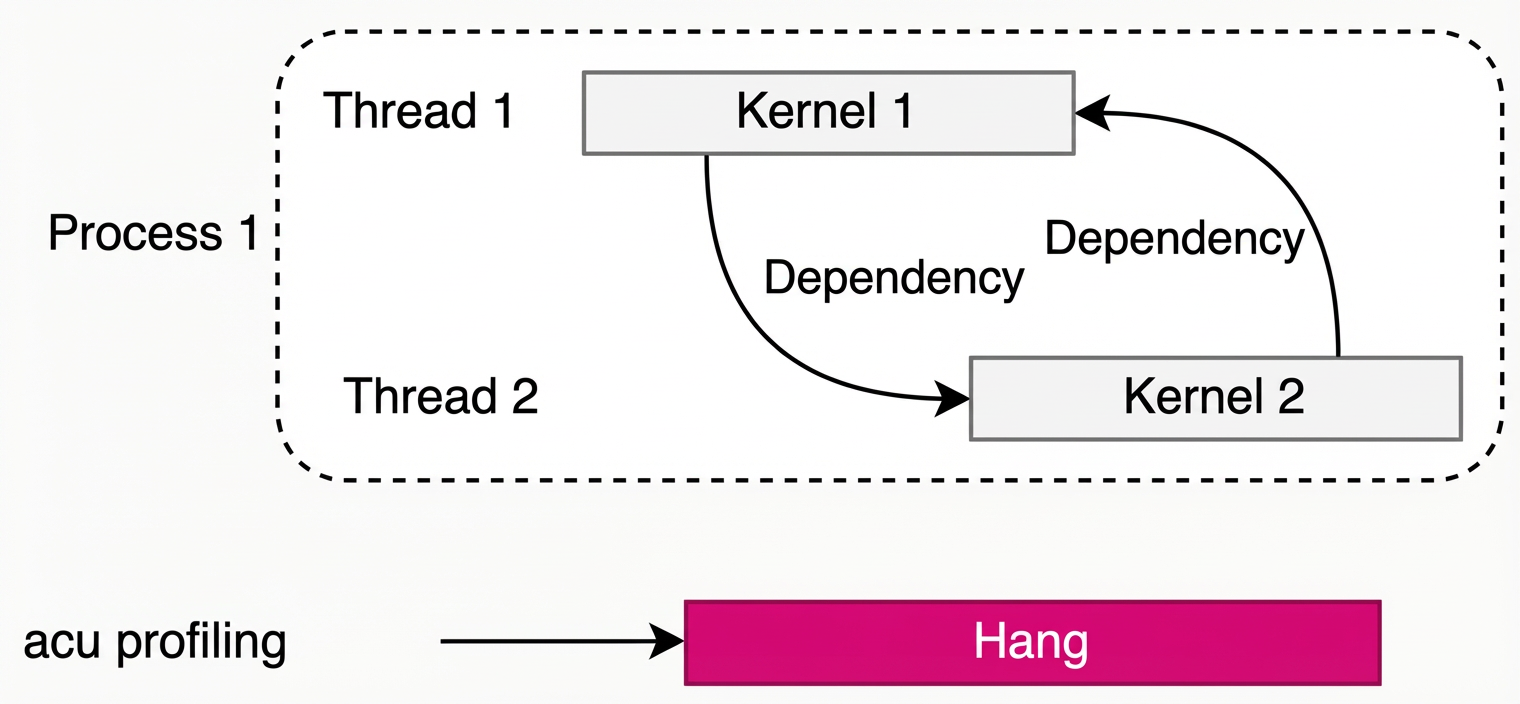
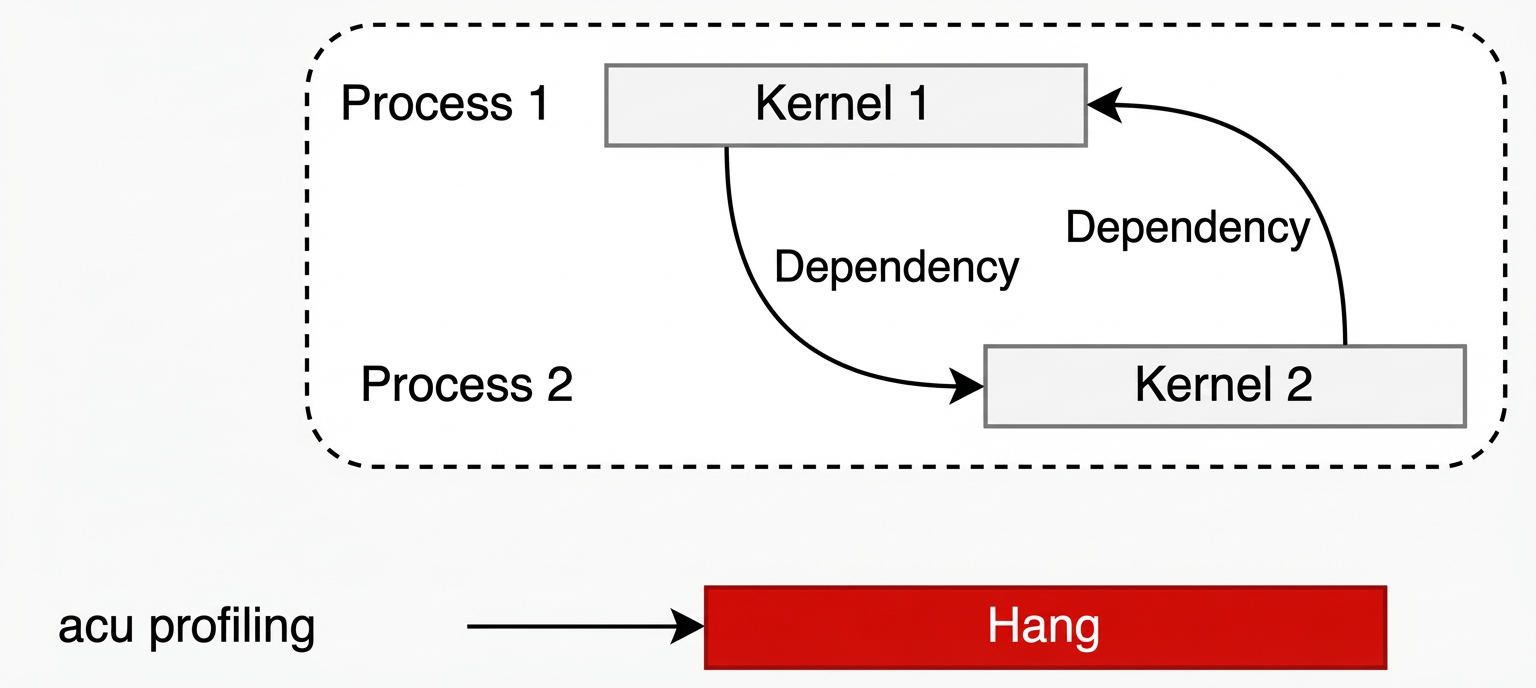
In Kernel Replay mode, an application can hang due to inter-kernel dependencies.
-
Single-process, single-thread applications with inter-kernel dependencies.
Example: pccl-tests (1 process, 1 thread, and 2 ranks).
acu --set full -f -o all_reduce_2_ranks_2M ./build/all_reduce_perf -g 1 -t 2 -n 1 -w 0 -b 2M -e 2M -c 0 -
Single-process, multi-thread applications with inter-kernel dependencies across different threads.
Example: pccl-tests (1 process, 2 threads, and 1 rank per thread).
acu --set full -f -o all_reduce_2_ranks_2M ./build/all_reduce_perf -g 1 -t 2 -n 1 -w 0 -b 2M -e 2M -c 0 -
Multi-process applications with inter-kernel dependencies across different processes.
Example: pccl-tests (2 processes, 1 thread per process, and 1 rank per thread).
ncu --set full --replay-mode kernel --target-processes all -o all_reduce_perf_kernel_p2_t1_g1 mpirun -np 2 --allow-run-as-root ./build/all_reduce_perf -g 1 -t 1 -n 1 -w 0 -b 2M -e 2M -c 0
1.3.2 Application replay mode
Application Replay mode runs the application multiple times to collect all metric data. Since this mode restarts the application for each run, it eliminates the need to back up and restore memory for each kernel. However, the application's behavior must be as consistent as possible across runs (e.g., the name, number, and execution order of the kernels).
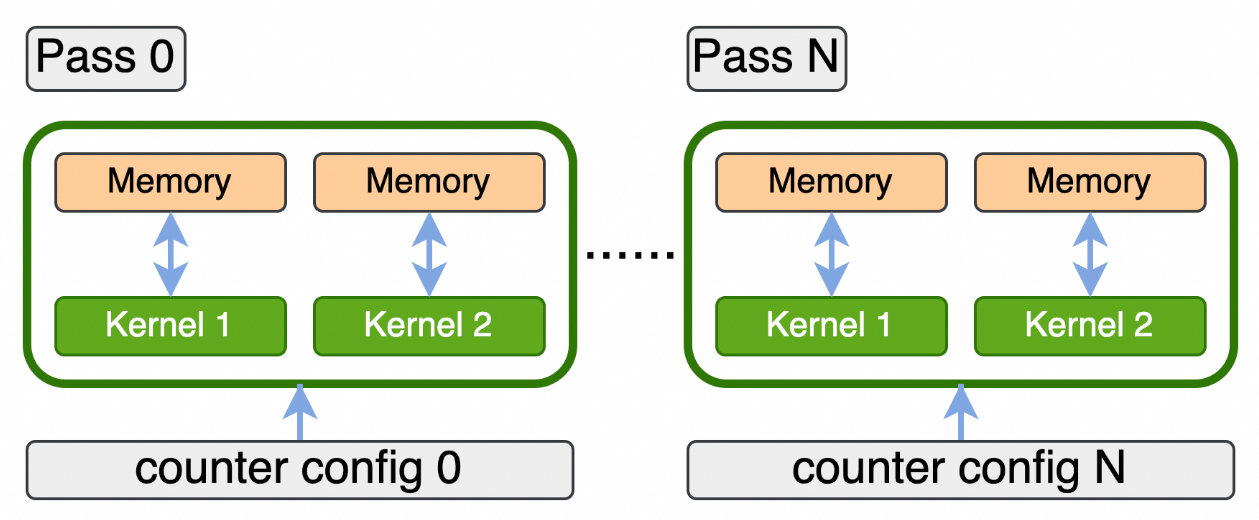
Key features of application replay mode include:
-
The application runs multiple times to collect all metric data.
-
Performance data is collected at the kernel level.
-
Application kernels are forced to execute serially.
-
If the application has slow host-side operations, like initialization, multiple replays increase the total execution time.
Scenarios
Since Application Replay and Kernel Replay both force kernel serialization during profiling, they share the same use cases and limitations. For details, see Kernel Replay's use cases and inapplicable scenarios.
In an application replay, metric data for a single kernel is scattered across multiple runs. This makes it difficult to match the kernel between runs. To solve this, acu provides the --app-replay-mode and --app-replay-match command-line options.
Kernel matching mode
acu provides the --app-replay-mode option, which controls whether to enforce strict consistency in application behavior across multiple executions during kernel matching in Application Replay. Two modes are available:
|
Value |
Description |
|
strict |
Default. All kernels in each application execution must match those from the first. A mismatch in any pass aborts the profiling process. |
|
relaxed |
Allows kernels to differ across application executions, outputting metric data only for matching kernels. |
Tip: An application that fails to generate a report in strict mode has non-deterministic execution behavior. You can try relaxed mode, but the resulting report may lack performance data for some kernels.
Kernel matching policy
acu provides the --app-replay-match option to specify the kernel matching strategy for Application Replay. This strategy defines the criteria for what constitutes a match between two kernels. acu supports the following three matching strategies:
|
Value |
Description |
|
name |
Matches kernels by the following criteria, in order of precedence:
|
|
grid |
Default value. Matches kernels by the following criteria, in order of precedence:
|
|
all |
Matches kernels by the following criteria, in order of precedence:
|
Example: Collect performance data using application replay mode, with relaxed mode and the grid matching strategy:
acu --replay-mode application --app-replay-mode relaxed --app-replay-match grid python test_linear.py1.3.3 Range Replay mode
Range Replay mode collects metrics by repeatedly replaying a Range containing kernel launches and HGGC API calls during a single application run. These metrics apply to the entire Range, not to any specific kernel within it. To enable this, Range Replay captures the kernel launches and HGGC API calls within the Range and saves and restores the necessary Host and Device memory.
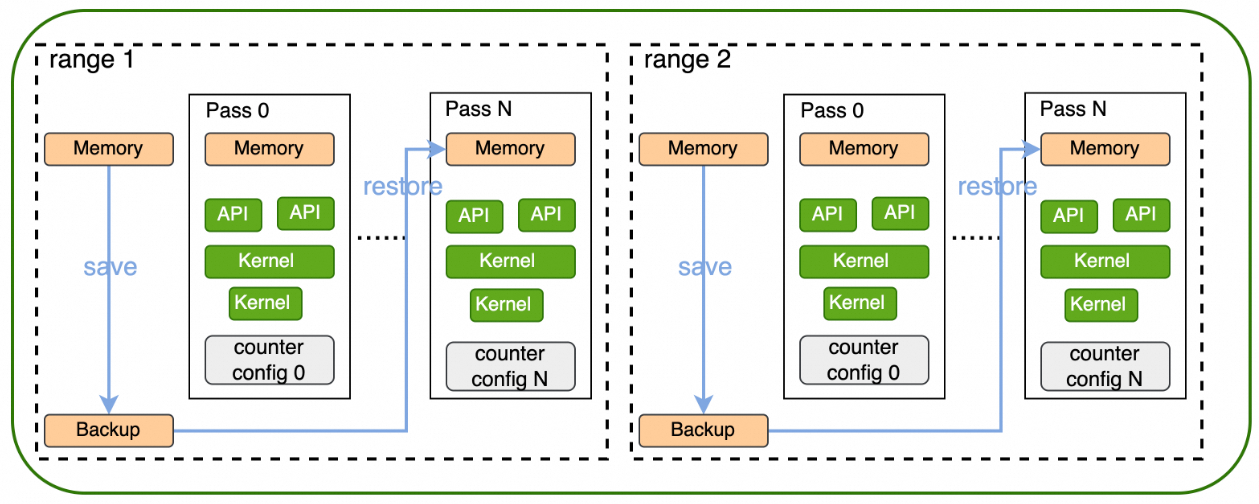
Key features of Range Replay mode include:
-
A replay completes within a single application execution.
-
Performance data is collected at the range granularity, not the kernel granularity.
-
Multiple kernels within a range can execute in parallel and are not forcibly serialized.
-
Replaying a range involves memory backup and restore operations, increasing the application's execution time.
-
Only a subset of HGGC APIs can be used within a range.
-
Range replay affects only PPU device behavior, not host application behavior.
-
An application defines a range by calling
hg(gc)ProfilerStartandhg(gc)ProfilerStop. This allows acu to synchronize all contexts at the start of the range. -
You can profile only one PPU device per range.
Defining a range
To use Range replay, you must specify a profiling range in your application. A range is a collection of all HGGC API calls and kernels launched from any CPU thread between a start and an end marker. Your application must insert the appropriate synchronization between threads to ensure it captures the intended API calls. You can define a range in one of two ways:
Profiler Start/Stop API
Use hg(gc)ProfilerStart and hg(gc)ProfilerStop to set the start and end markers, which is the default method for defining a range in Asight Compute.
hggcProfilerStart();
/* Code to profile, including HGGC API calls and kernels. */
hggcProfilerStop();
HGTX range
Use an HGTX include expression to define a range. A range begins with the first HGGC API call that matches the expression and ends with the last matching API call. If you specify multiple expressions, a match on any of them defines a range. This lets you capture and analyze multiple ranges within a single application execution. For an expression to match, the application must mark the corresponding range using the HGTX API. For example, in the cuda_test program, define an HGTX range named Range 1:
hgtxRangeId_t r1 = hgtxRangeStartA("Range 1");
/* Sample workload for profiling, including HGGC API calls and kernels. */
hgtxRangeEnd(r1);
To profile the code in Range 1 of the cuda_test program, use the following command.
acu --hgtx --hgtx-include "Range 1" cuda_testNote:
In the preceding example, to define the range with push/pop instead of start/end, update the acu command to --hgtx-include "Range 1/". For more information, see HGTX filtering.
You cannot use hgtx-exclude in the range definition expression for range and application range replay.
-
If you specify
--hgtx --hgtx-include --hgtx-exclude, the system ignores --hgtx-exclude and displays a message indicating that --hgtx-exclude is not supported. -
If you specify
--hgtx --hgtx-exclude, the following error is reported:==ERROR== Option hgtx-exclude is not supported during range replay.
Scenarios
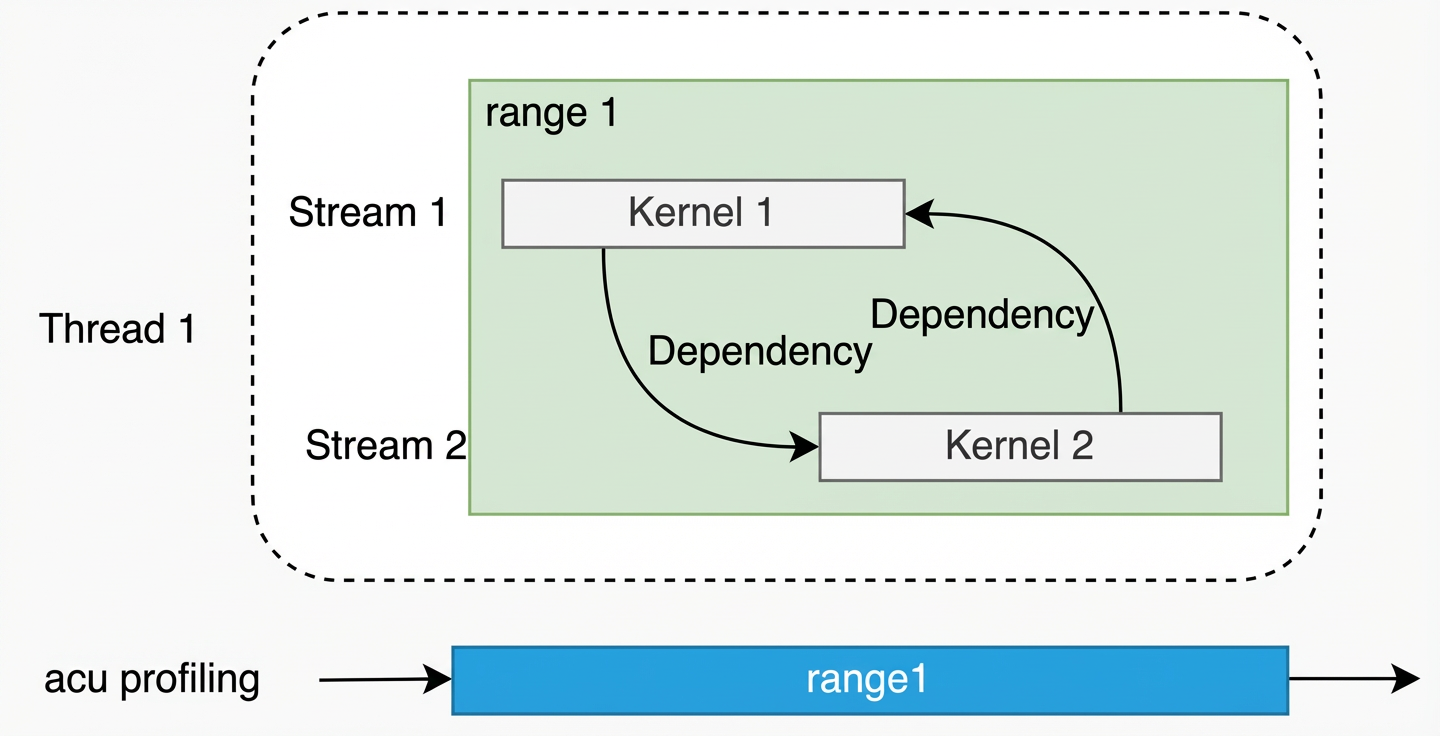
While Range Replay can also run in the three applicable scenarios for Kernel Replay, it primarily profiles multiple kernels executing in parallel (handling Kernel Replay's inapplicable scenarios, specifically cases 1 and 2).
-
Single process, single thread (with dependent kernels in the same range).
Example: pccl-tests (1 process, 1 thread, 2 ranks).
acu --set full --replay-mode range -o all_reduce_perf_range_p1_t1_g2 ./build/all_reduce_perf -g 2 -n 1 -w 0 -b 2M -e 2M -c 0 -
Single process, multi-thread (with dependent kernels in the same range).
Example: pccl-tests (1 process, 2 threads, 2 ranks).
acu --set full --replay-mode range -f -o all_reduce_2_ranks_2M ./build/all_reduce_perf -g 1 -t 2 -n 1 -w 0 -b 2M -e 2M -c 0
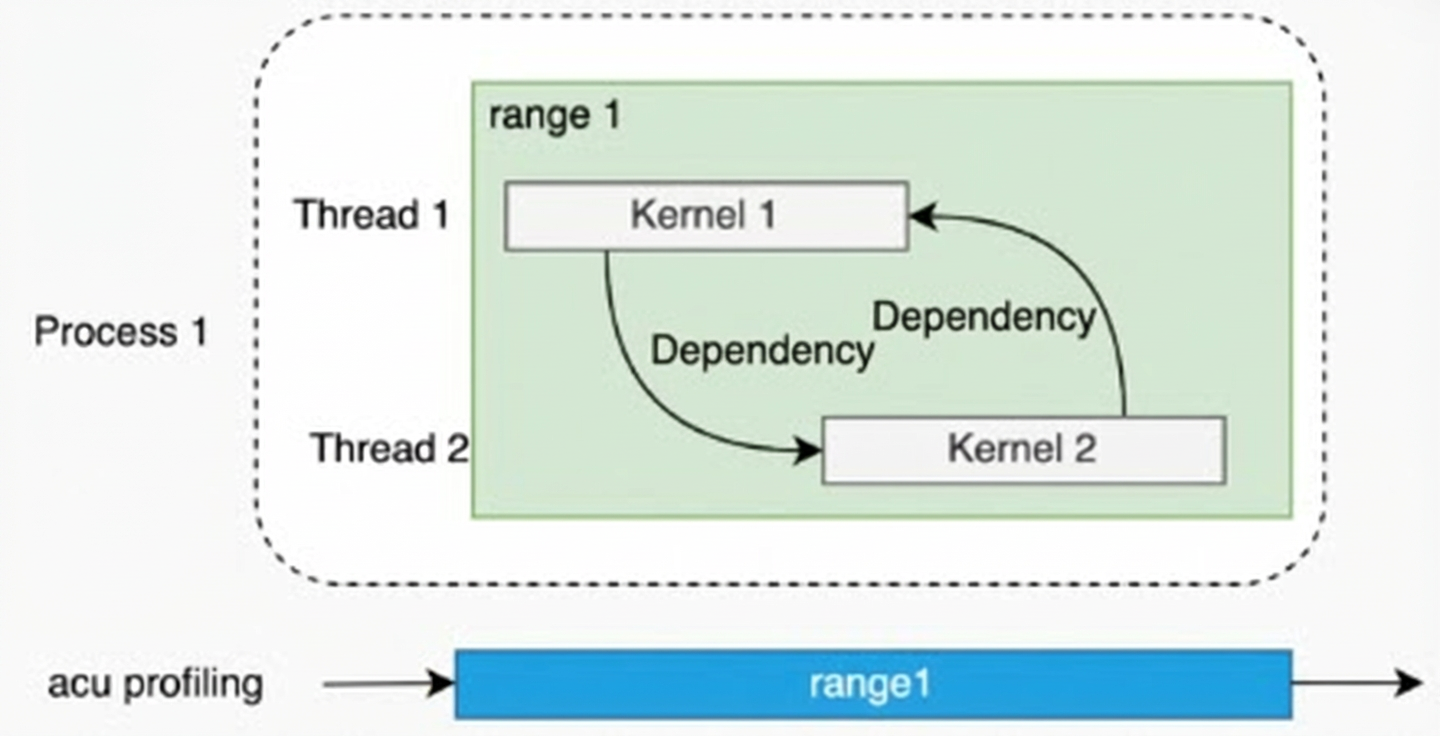
Unsupported scenarios
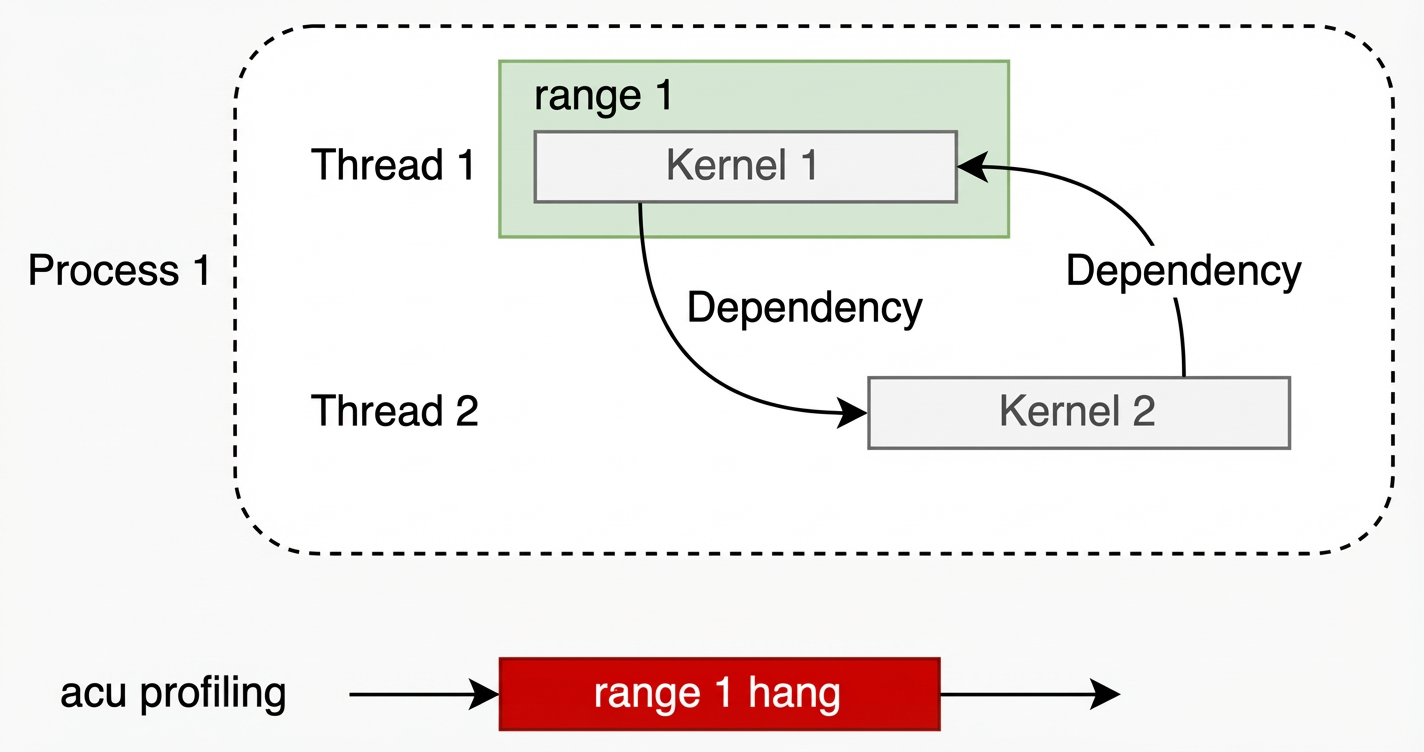
Range Replay operates at the process level. If interdependent kernels run in different threads, ensure the range includes all of them. Otherwise, the process can hang.
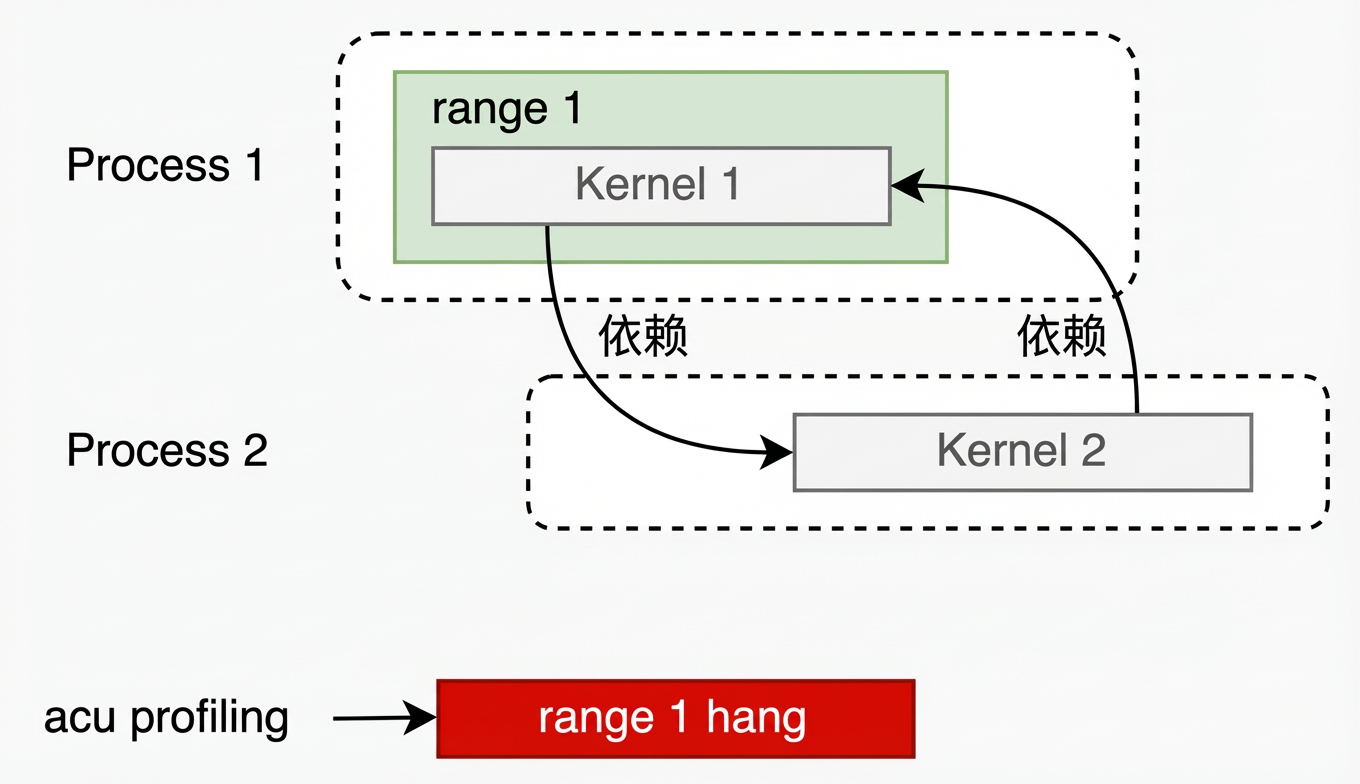
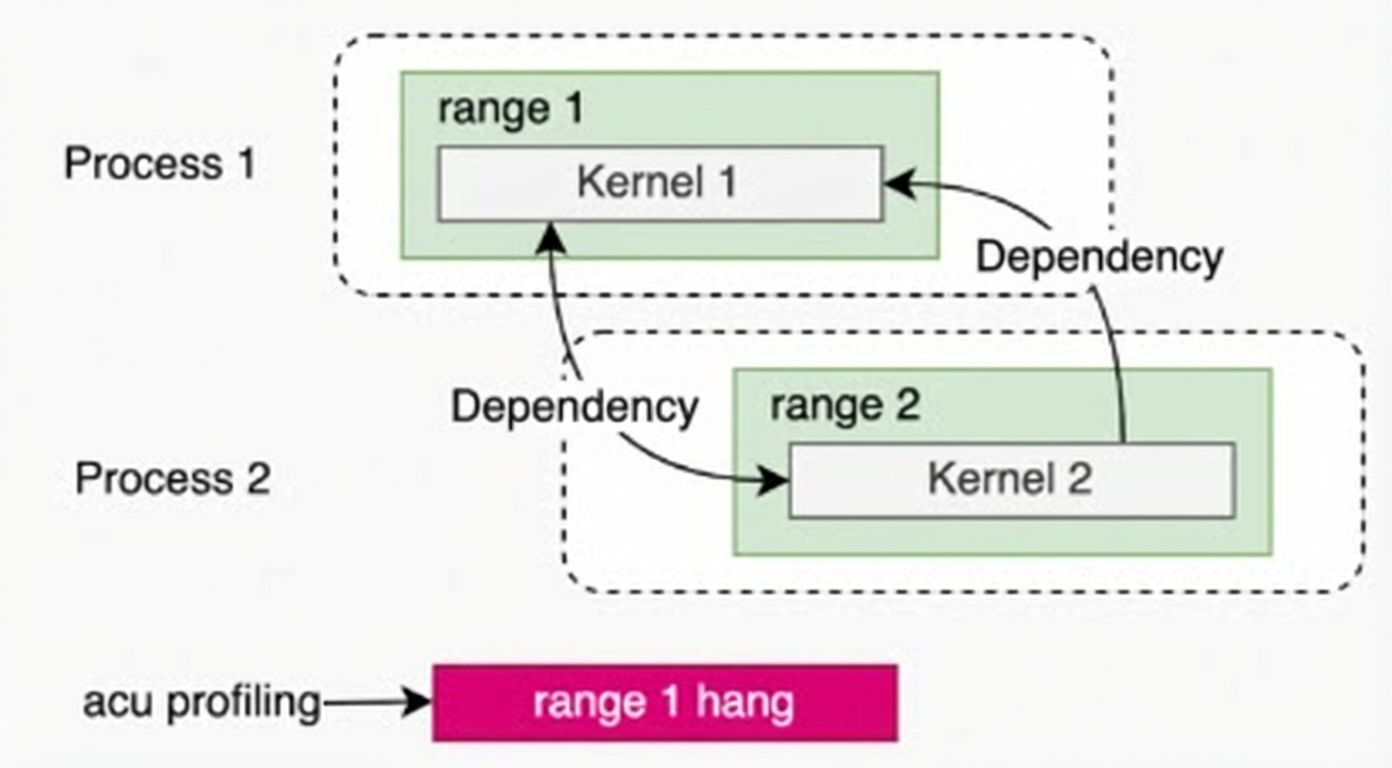
Because Range Replay enforces serialization on ranges, a process can hang if one of its ranges depends on the kernel or a range from another process.
-
Single-process, multi-threaded applications where interdependent kernels are not in the same range.
-
Multi-process applications where a range in one process depends on a kernel in another process.
Example: pccl-tests (2 processes, 1 thread per process, 1 rank per thread, with a range defined on only one rank).
acu --set full --replay-mode range --target-processes all -o all_reduce_perf_range_p2_t1_g1 mpirun -np 2 --allow-run-as-root ./build/all_reduce_perf -g 1 -t 1 -n 1 -w 0 -b 2M -e 2M -c 0 -j 0 -
Multi-process applications where a range in one process depends on a range in another process.
Example: pccl-tests (2 processes, 1 thread per process, 1 rank per thread, with ranges defined on both ranks).
acu --set full --replay-mode range --target-processes all -o all_reduce_perf_range_p2_t1_g1 mpirun -np 2 --allow-run-as-root ./build/all_reduce_perf -g 1 -t 1 -n 1 -w 0 -b 2M -e 2M -c 0
1.3.4 Application range replay
In Application Range Replay mode, requested metrics are grouped into one or more passes. Like Range Replay, metrics apply to the entire selected range, not a single kernel. The tool does not need to serialize workloads (such as kernels and graphs), which allows for performance analysis of concurrent workloads.
Unlike Range Replay, this approach does not explicitly capture a range for repeated execution. Instead, it reruns the entire application multiple times, with each run being a pass that collects metrics for every range. The advantage is that it avoids tracking and capturing the application state for each range, such as saving and restoring memory, because the application itself ensures each range executes correctly.
The range is defined the same as in Range Replay, and its workload must be deterministic.
Scenarios
Unlike Range Replay, Application Range Replay handles unsupported scenario 2, provided that only one process defines the range.
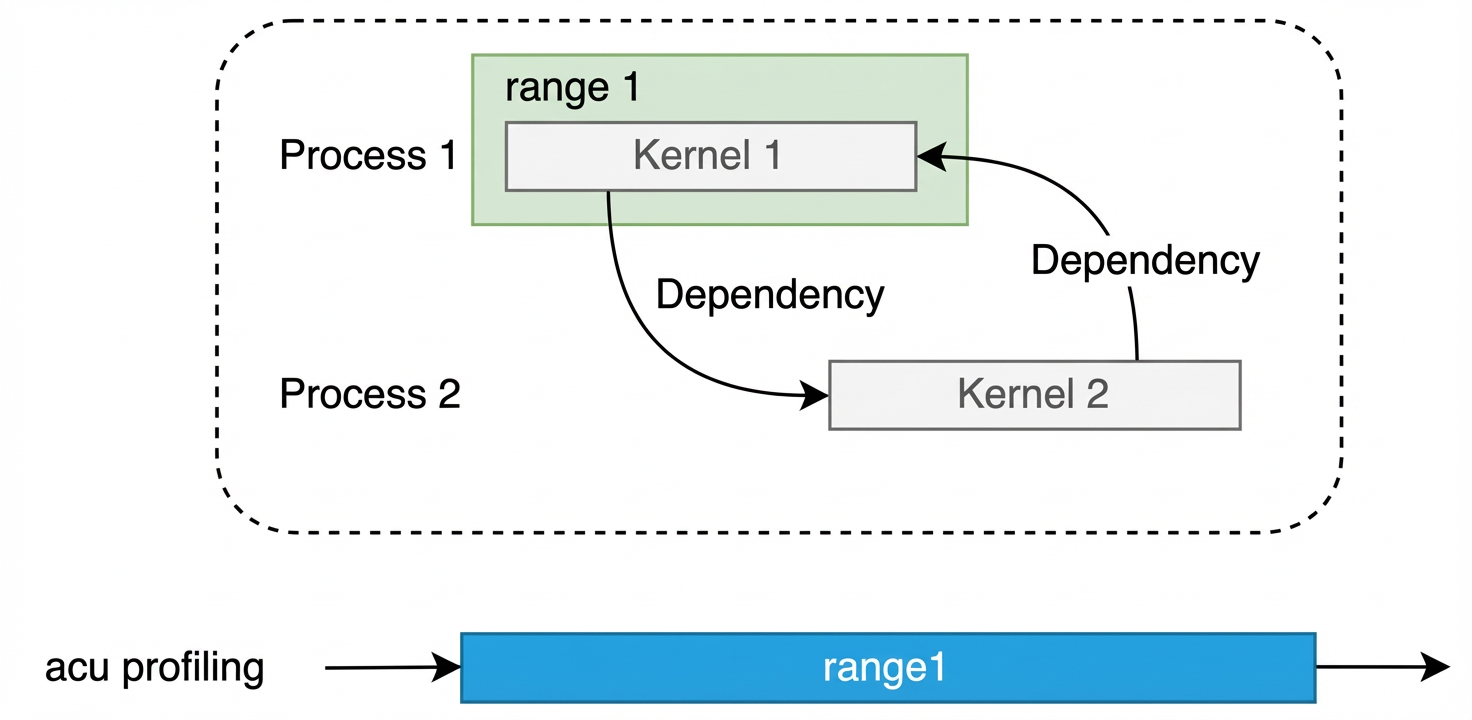
Example:pccl-tests (2 processes, 1 thread per process, 1 rank per thread, with a range on only 1 rank).
acu --section Icnlink --replay-mode app-range --target-processes all mpirun -np 2 --allow-run-as-root ./build/all_gather_perf -g 1 -t 1 -n 1 -w 0 -b 512M -e 512M -c 0 -q 1 -s 1 -j 0Unsupported scenarios
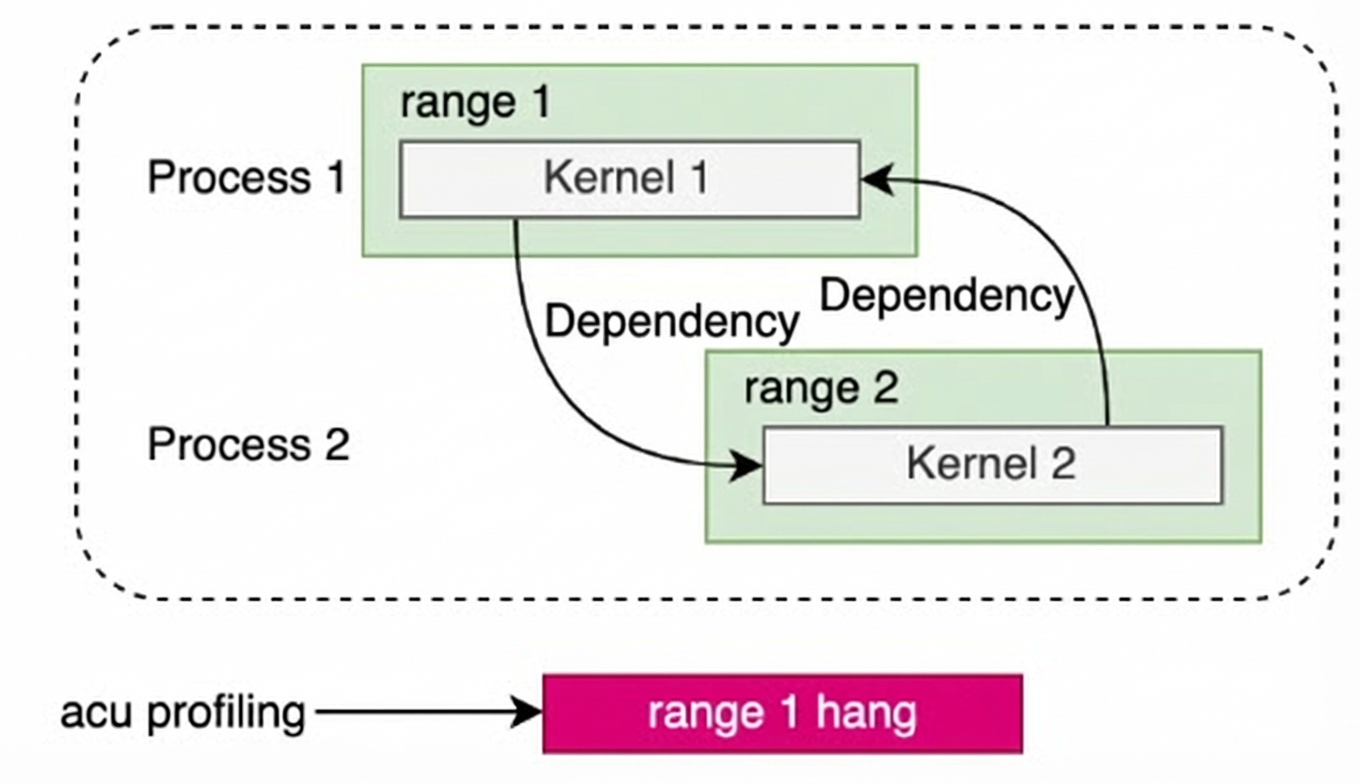
A multi-process application can hang if each process defines a range and dependencies exist between the kernels in those ranges.
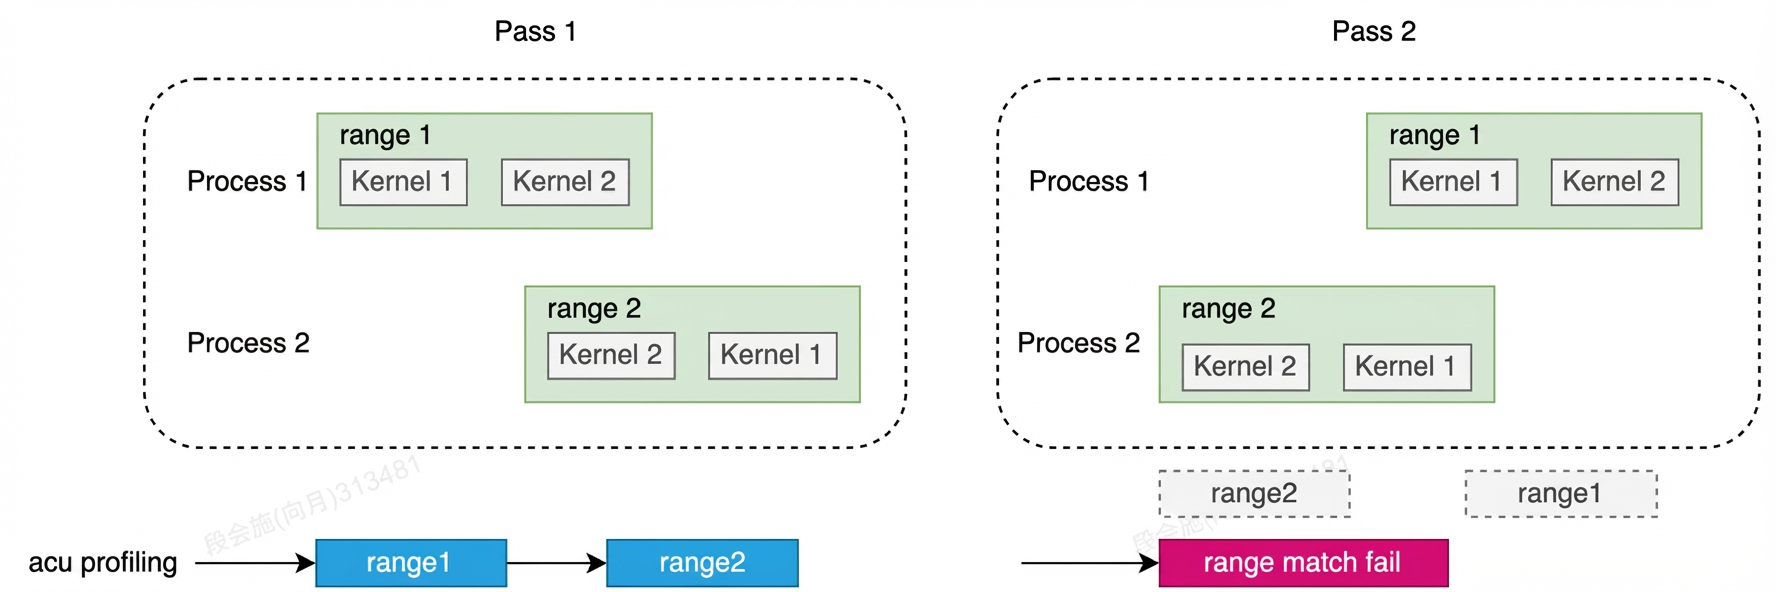
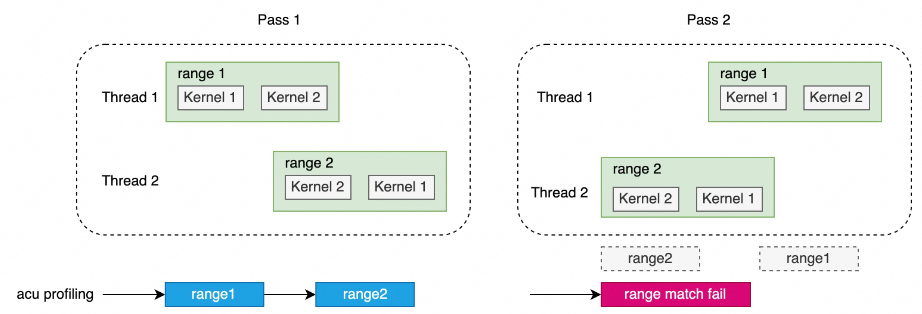
If the execution order of ranges is non-deterministic across replays, performance data cannot be matched by range, and no report will be generated.
-
Multi-process (two ranges, where one depends on the other).
-
Multi-process (two independent ranges with an unguaranteed execution order).
-
Multi-thread (two independent ranges with an unguaranteed execution order).
1.3.5 Graph profiling
You can use acu to profile either the entire graph or individual kernel nodes. Use the --graph-profiling option to select the mode.
Graph Mode
Graph Profiling's graph mode profiles an HGGC graph by treating it as a single workload entity.
To enable this feature, use --graph-profiling graph.
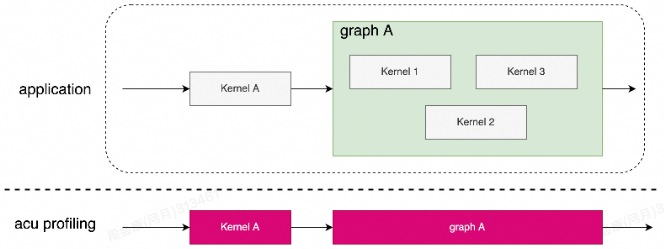
Key use cases for this mode include:
-
For graphs with kernel nodes that require concurrent execution.
-
When you need a more accurate performance analysis of a graph with multiple kernel nodes.
Node mode
In node mode, Graph Profiling treats each kernel node in an HGGC graph as an individual workload entity.
Enable this feature with the --graph-profiling node option.
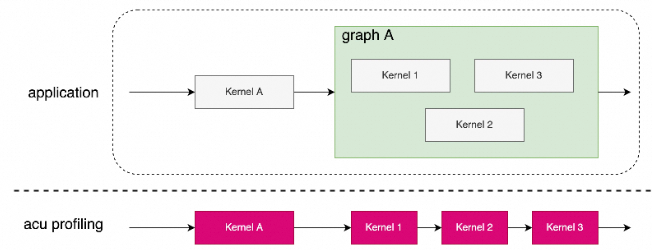
Use cases for this mode include:
-
You need to accurately analyze the performance of individual kernel nodes in the graph.
-
The kernel nodes in the graph have no dependencies.
Consider the following when enabling graph profiling:
-
Specify
--replay-mode kernel, as graph mode is the default. -
If graph performance is not a concern, you can disable graph profiling with
--graph-profiling none. -
Graph mode does not provide certain performance metrics, such as instruction statistics.
1.4 Get kernel source files
acu collects Kernel source files from a target application and embeds them in the report. This allows the Source Page to display the Kernel's source code when you open the report in the GUI, even if the original source files are missing from the environment. This eliminates the need to manually select a Kernel source path.
By default, acu does not collect kernel source files. To collect them, use the --import-source yes parameter. For example:
acu --import-source yes <other acu param> <target program>To collect kernel source files, compile the target application with the -lineinfo option. To ensure an accurate mapping between assembly code and source line numbers, also include debug information. For example: nvcc -g --lineinfo -O0 -o <my_program> <my_program.cu>.
2. Control the ingestion process
2.1 Specify the collector
Use --devices to specify which PPU devices to enable for collection.
-
Specify devices by their index (a zero-based number assigned when the PPU device powers on).
-
Separate multiple PPU devices with a
,. -
If no devices are specified, the system collects data from all PPU devices by default.
For example, to collect performance data from PPUs 1 and 2:
acu --devices 1,2 python test_linear.py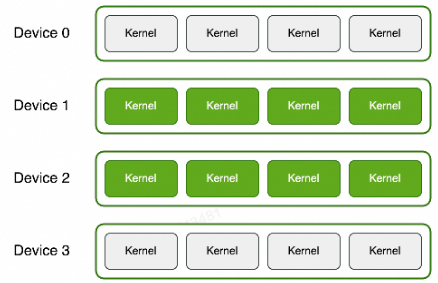
Note: In range replay mode, you can specify only one PPU device for the --devices option.
2.2 Collection time range
Use the --profile-from-start option to specify whether to start metric collection at application startup. This option applies to Application Replay and Kernel Replay modes. The supported values are:
|
Value |
Description |
|
|
Collects performance data from application startup. |
|
|
Calling the |
ACU supports the following profiler start/stop API combinations:
-
cudaProfilerStart/Stop
-
hggcProfilerStart/Stop
-
cuProfilerStart/Stop
-
hgProfilerStart/Stop
For example, to start a capture with the profiler start API and stop it with the profiler stop API, run the following command:
acu --profile-from-start off python test_linear.pyAs shown in the following figure, if the collection range in the application is defined with cu(da)ProfilerStart() and cu(da)ProfilerStop(), performance data will be collected for the first range (3 kernels) and the second range (1 kernel):

disable-profiler-start-stop
Use --disable-profiler-start-stop to ignore the profiler start/stop API.
-
The
--disable-profiler-start-stopoption overrides--profile-from-start, collecting performance data from application startup.
2.3 Filter kernel
ACU uses multiple filtering methods to determine whether to collect performance data from kernels in your application.
These kernel-level filtering methods apply only to the Application Replay and Kernel Replay modes.
2.3.1 Kernel name baseline
The --kernel-name-base option defines the base for the kernel name used with the --kernel-name or --kernel-id options. The supported values are function, mangled, and demangled. The default value is function.
-
function: The function name without parameters or templates, for example, foo. -
demangled: The function name restored to a human-readable format, including parameters and templates, for example,foo(float*,int,int). -
mangled: The compiler-generated, mangled name of the kernel function, for example,_S4_S4_9TileShapeS4_S4_iSC.
For example, to collect performance data for all kernels with function names containing foo, run the following command:
acu --kernel-name-base function --kernel-name regex:foo -o cuda_test ./cuda_test 12.3.2 Kernel name
Use --kernel-name to set an expression to match a kernel name. The basis for the match depends on the --kernel-name-base option. For details, see the description of --kernel-name-base. You can specify --kernel-name in the following ways:
-
By kernel name: Specify the exact kernel name.
-
By regular expression: Use the syntax
regex:<expression>to collect kernels matching the regular expression.
When specifying kernel-name with a regular expression, enclose the value in double quotes ("") to prevent the Linux shell from interpreting special characters in the expression. For example: --kernel-name="regex:^.*foo$"
Example: Match all kernels named Bar.
acu --kernel-name Bar ./cuda_test 1
Example: Matches kernels whose names contain the string "Bar", such as Bar and FooBar.
acu --kernel-name "regex:Bar" ./cuda_test 1
Example: Matches kernel names that contain "foo" or "bar", such as foo, foobar, and _bar2.
acu --kernel-name "regex:foo|bar" ./cuda_test 12.3.3 Specify kernel ID
Use the --kernel-id option to specify a kernel ID expression. The system collects performance data only for kernels whose IDs match the specified expression.
kernel-id expression has the syntax context-id:stream-id:[name-operator:]kernel-name:invocation-nr. The fields are separated by a colon (:). If a field is empty, no filter applies to it. The five fields are as follows:
-
context-id: The context ID of the kernel. -
stream-id: The stream ID of the kernel. -
name-operator: An optional descriptor that modifies the next field, kernel-name. (When omitted, the:character is not required).-
The only supported value is
regex, which treats thekernel-nameas a regular expression.
-
-
kernel-name: The expression for the kernel name. The baseline that the kernel name must match depends on the value of--kernel-name-base. For more information, see the description of--kernel-name-base.-
When
name-operatorisregex: Collects data from all kernels whose names match the regular expression. -
When
name-operatoris omitted: Collects data from kernels whose names match exactly.
-
-
invocation-nr: The invocation number for the kernel.-
To specify multiple invocations, you can use a regular expression.
-
The invocation count is incremented only for kernels that match all other specified fields, such as
context-id,stream-id, andkernel-name.
-
When using a regular expression for the kernel-id, enclose the value in double quotes to prevent the Linux shell from interpreting the syntax. For example: --kernel-id="::regex:^.*foo$".
For example, you can match the second call to the Foo kernel without specifying a context or stream id.
acu --kernel-id ::Foo:2 ./cuda_test
Example: Match the 3rd invocation of each kernel and any invocation with a number ending in 5.
acu --kernel-id "::::.*5|3" ./cuda_testExample: Match kernels whose names end with foo.
acu --kernel-id "::regex:^.*foo$" ./cuda_testExample: Matches all kernels that do not start with foo.
acu --kernel-id "::regex:^(?!foo)" ./cuda_testExample: Match the fifth call of any kernel in context 1 and on stream 3.
acu --kernel-id 1:3::5 ./cuda_test2.3.4 Specify the number of kernels
Use --launch-count to specify the maximum number of kernels to profile. This count applies only to kernels that meet the filter conditions for --kernel-name and --kernel-id.
Range Replay also supports this parameter, where it counts the number of ranges.
For example, performance data is collected for only 2 kernels; subsequent kernels are ignored.
acu --launch-count 2 ./cuda_test
2.3.5 Kernel skip count
Use --launch-skip to specify the number of kernels to skip before profiling. This count only includes kernels that match the filter conditions specified by --kernel-name and --kernel-id.
Note: Range Replay also supports this parameter, but in this context, it counts ranges.
Example: Skip the first kernel and collect performance data for all subsequent kernels.
acu --launch-skip 1 ./cuda_test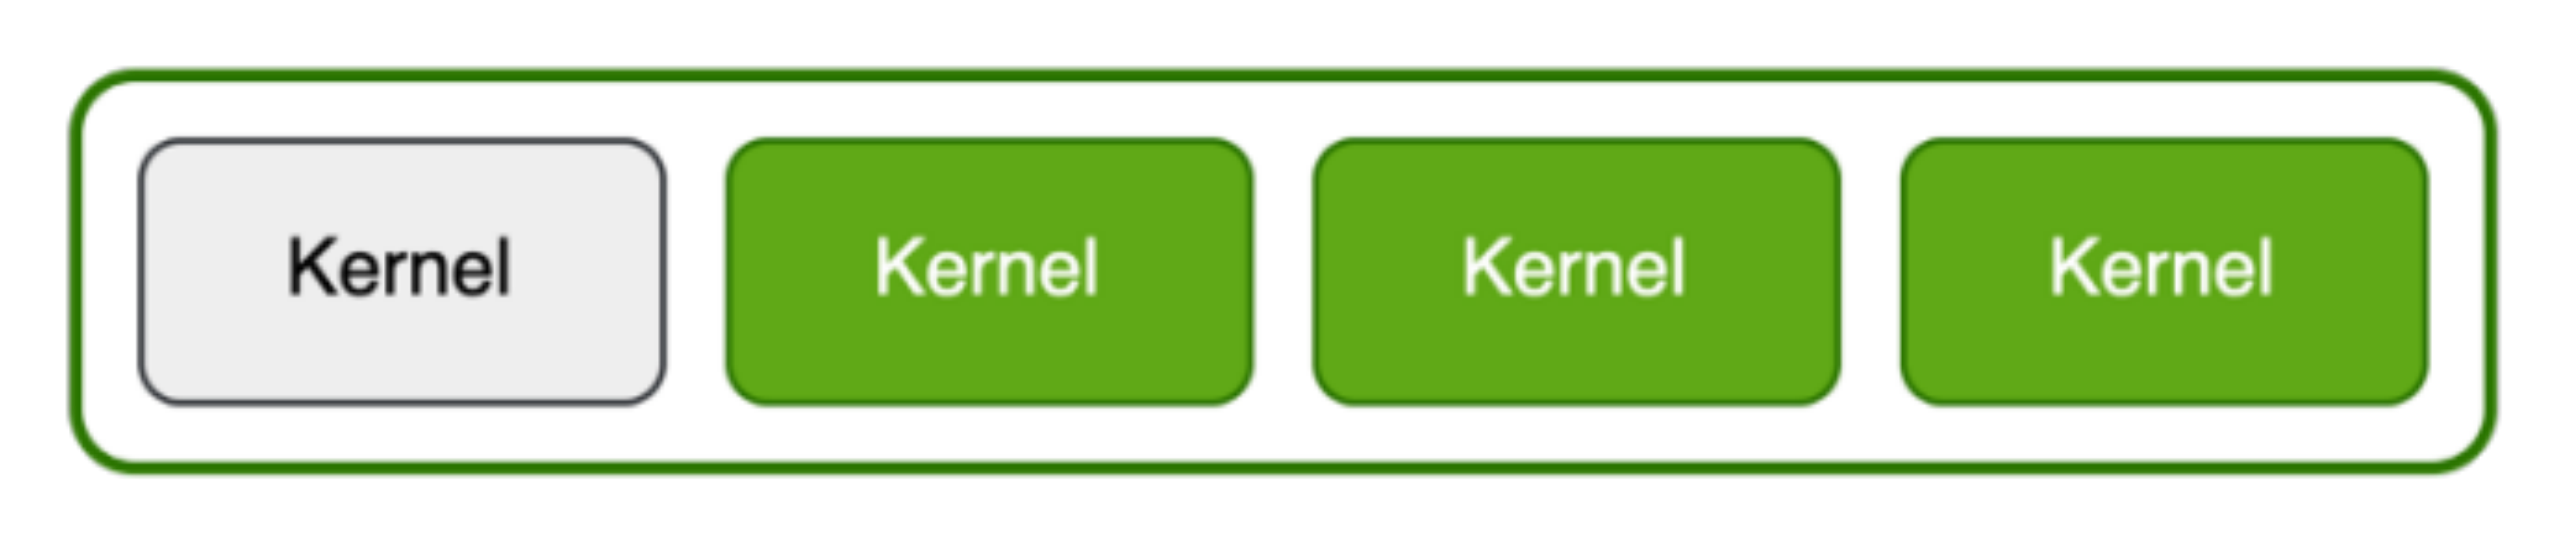
For example, skip the first kernel, collect performance data for the next two, and ignore any remaining kernels.
acu --launch-skip 1 --launch-count 2 ./cuda_test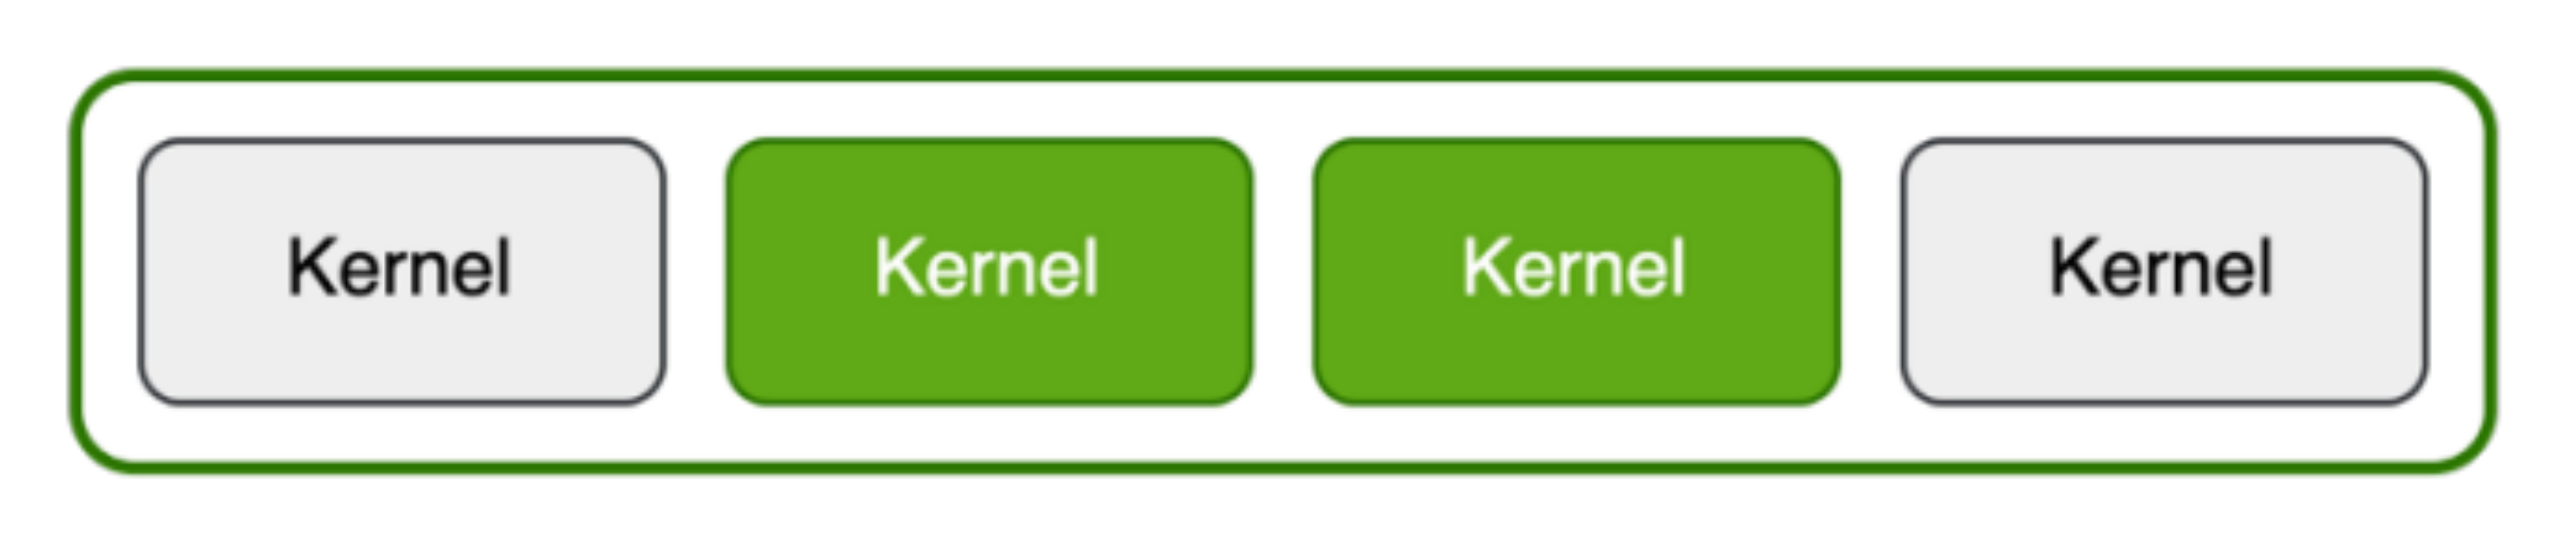
2.3.6 Skip kernels before matching
Use --launch-skip-before-match to specify the number of kernels to skip before profiling begins. This count includes all kernels, regardless of filter conditions.
For example, unconditionally skip 2 kernels, then collect all kernels whose names contain 'Foo'.
acu --launch-skip-before-match 2 --kernel-name regex:Foo ./cuda_test
For example, the profiler skips the first two kernels, regardless of whether their names match the filter. It then skips the first two remaining kernels with names containing 'Foo' and collects performance data from the next two. The profiler ignores all subsequent kernels.
acu --launch-skip-before-match 2 --launch-skip 2 --launch-count 2 --kernel-name regex:Foo ./cuda_test
2.3.7 Exit on collection limit
The --kill option determines if the program exits after the launch-count is reached. By default, the program exits.
Example: Collect performance data for 2 kernels and then exit the program.
acu --launch-count 2 --kill yes ./cuda_test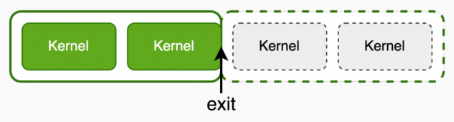
For example, after collecting performance data for two kernels, the program runs to completion without collecting any further data.
acu --launch-count 2 --kill no ./cuda_test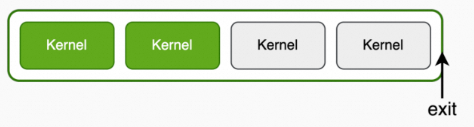
2.4 Specify report name
By default, acu outputs reports only in the .acurep format for analysis in the front-end GUI. Use the -o parameter to specify the report name; acu adds the .acurep suffix automatically. If you omit the -o parameter, acu uses --page=details to print the analysis results to the screen in the details page format.
2.5 Display as page/csv
Besides storing results in a report file, acu can also print them to the screen as different pages. These pages correspond to the pages in the GUI report.
To select a different page, or to print results to the screen while also saving them to a specified file, use the --page=<Page> command. Currently, acu supports the following pages: details, raw.
If you specify -o without --page, you won't see any results in the console.
Use --csv to format the output as CSV.
2.6 Import report file
Use the --import <report file> option to load an existing .acurep file and display its contents.
Use the --page <Page> option to select the page to display.
This table lists the common output parameters:
|
Parameter |
Description |
Output location |
Default |
|
|
Saves the analysis results as a |
File |
Not displayed on the screen by default. |
|
|
Specifies the output page ( |
Screen |
If |
|
|
Formats screen output as CSV. |
Screen |
Can be used with |
|
|
Imports and displays an existing report file. |
Screen |
Can be used with |
|
(No parameters) |
Runs analysis and displays the |
Screen |
Does not generate a file. |
2.7 HGTX filtering
--hgtx-include <configuration> --hgtx-exclude <configuration>
Use these command options to sample kernels that match your configuration and fall within a specific range.
To use the HGTX filtering feature, specify the --hgtx option. You can also specify the --hgtx-include and --hgtx-exclude options multiple times.
There are two types of HGTX range configuration: HgtxRangeStart/End and HgtxRangePush/Pop. The syntax for each is described below.
-
Start-end ranges
Quantifier
Description
Example
,
Delimiter between range names.
Range A,Range B
Range B,Range A,Range C
@
Specifies the domain name. If omitted, the default domain is assumed.
Domain A@Range A
Domain B@Range B,Range Z
acu --hgtx --hgtx-include "Domain A@Range A" hgtx_filtering_testacu samples kernels in the range
Domain A@Range A.acu --hgtx --hgtx-include "Range A,Range B" hgtx_filtering_testacu samples kernels in both
Range AandRange B.acu --hgtx --hgtx-include "Range A" --hgtx-include "Range B" hgtx_filtering_testacu samples kernels in either
Range AorRange B.acu --hgtx --hgtx-exclude "Range A" hgtx_filtering_testacu samples all kernels except those in
Range A.acu --hgtx --hgtx-include "Range B"--hgtx-exclude "Range A" hgtx_filtering_testacu samples kernels in
Range Bbut notRange A. -
Push-pop ranges
Quantifier
Description
Example
/
Delimiter for range names on the stack.
Range A/Range B
Range A/*/Range B
Range A/
[
Indicates the range is at the bottom of the stack.
[Range A
[Range A/+/Range Z
]
Indicates the range is at the top of the stack.
Range Z]
Range C/*/Range Z]
+
Matches exactly one range between two other ranges.
Range B/+/Range D
*
Matches zero or more ranges between two other ranges.
Range B/*/Range Z
@
Specifies the domain name. If omitted, the default domain is assumed.
Domain A@Range A
Domain B@Range A/*/Range Z]
acu --hgtx --hgtx-include "Domain A@Range A/" hgtx_filtering_testacu samples kernels in the range
Domain A@Range A.acu --hgtx --hgtx-include "[Range A" hgtx_filtering_testacu samples kernels in
Range Awhen it is at the bottom of the stack.acu --hgtx --hgtx-include "Range A/*/Range B" hgtx_filtering_testacu samples kernels on a stack where
Range Ais belowRange B, with zero or more ranges in between.acu --hgtx --hgtx-exclude "Range A/*/Range B" hgtx_filtering_testacu samples all kernels except those on a stack where
Range Ais belowRange B, with zero or more ranges in between.acu --hgtx --hgtx-include "Range A/" --hgtx-exclude "Range B]" hgtx_filtering_testacu samples kernels in
Range Abut not whenRange Bis at the top of the stack. -
Other configurations
--hgtx-include DomainA@RangeA,DomainB@RangeB// invalid configurationFor a single
hgtxconfiguration with multiple ranges, you can only specify one domain.--hgtx-include "Range A\[i\]"To use a quantifier (
@,,,[,],/,*, or+) as a literal character in a range name, escape it with a backslash (\). For example,Range A\[i\]refers to a range literally namedRange A[i].--hgtx-include "Range A"// start-end configuration--hgtx-include "Range A/"// push-pop configuration--hgtx-include "Range A]"// push-pop configurationTo include a literal backslash (
\) in a range name, use\\\\. Do not use\\\\to escape a quantifier.To specify that a single range exists anywhere on the stack, append a
/to its name (for example,"Range A/"). Use[and]only to specify a range at the bottom or top of the stack, respectively.--hgtx-include "Range A/*/RangeB"The order in a push-pop configuration is important. In this example,
Range Ais belowRange Bon the stack.
2.8 Run multiple instances with ACU
ACU supports a multi-instance mode to run multiple collection instances in a single terminal session or Docker container. Each instance generates a separate report, and this approach can be used with the mpirun command.
Because acu can only perform collection on one PPU device at a time, when running multiple acu instances, ensure that each instance's target application exclusively uses a PPU device. If acu detects another application using the PPU device during collection, it outputs the following log information:
Applications running on device[0] may affect the profiling metrics.
   Running application list: xxxxxxxxxx
If this error message appears, the acu collection continues, but the collected data might be inaccurate and include kernel data from other running applications.
You can use the mpirun command to collect ACU data in two ways:
-
Use acu to launch mpirun as the target application. The command is formatted as follows:
acu -o your_report mpirun -np 8 <your_target_application>This method launches a single acu instance. Although mpirun may fork multiple application processes, acu collects kernel data from all forked processes and merges it into a single report file.
-
Use mpirun to launch acu as the target application. The command is formatted as follows:
mpirun -np 8 acu -o mpi_repot_%p <your_target_application>This method launches eight acu instances, with each instance profiling a separate <your_target_application> process. This generates eight separate reports, one for each process.
This command combination applies only to the kernel replay and range replay modes. The target application must not contain any PCCL API calls.
In the preceding command, acu has a key parameter:
-o: This parameter uses the %p wildcard, which represents the PID of <your_target_application>. This ensures that each acu instance generates a unique report name and prevents reports from overwriting each other. For more wildcards, see the description of the -o, --export option in the output of acu --help.
2.9 Cache control
|
Value |
Description |
|
none |
The default value. No PPU cache is flushed during profiling. When you collect metrics with a single kernel replay, this mode improves performance and more accurately represents the application's behavior and metric results. However, some metric results depend on prior PPU work and might vary between replays. |
|
all |
Flushes all PPU caches, including the LLC cache, before each kernel replay during profiling. By ensuring a clean cache state, this policy provides stable and reproducible metric results across replays and multiple profiling runs of the target application, even though the values might differ slightly from those during normal execution. |
Kernel Replay may replay a kernel multiple times to collect all required metrics. While Asight Compute checkpoints can save and restore PPU device memory accessed by a kernel, they cannot save or restore L1, L2, or LLC cache data. Consequently, the cache may already be warm from previous kernel executions. Similarly, kernels that ran before the profiled kernel launch can influence the hardware perf counter values collected during the initial replay. These factors can cause subsequent replays to perform better or worse than the initial run.
To ensure stable and accurate collection of hardware perf counter values, Asight Compute provides the --cache-control all parameter to flush the PPU cache before each kernel replay. This ensures the kernel accesses a clean cache for each replay, behaving as if running in complete isolation.
However, this mode has a side effect that can hinder performance analysis, especially when profiling a single kernel in a large application and collecting cache-focused metrics. In this scenario, use --cache-control none to prevent the tool from flushing any hardware caches.
Similarly, in Application Replay, memory accessed by a kernel does not need to be saved and restored using checkpoints, as each kernel launch executes only once during the application's lifecycle. As a result, you can also use the --cache-control none option to prevent the tool from flushing hardware caches. However, if an application requires a clean cache state before a specific kernel launch, you can configure cache control to achieve this.
2.10 Clock control
This feature controls the PPU clock during performance analysis.
The clock frequencies of the PPU compute unit and memory directly affect many metrics, as the following scenario illustrates.
-
If other kernels in the application run before the target kernel, the PPU may already be operating at a higher clock frequency. This can affect the kernel's execution time and related metrics.
-
If a kernel is the first one launched by the application, the PPU clock frequency is typically lower.
-
Because the ACU performs kernel replay, metric values can be affected by the pass that collects them. Later passes often cause the PPU to run at a higher clock frequency.
To reduce this variability, acu limits the PPU clock frequency to its base value (using --clock-control base). This makes metrics less sensitive to the kernel's position in the application and the pass in which it runs.
However, you may not need to lock the clock frequency to its base value if you have already locked it using an external tool such as ppu-msi. To prevent acu from locking any clock frequencies, use the --clock-control none option.
|
Clock-control value |
Description |
|
base |
Locks the CU and memory clocks to their respective base frequencies during performance analysis. The current CU base clock is 900 MHz. |
|
none |
Default value. During performance analysis, |
|
reset |
Resets the CU and memory clock for all or selected devices (specified with |
-
Thermal throttling can change the PPU clock frequency. acu cannot control this behavior.
-
clock-controlrequires sudo permissions; otherwise, the performance analysis aborts and a permission warning is displayed. -
When you use the
--clock-control baseoption, acu resets the PPU clock frequencies after the application exits. It does not restore the clock frequencies that were set before the analysis, such as those set by ppu-smi.
3. Warp Sampling
Warp Sampling periodically samples the state of the warp scheduler. At a fixed sampling interval, each sampler selects an active warp and outputs the instruction's PC address and the corresponding warp scheduling state.
Warp Sampling is enabled by default in acu. You can view the sampling data by opening the report in the GUI tool.
3.1 GUI display
The Details Page and the Source Page display Warp Sampling data.
3.1.1 Details Page
On the Details Page, in the Source Counters section, the Warp Stall Sampling table displays the top five stall reasons, sorted by count. The All Samples table includes data for both issued and Not Issued states, while the Not Issued table shows only Not Issued data. The table includes the following columns:
-
Source location
-
Stall reason count
-
Stall reason percentage

For a detailed list of stall reasons, see Warp Stall Reasons.
3.1.2 Source Page
The Source Page presents stall reason data in a bar chart. Both the Source View and PASM View display the count of each stall reason and their sum for each line of code or instruction.
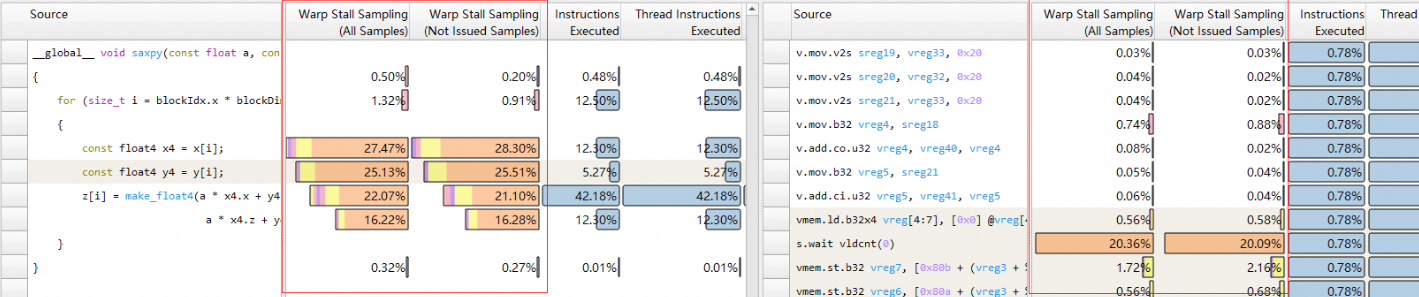
3.2 Specify the sampling interval
If sampling provides insufficient data for analysis, set a shorter sampling interval using the --warp-sampling-interval option.
The minimum sampling interval is 128 cycles (2^7), and the maximum is 65,536 cycles (2^16). The tool ignores intervals outside this range.
-
The
--warp-sampling-intervaloption accepts an integer from 0 to 9. The actual sampling interval is calculated as 2^(7 +value) cycles. -
If set to
auto(the default), the tool automatically selects the highest sampling frequency that the environment can support. This helps prevent insufficient data collection and avoid buffer overflow.
Example: Set the sampling interval to 256 cycles for Warp Sampling.
acu --warp-sampling-interval 1 -o cuda_test ./cuda_testExample: Automatically select the highest sampling frequency for Warp Sampling.
acu --warp-sampling-interval auto -o cuda_test ./cuda_testInstruction statistics (Beta)
The instruction statistics feature collects execution information for kernel and device functions. This feature is enabled by default. To disable instruction statistics, set the following environment variable before you launch acu: export ASIGHT_FEATURE_INSTRUCTION_COUNT=0.
Instruction statistics supports profiling kernels or ranges in all replay modes, except for graphs (--graph-profiling graph).
|
Workload type |
Instruction level source |
|
Kernel |
✅ |
|
Range |
✅ |
|
Graph |
❌ |
acu adds a dedicated pass to collect execution information and parses assembly instructions. During collection, the instruction statistics feature counts warp and thread executions for each instruction. The GUI tool displays the collected instruction statistics in various formats.
Source page
Open a report containing instruction statistics in the GUI and navigate to the Source Page. The Source View and PASM View display the Instructions Executed and Thread Instructions Executed columns.
-
Instructions Executed: Counts the number of times an instruction is executed by a warp, regardless of the number of active threads in that warp.
-
Thread Instructions Executed: Counts the number of times an instruction is executed across all threads.
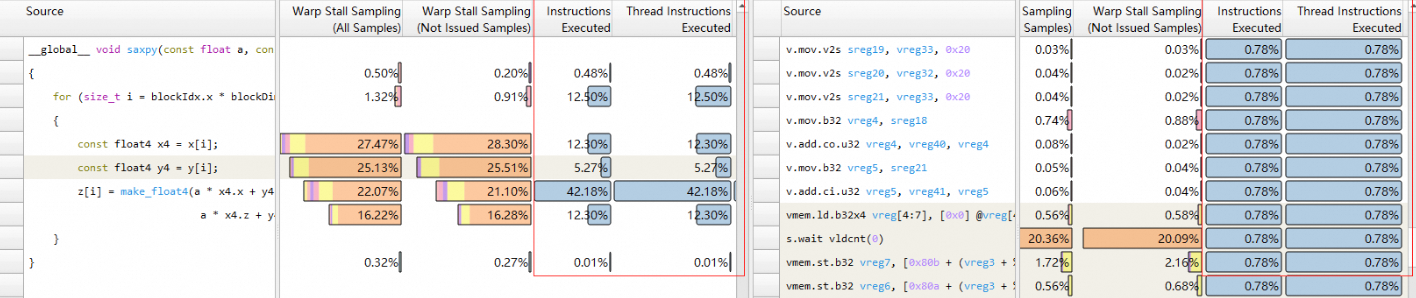
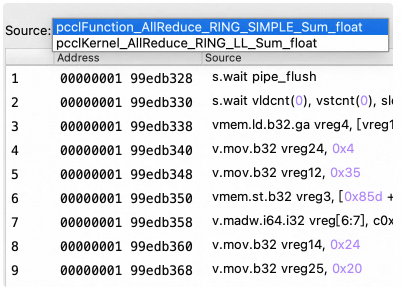
When instruction statistics is enabled, the GUI also displays assembly instruction details and source correlation for device functions called by a kernel function. For more details, see Source Page.
Details page
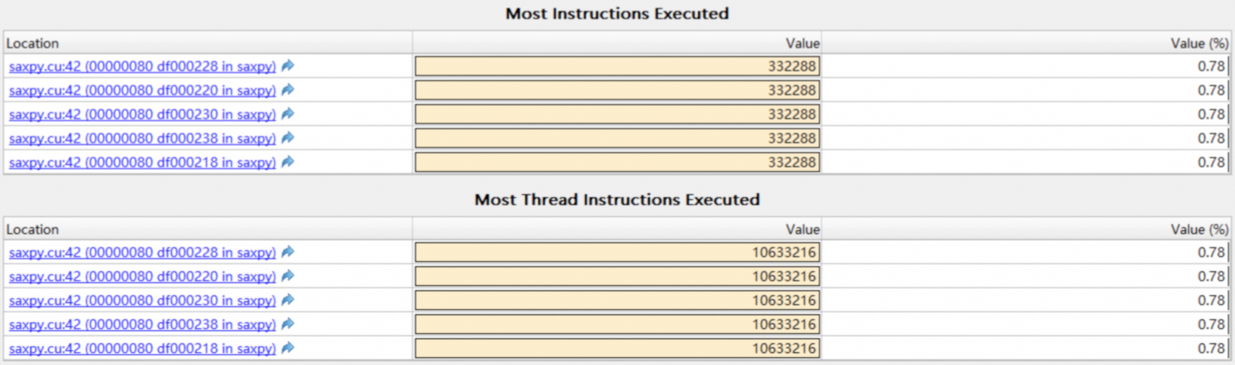
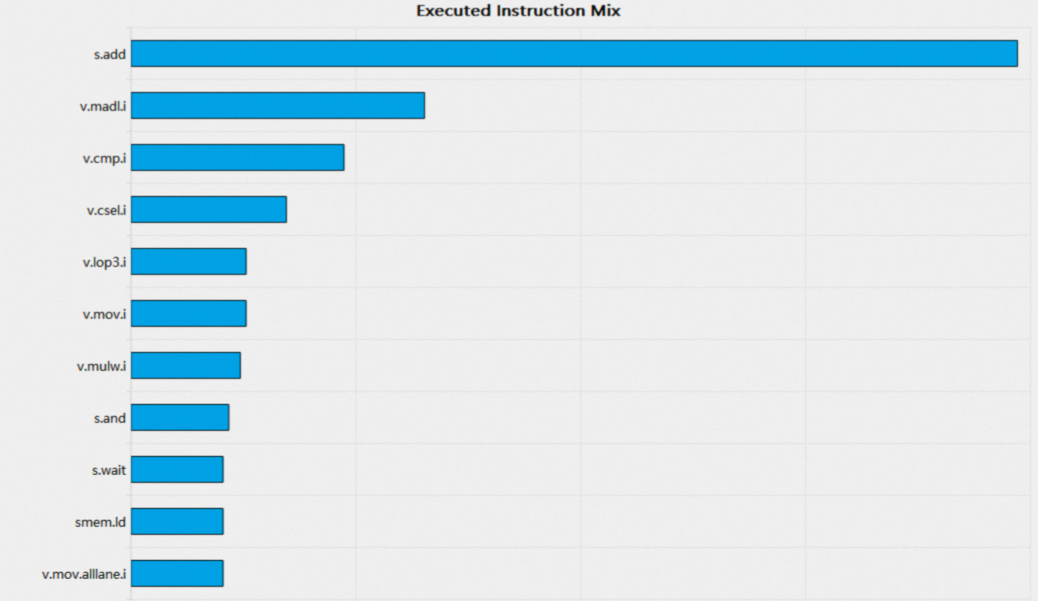
On the Details Page, the Instruction Statistics Section includes a new bar chart showing the distribution of instruction execution. For more details, see Executed Instruction Mix Bar Chart:
On the Details Page, the Source Counters Section lists statistics for Most Instruction Executed and Most Thread Instructions Executed. For more details, see Source Counters Section: