Customer voice report/Experience Insights Agent
The Customer Voice Report module compiles and syncs user feedback reports to the portals of roles like e-commerce, operations, and service managers. This provides a direct, systematic way to understand customer sentiment and gain clear insights into consumer perception at every touchpoint.
Page features and operations
Time filter (daily report, weekly report, monthly report)
To view a data report for a specific day, week, or month, select the report type and choose a date on the right.
Note: You can only view data from the previous day and earlier.
Report content display area
This area displays the data report for the selected time period.
Daily report
The daily report is divided into two main sections: abnormal dynamics and stores with abnormal voice.
The abnormal dynamics section displays statistics for tags with unusual activity, including the tag name, volume trend, total daily volume, and day-over-day (DoD) change. The critical public opinion metric identifies the negative tag with the highest risk and largest volume.
- Metric descriptions -
abnormal dynamics: A scenario is abnormal if it meets the criteria for a high-risk or high-growth scenario.
High-risk scenario: The top three level-3 tags that have a 'high' risk level and are ranked by volume within the selected time period.
High-growth scenario: The top ten level-3 tags with the largest volume increase within the selected time period.
abnormal volume: The voice volume from scenarios identified as abnormal.
total store volume: The total voice volume for the store.
abnormal voice percentage: The abnormal volume divided by the total store volume.
abnormal voice contribution rate: The abnormal volume for a single store divided by the total abnormal volume across all stores.
Hover over a volume trend thumbnail to see the volume trend for that tag over a recent period.
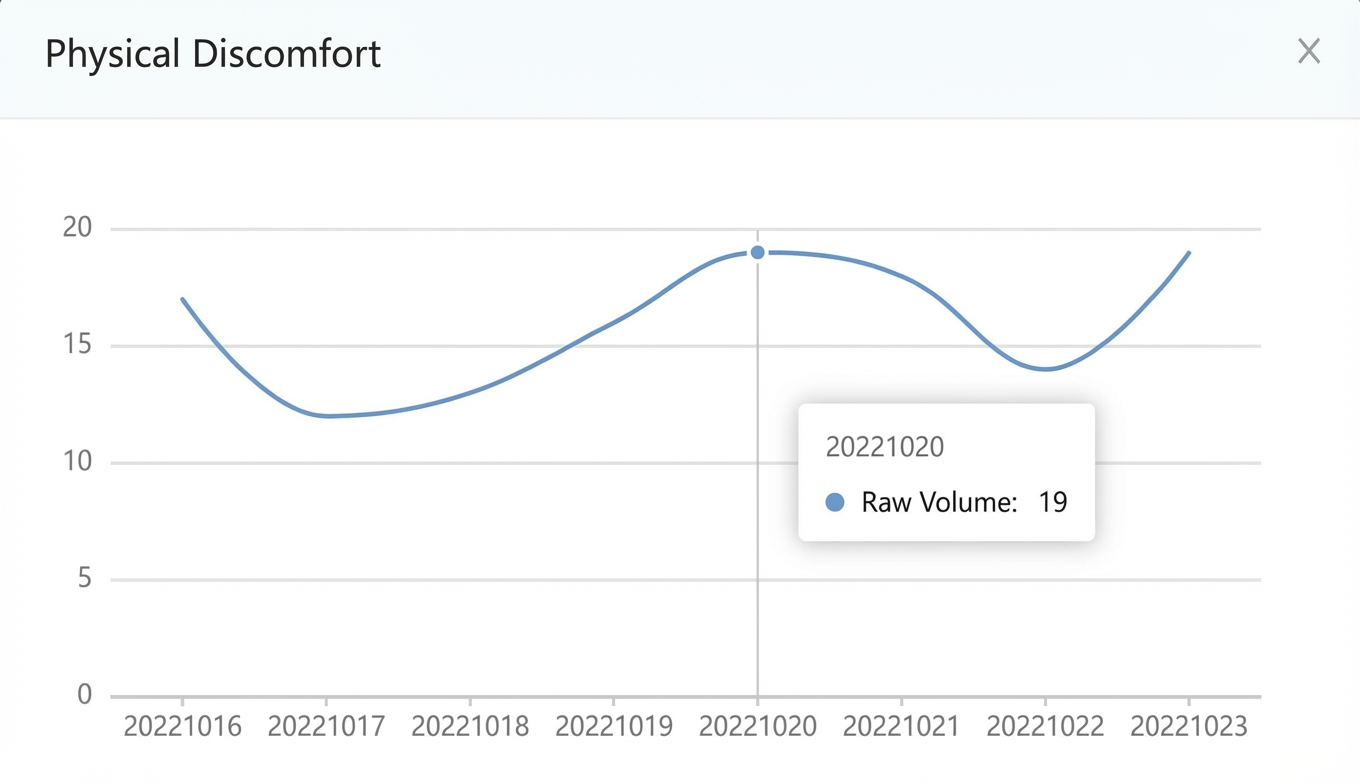
Click a tag to view a list of featured feedback containing that tag on the right.
The stores with abnormal voice section displays data for stores that have an abnormal volume.

Weekly report
The weekly report consists of two main sections: voice volume metrics and store details.
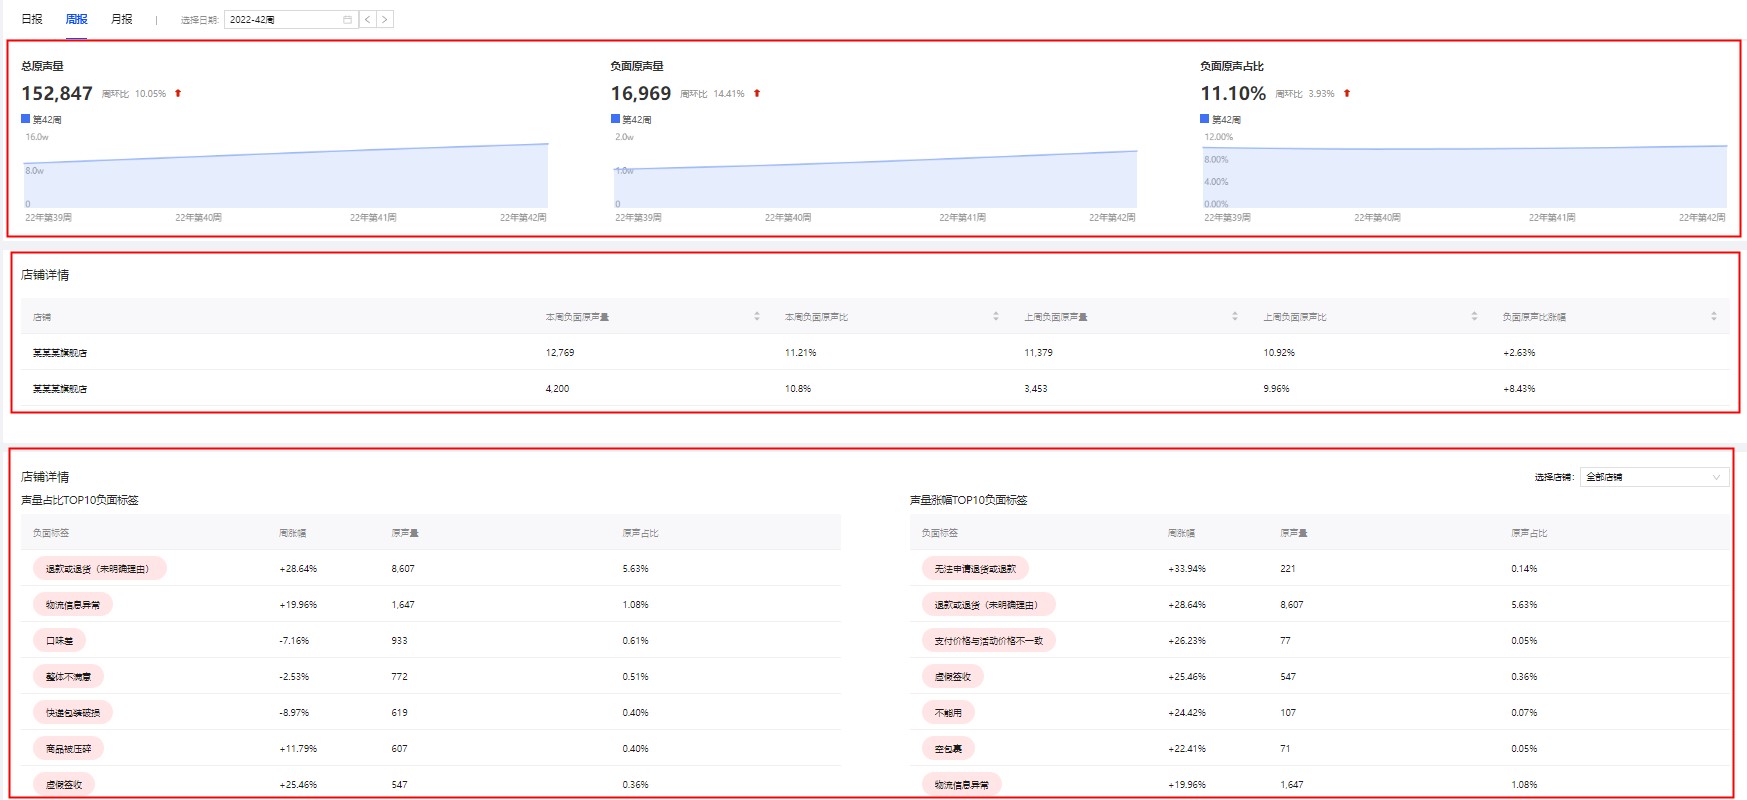
Total voice volume
Displays the total voice volume for the selected week, the week-over-week (WoW) percentage change, and the volume trend over the last four weeks.
Negative voice volume
Displays the total negative voice volume for the selected week, the week-over-week (WoW) percentage change, and the negative volume trend over the last four weeks.
This week's negative voice volume
This is the voice volume that matches negative tags within the selected time period.
Negative voice percentage
Displays the percentage of negative voice volume to total voice volume for the selected week, the week-over-week (WoW) change in this percentage, and the trend of this percentage over the last four weeks.
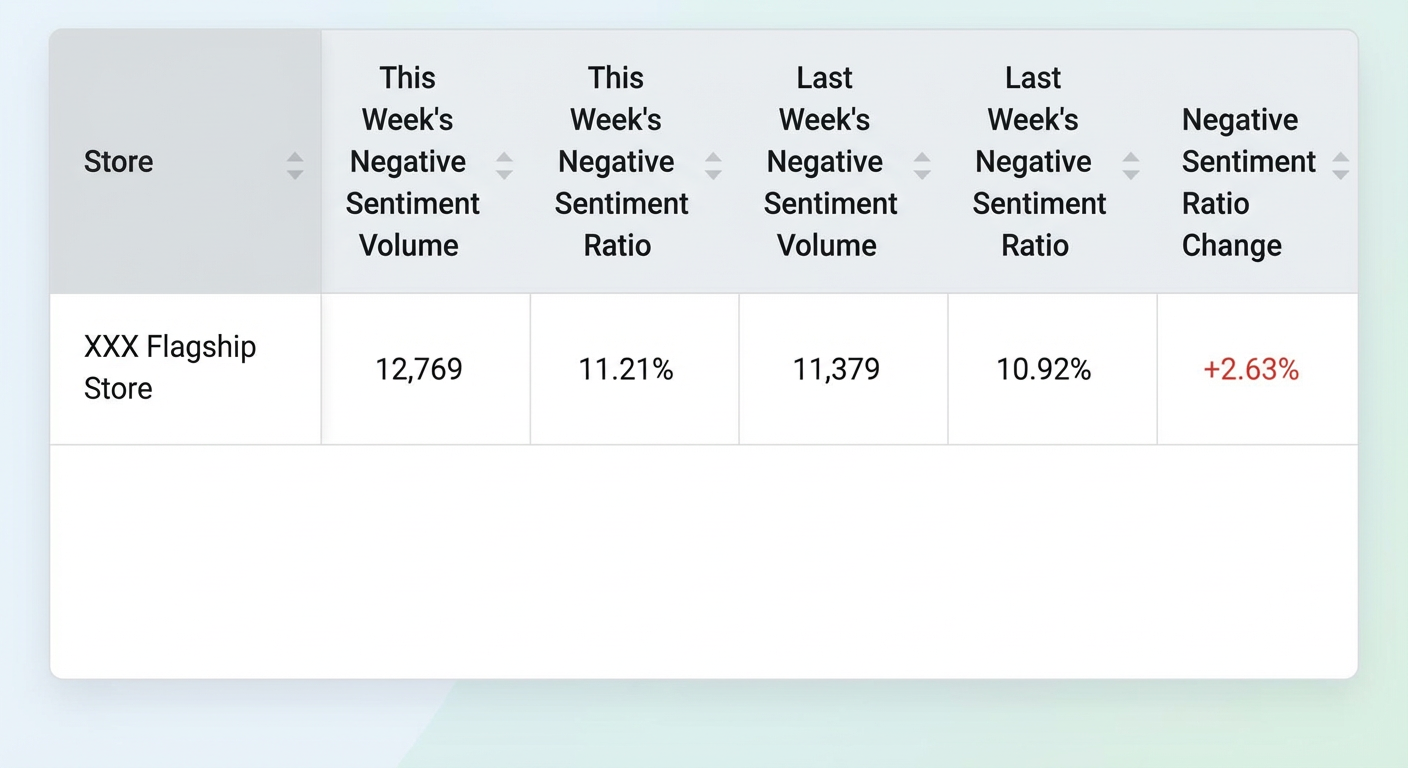
Store list
Displays performance data for all stores you have access to during the selected week. Metrics include this week's negative voice volume, this week's negative voice percentage, last week's negative voice volume, last week's negative voice percentage, and the change in negative voice percentage.
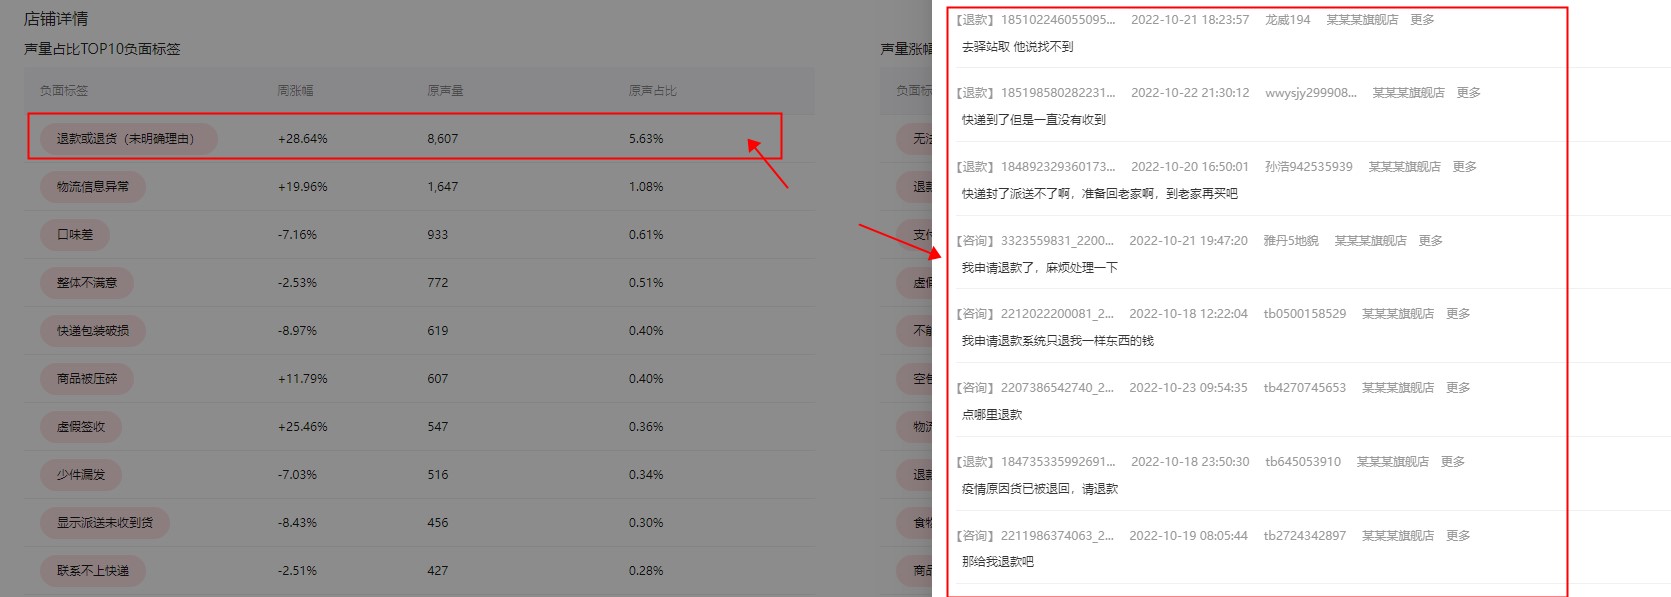
Reasons for negative feedback
Displays data for the ten tags with the highest negative voice volume and the ten tags with the largest increase in negative voice volume.
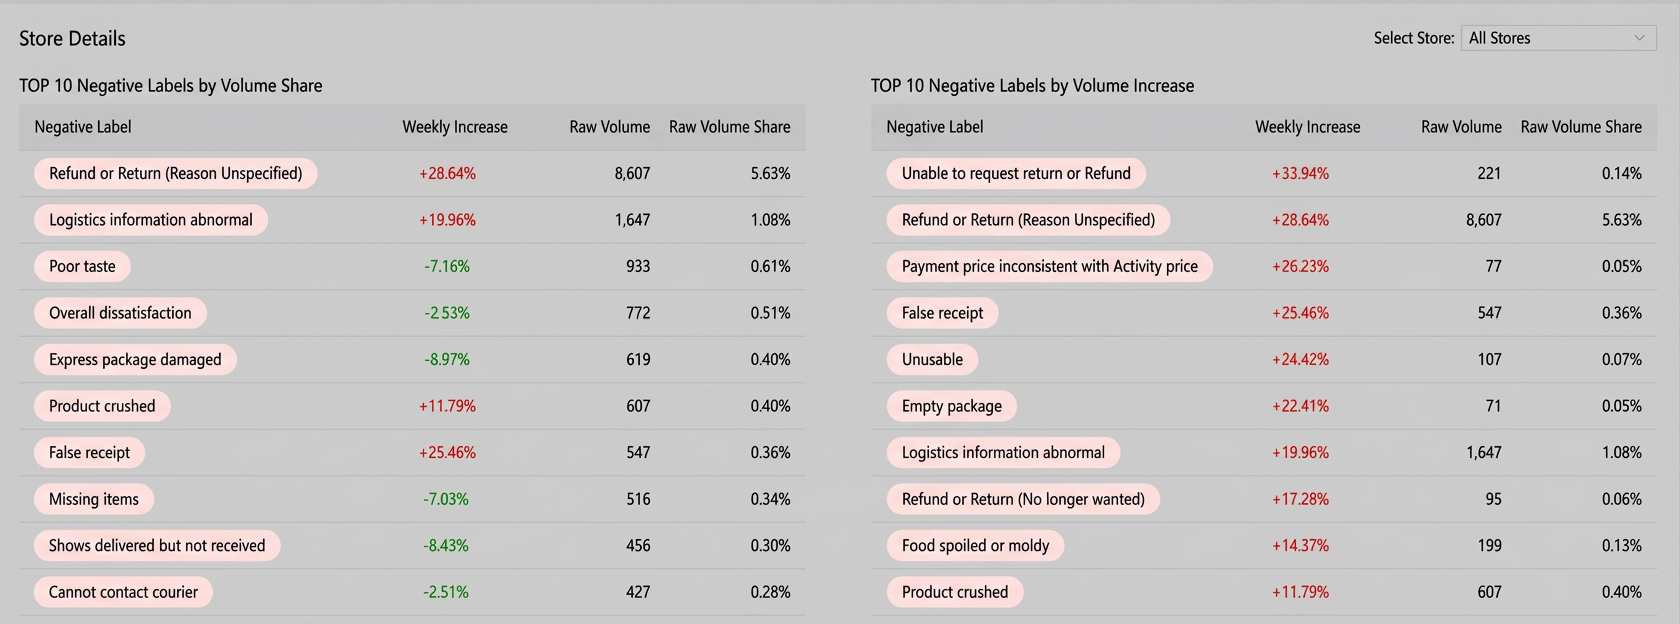
Click 'Select Store' in the upper-right corner to view this data for a different store.
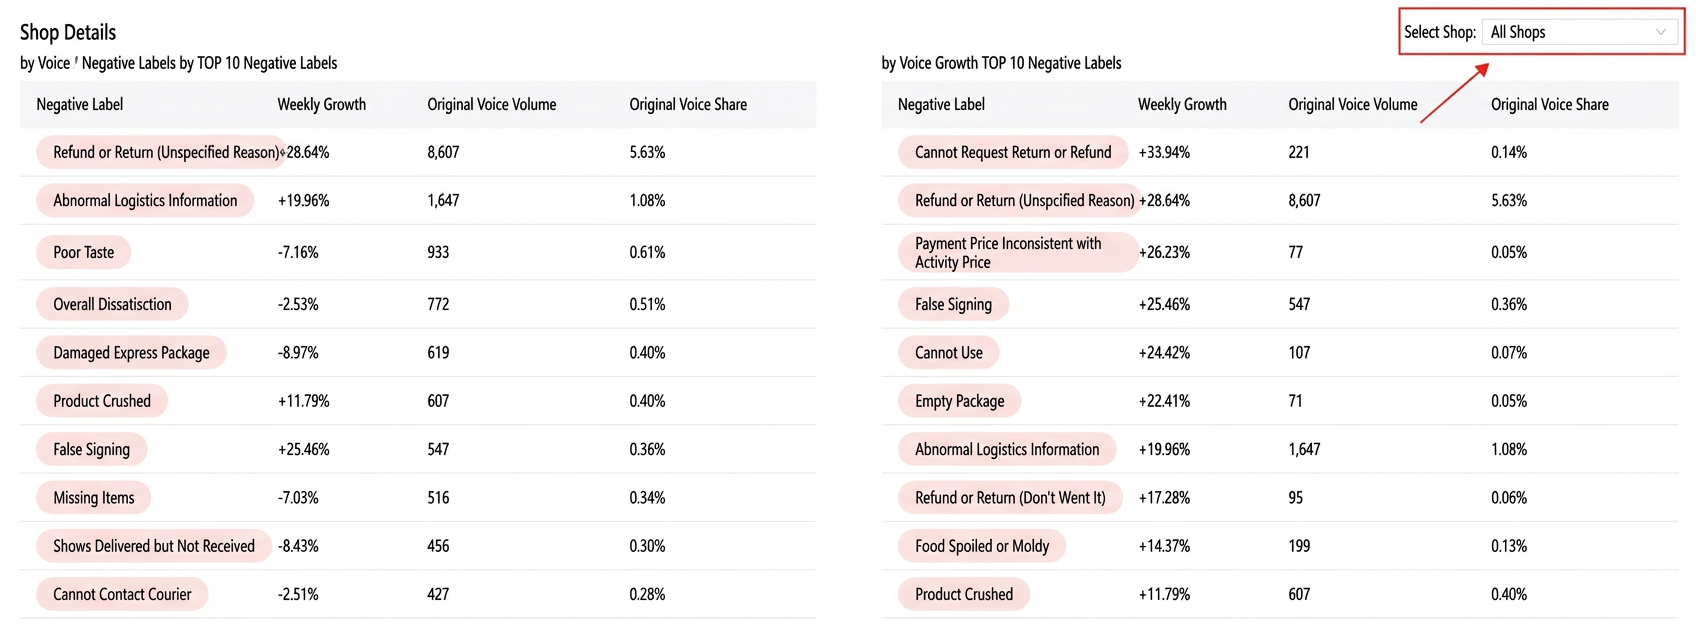
Click a tag on the left to display a list of featured feedback for that tag on the right.
Monthly report
The monthly report has the same content and functionality as the weekly report, but its data is aggregated for the selected month.
This month's negative voice volume: This is the voice volume that matches negative tags within the selected time period.