This topic explains how to view and analyze push receipt logs.
Workflow
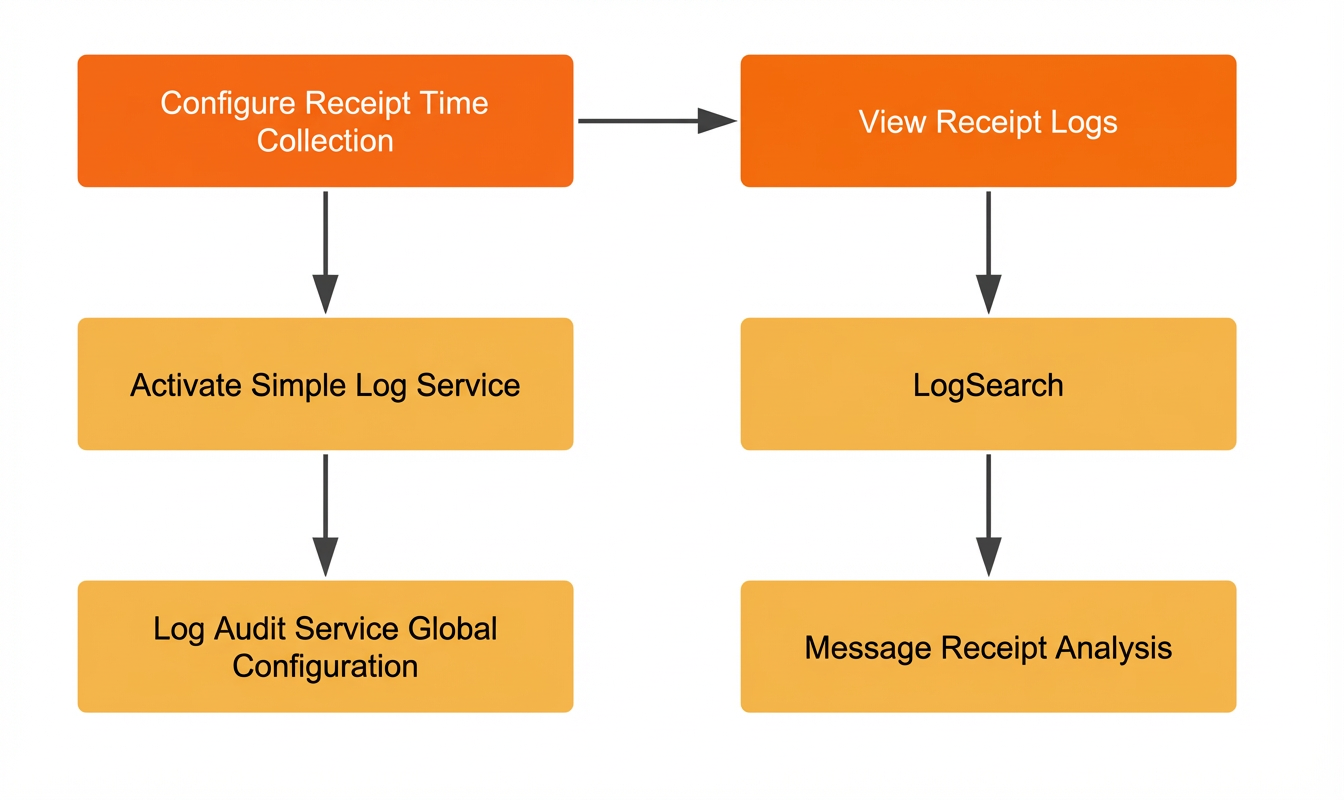
Configure push receipt event collection
Activate Log Service
Log on to the Log Service console and activate Log Service.
NoteThe receipt log feature delivers data to Log Service through flow logs. This process incurs fees for both flow log generation and Log Service usage. For more information, see Flow Log Billing and Billable Items for Pay-As-You-Go.
Log on to the EMAS console and select the Mobile Push product.
On the Mobile Push product page, in the left-side navigation pane, go to Data Statistics > Receipt Log to open the receipt log page.
Click Configure Log Audit Service to go to the Global Settings page of Log Audit Service.
On the Global Settings page, configure the following parameters:
In the Region of central project section, select the destination region for centralized log storage.
Configure authorization for data collection and synchronization.
Select Authorize with AccessKey, enter your AccessKey information, and then click Authorize. Your AccessKey is used only for temporary authorization and is not stored.
After successful authorization, the message The current account is authorized to collect and sync logs for Log Service appears.
In the list of cloud products, find the Mobile Push row, turn on the Push Receipt Event switch, and configure the retention period.
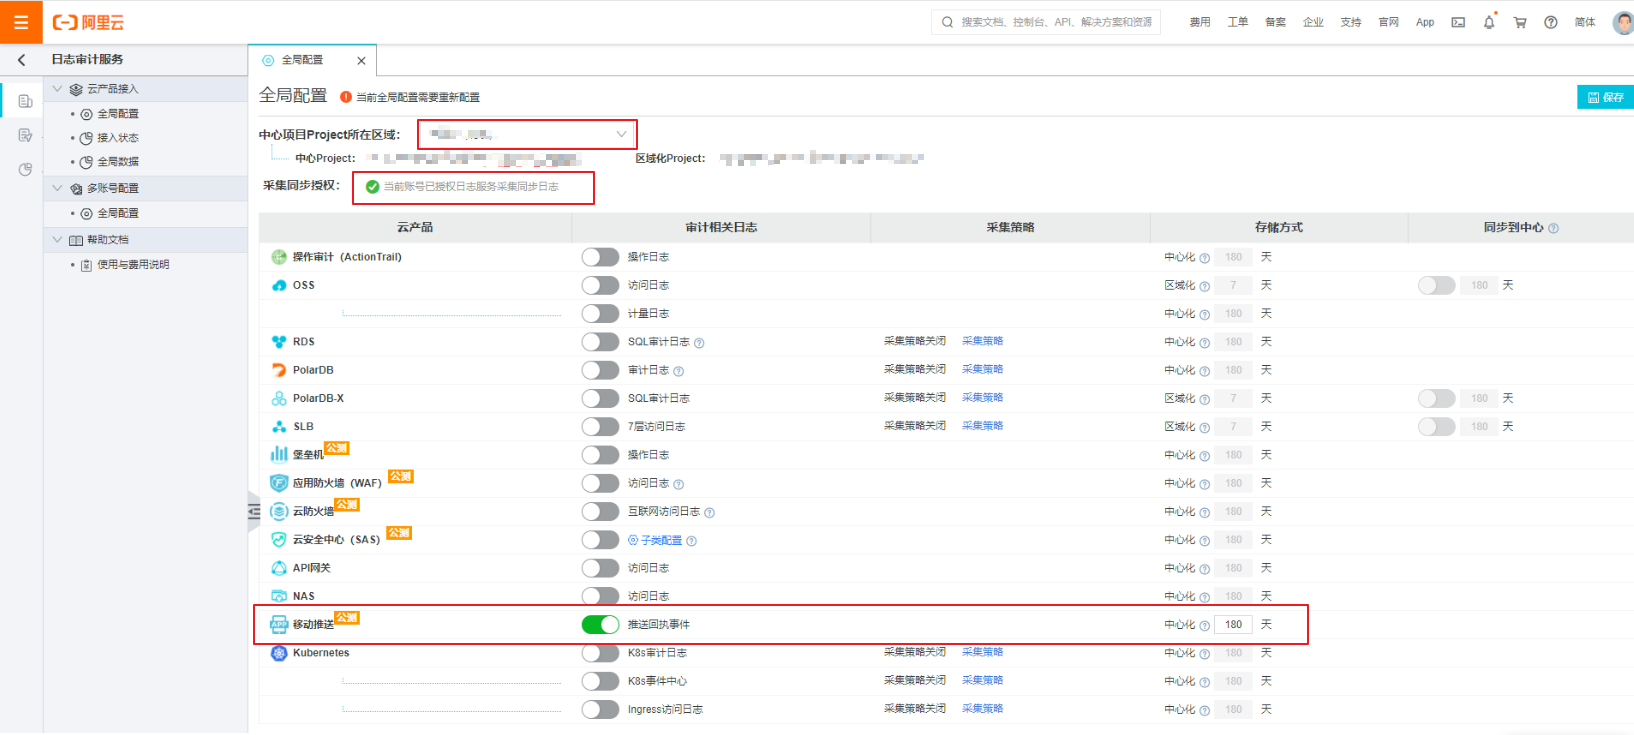
Click Save.
Wait 1 minute for the configuration to take effect. Then, return to the Receipt Log page and refresh it. For more information about configuring Log Audit Service, see Log Audit Service Overview.
Query receipt logs
If you are using an Alibaba Cloud sub-account (RAM user) to access the receipt log feature, ensure the RAM user has one of the following system permission policies:
AliyunLogFullAccess: Grants full management permissions for Log Service. This policy is suitable for users who need to configure and view logs.
AliyunLogReadOnlyAccess: Grants read-only permissions for Log Service. This policy is suitable for users who only need to view receipt logs.
Without these permissions, the RAM user cannot view the main receipt log interface and receives a "permission denied" error.
For information about how to grant permissions to a RAM user, see RAM Authorization.
Return to the main Receipt Log page.
Click Query to go to the Log Search page.
Select a time range to filter the receipt logs.

In the search box, enter a query and analysis statement and click Query/Analysis to view the results. For sample queries, see the Sample log query statements section in this topic.
The following table describes the fields in a receipt log.
Field
Description
__time__The event time. Example:
2018-02-27 11:58:15.__topic__The topic, which is fixed to
cps_callback_event.app_keyThe AppKey of your application.
message_idThe message ID. Example:
868947123456789.event_timeThe time of the push receipt event. Example:
2020-03-02 11:04:51.event_typeThe type of the push receipt event. Valid values:
sent: The message was sent through the proprietary channel or a third-party channel.sent_fail: The message failed to send. This event logs synchronous error information returned by the channel.arrive: The message was successfully delivered.arrive_fail: The message failed to be delivered. This event logs asynchronous error information returned as a receipt by a third-party channel. If the third-party channel does not support receipts, noarrive_faillog is generated.ext_ack: A receipt for an iOS extended notification. To enable this feature, see iOS Extension SDK Integration.click: The notification was clicked. This event depends on reports from the device and the third-party channel.clean: The notification was cleared. This event depends on reports from the device and the third-party channel.
NoteCurrently, offline delivery through the proprietary channel does not generate a
sentlog.The
arrive,click, andcleanevents depend on reports from the device or third-party channel. Some channels, such as APNs, do not support this reporting mechanism.iOS notifications are delivered to Apple's APNs servers. Because APNs does not return
arrivereceipts, noarrivereceipt information is generated when you use the APNs third-party channel.For iOS
cleanevents, ensure that you have configured them correctly. For more information, see Configure reporting for iOS notification deletion.
device_idThe device ID. Example:
96d7c9db01ccxxxxxxxxxxxxxxxxxxxx.device_typeThe device type. Example:
ANDROID,iOS, orHarmonyOS.last_active_timeThe last active time of the device. Example:
2025-01-31 11:58:02.app_versionThe application version. Example:
5.20.client_ipThe client IP address.
brandThe device brand. Example: vivo.
network_typeThe device network type. Example:
WIFI.osThe device operating system. Example: Android.
os_versionThe device operating system version or API level. Example:
34.ispThe device's carrier. Example: China Unicom.
job_keyThe custom identifier for the push task. This field is included in the receipt log if the
JobKeyparameter was not empty in the push request. Example:123.event_channelThe sending channel. Possible values include
accs,huawei,honor,xiaomi,oppo,vivo,meizu,gcm,fcm, andapns. More channel types may be added in the future.vendor_message_idThe message ID from the third-party channel.
reasonThe reason for a send or delivery failure. The format is typically
code#msg, wherecodeis the error code from the third-party channel andmsgis an error description or an HTTP status code. For more details, look up thecodein the third-party channel's documentation.owner_idThe UID of the primary Alibaba Cloud account.
Message receipt analysis
Return to the main Receipt Log page.
Click Analyze to go to the Android message receipt analysis/iOS message receipt analysis page.
Enter an app_key to filter the analysis results.
The following information is displayed in the receipt analysis:
Parameter
Description
Source IP distribution
Displays the IP address distribution of all receipts within the selected time range.
Total count
Displays the total number of all receipts within the selected time range.
Delivered count
The total number of messages delivered to devices.
Android: The total number of messages received by all devices. Both proprietary and third-party channels for Android provide delivery receipts. The delivered count is the sum of all
arrivereceipts.iOS: iOS notifications are delivered to Apple's APNs servers. A message is considered delivered as long as the APNs server does not return an error.
HarmonyOS: The total number of messages received by all devices. Both proprietary and third-party channels for HarmonyOS provide delivery receipts. The delivered count is the sum of all
arrivereceipts.Click count
The number of times users clicked notifications or messages delivered to devices. This is calculated by counting all receipts where
event_typeisclick.Receipt trend
The trend for the count of each receipt type.
Brand distribution
The brand distribution of devices that successfully received pushes.
Carrier distribution
The carrier distribution of devices that successfully received pushes.
OS distribution
The operating system distribution of devices that successfully received pushes.
OS version distribution
The operating system version distribution of devices that successfully received pushes.
Sample log query statements
A query and analysis statement consists of a query statement and an analysis statement, separated by a pipe character (|): Query Statement | Analysis Statement. For details, see Query and Analysis Quick Start.
iOS examples
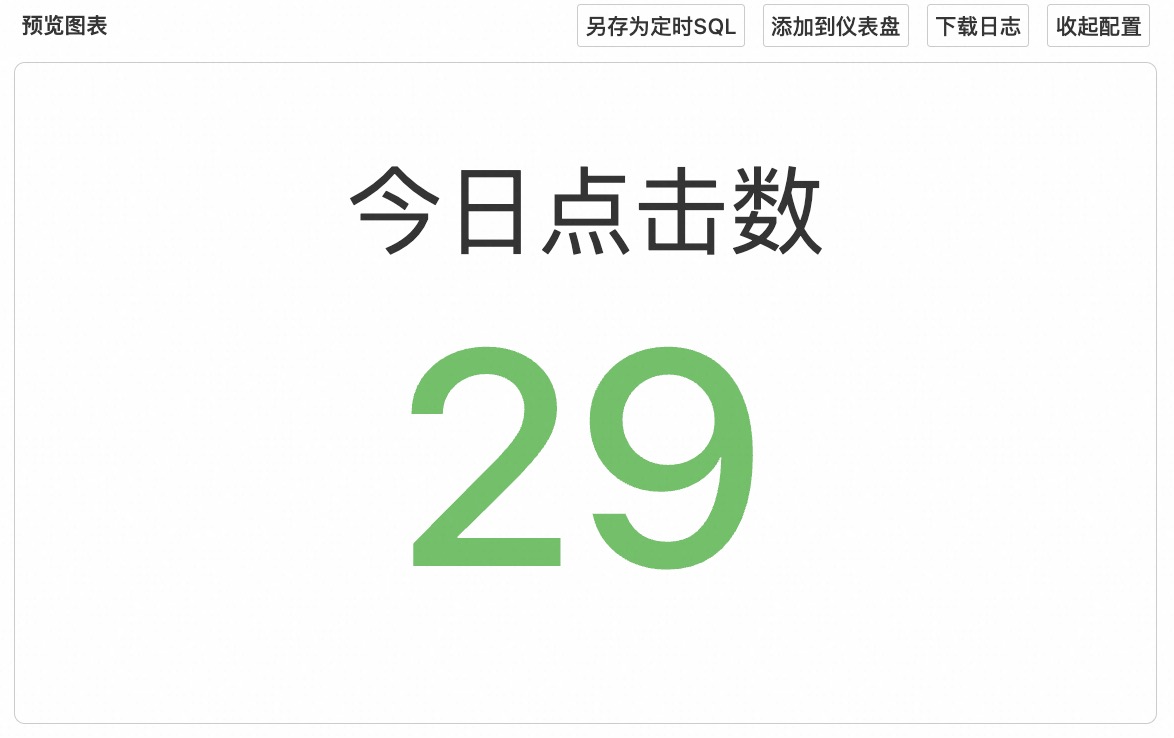
Today's iOS clicks
Set the time range to Today, enter the following query, and click Query/Analysis.
device_type:iOS and event_type:click|
SELECT COUNT(1) AS "Today's Clicks" FROM log
Navigate to Chart > General Configuration, and for Chart Type, select Number Chart Pro ![]() . The result is as follows:
. The result is as follows:
Click Add to Dashboard to add the chart to your dashboard.
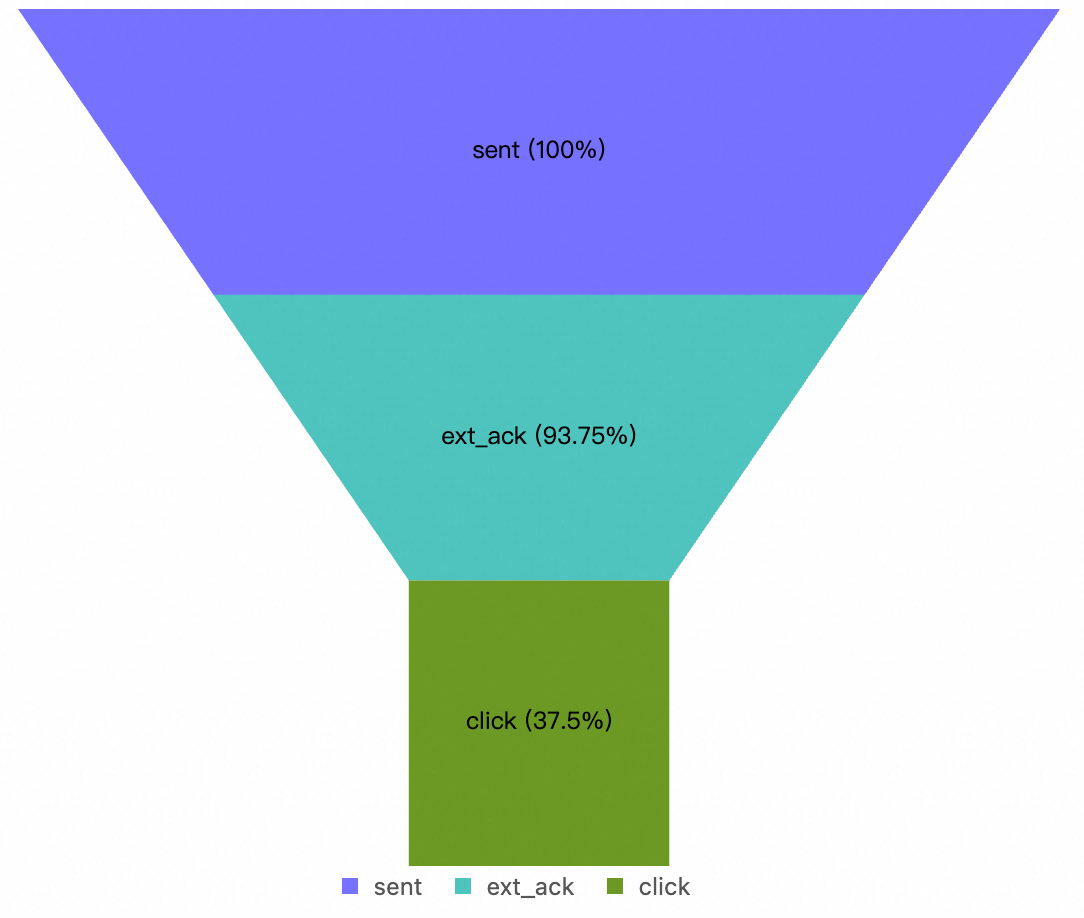
iOS app churn rate per push stage
device_type:iOS and (event_type:sent or event_type:ext_ack or event_type:click) |
SELECT
  event_type,
  COUNT(1) AS cnt
FROM  log
GROUP BY
  event_type
ORDER BY   cnt DESC
Navigate to Chart > General Configuration, and for Chart Type, select Funnel Chart Pro . Then, navigate to Standard Configuration and set Unit to Custom. The result is as follows:
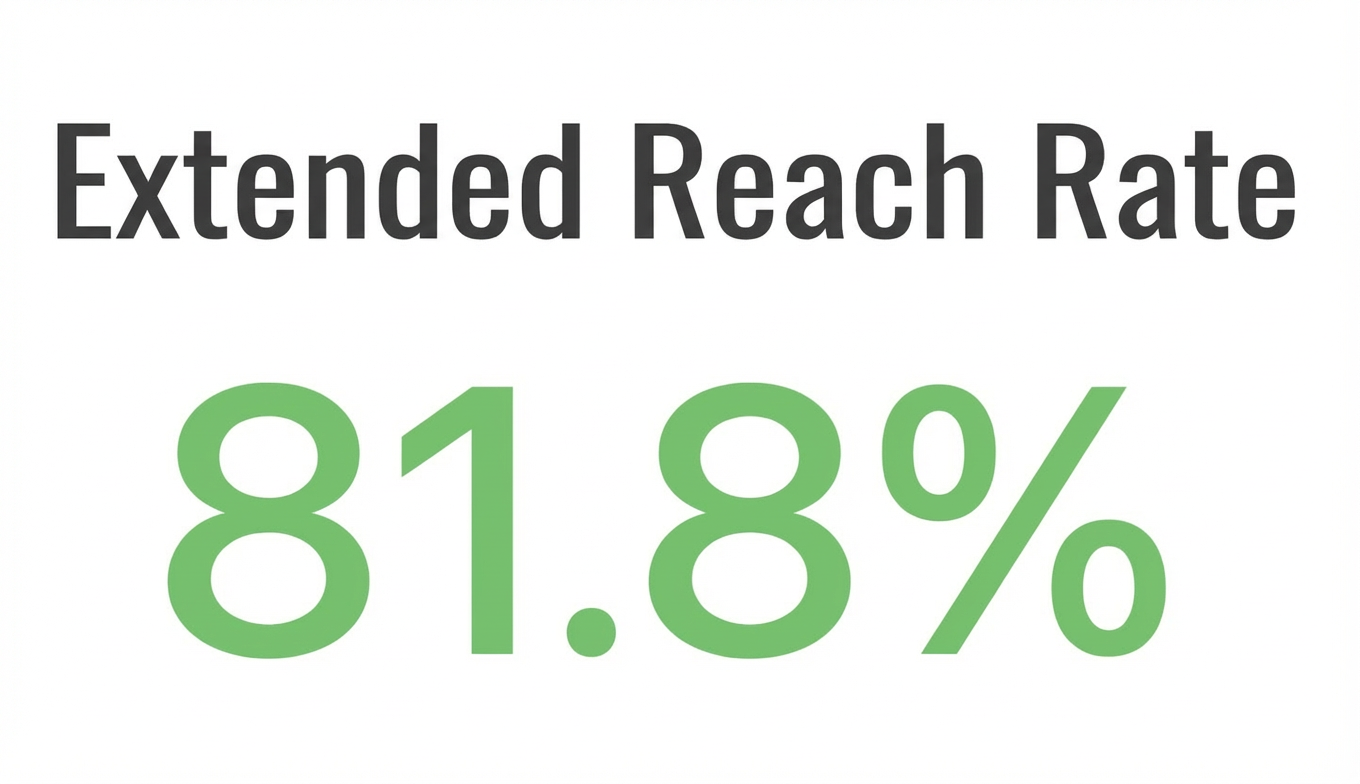
iOS extended delivery rate (Extended Receipts / Sent Count)
device_type:iOS|
SELECT
  SUM(
    CASE
      WHEN event_type = 'ext_ack' THEN 1
      ELSE 0
    END
  ) * 1.0
  /
  SUM(
    CASE
      WHEN event_type = 'sent' THEN 1
      ELSE 0
    END
  ) AS "Extended Delivery Rate"
Navigate to Chart > General Configuration, and for Chart Type, select Number Chart Pro ![]() . Then, navigate to Standard Configuration and set Format to percent(0-1). The result is as follows:
. Then, navigate to Standard Configuration and set Format to percent(0-1). The result is as follows:
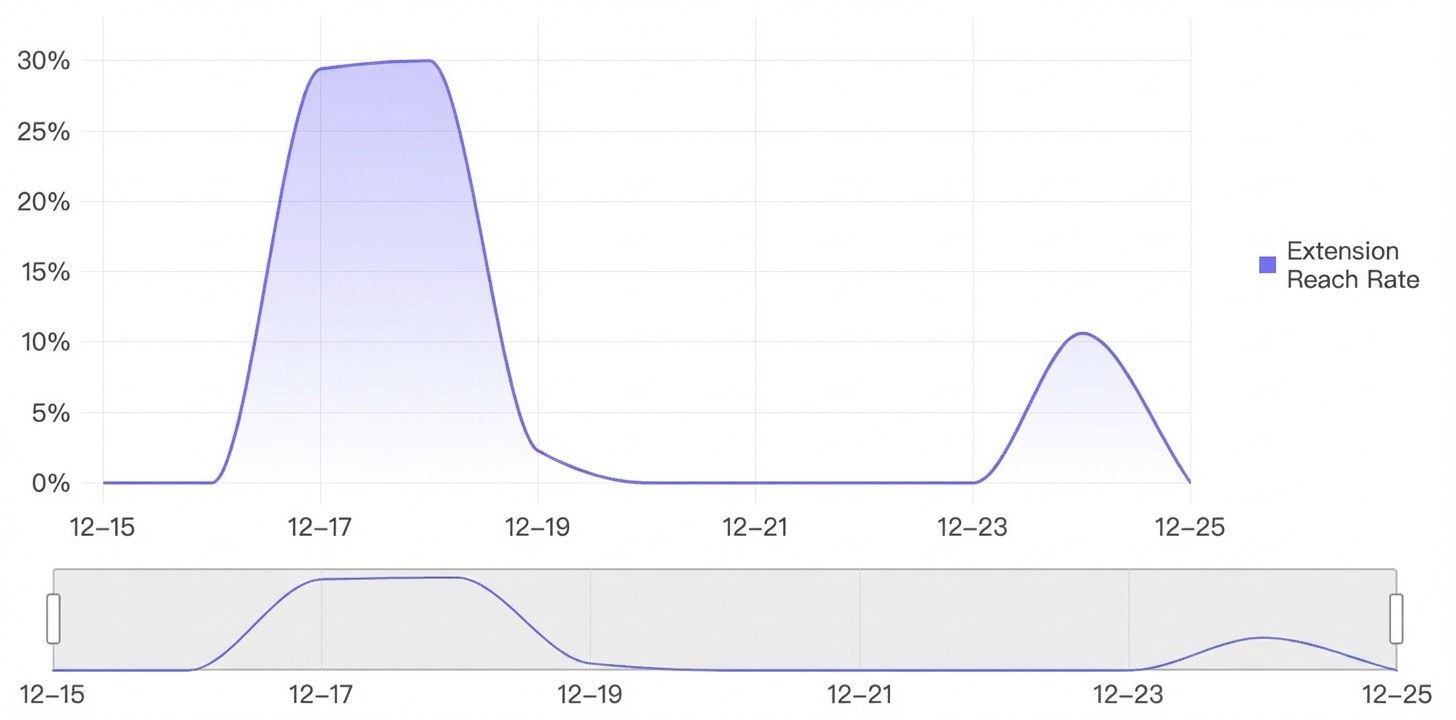
Daily trend of iOS extended delivery rate
device_type:iOS|
SELECT
  date_trunc('day', __time__) AS ts_day,
  SUM(CASE WHEN event_type = 'ext_ack' THEN 1 ELSE 0 END) * 1.0 /
  NULLIF(SUM(CASE WHEN event_type = 'sent'   THEN 1 ELSE 0 END), 1) AS "Extended Delivery Rate"
GROUP BY
  ts_day
ORDER BY
  ts_day
Navigate to Chart > General Configuration and for Chart Type, select Line Chart Pro![]() .
.
Then, click General Configuration > Data Configuration and turn on the Data Completion switch. By default, the completion window is set to auto and the completion value is 0.
Next, enable Time Series Mode on the chart. Navigate to Standard Configuration and for Format, select percent(0-1). The result is as follows:
Android examples
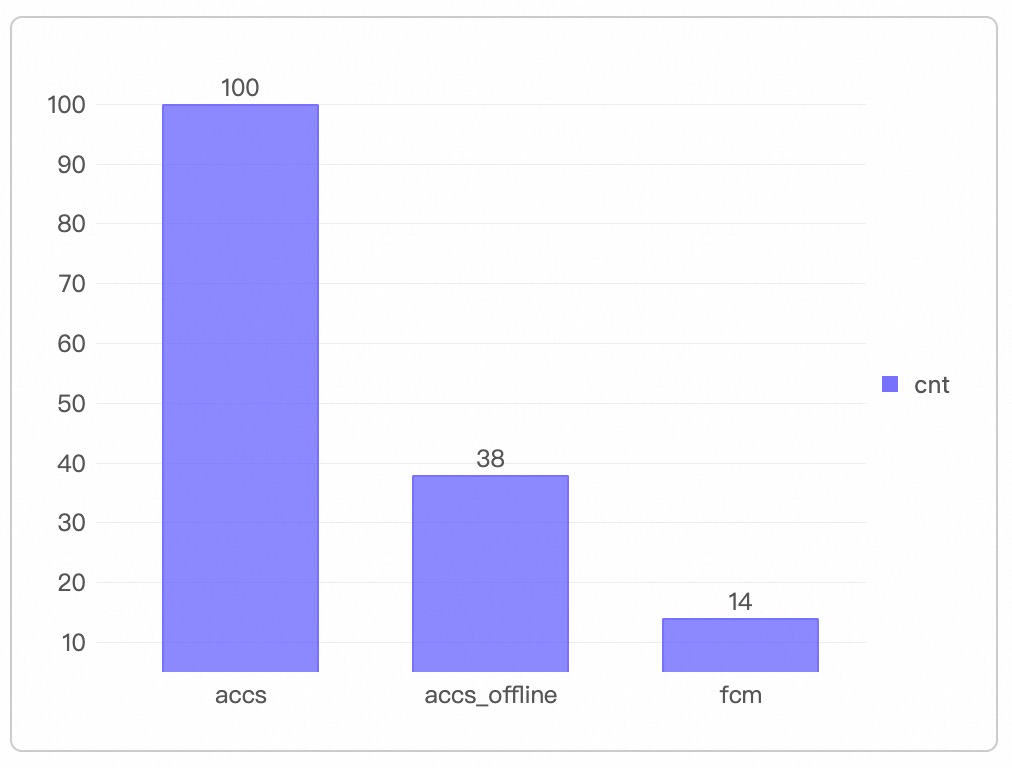
Android: Messages sent per channel
device_type: Android |
SELECT
  event_channel AS channel,
  COUNT(1) AS cnt
FROM log
GROUP BY
  event_channel
ORDER BY
  cnt DESC
Navigate to Chart > General Configuration and for Chart Type, select Funnel Chart Pro![]() . The result is as follows:
. The result is as follows:
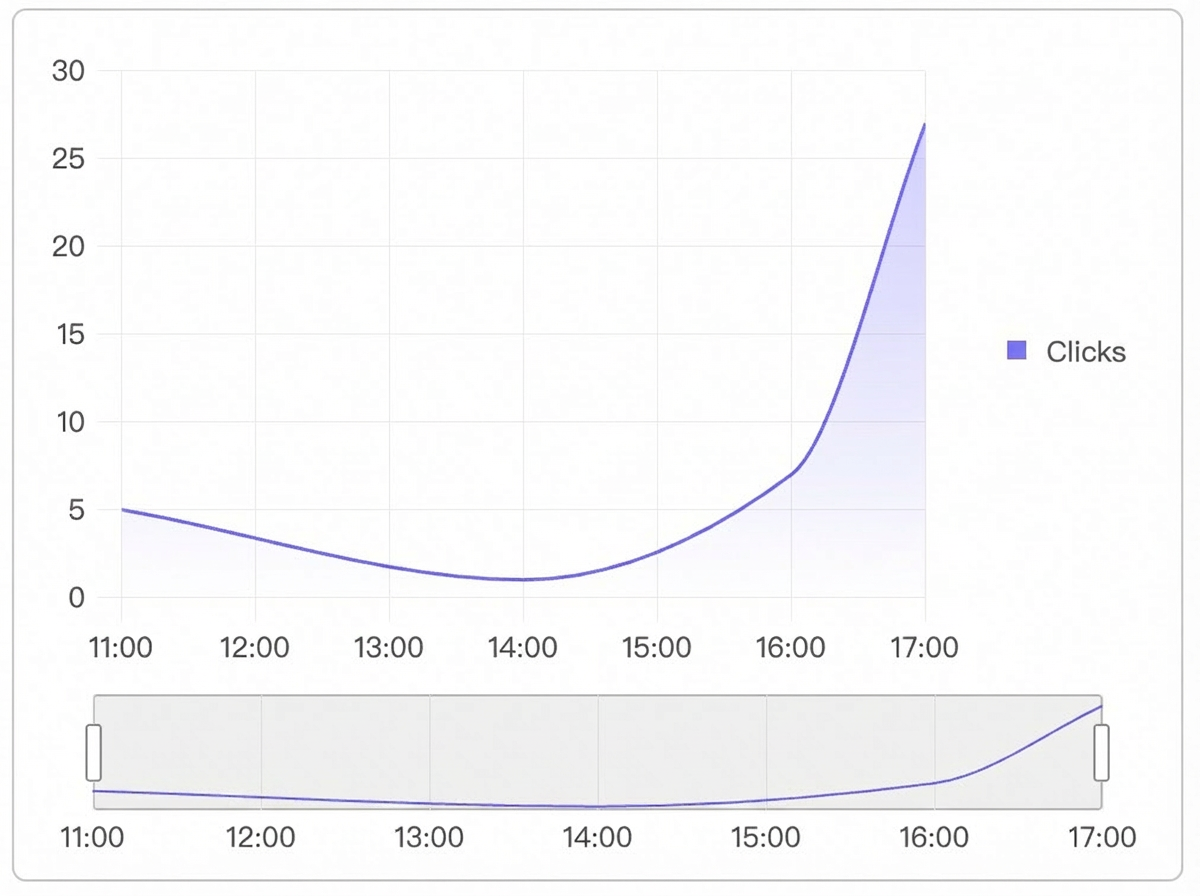
Hourly click trend for Android accs channel
device_type: ANDROID AND event_channel: accs|
SELECT
  date_trunc('hour', __time__) AS ts_hour,
  COUNT(*) AS "Click Count"
GROUP BY
  ts_hour
ORDER BY
  ts_hour
Navigate to Chart > General Configuration and for Chart Type, select Line Chart Pro![]() .
.
Then, click General Configuration-Data Configuration and enable the Data Completion switch. The completion window defaults to auto, and the completion value defaults to 0.
Next, enable Time Series Mode on the chart. The result is as follows:
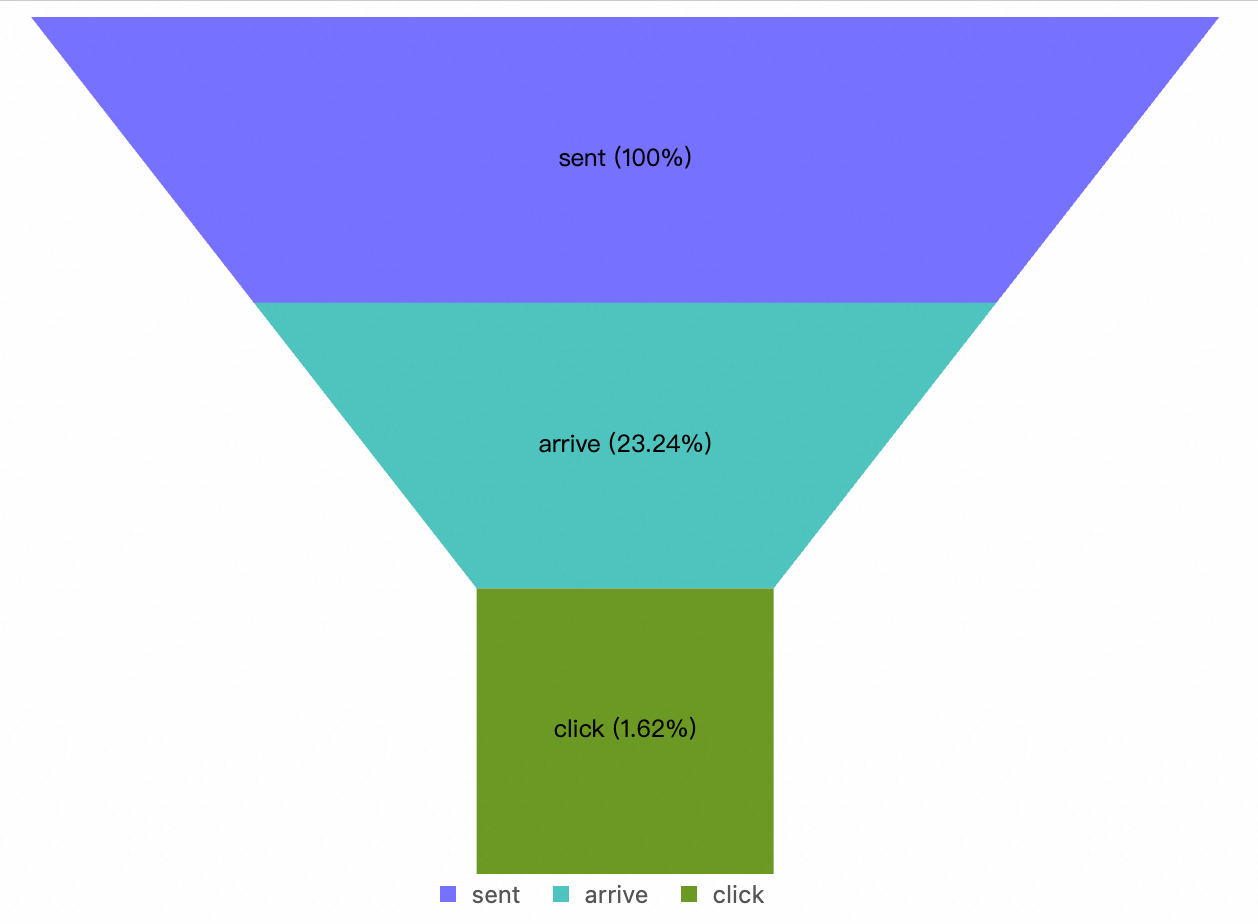
Android app churn rate per push stage
device_type: Android and (event_type:sent or event_type:arrive or event_type:click) |
SELECT
  event_type,
  COUNT(1) AS cnt
FROM  log
GROUP BY
  event_type
ORDER BY
  cnt DESC
Navigate to Chart > General Configuration, and for Chart Type, select Funnel Chart Pro. Then, navigate to Standard Configuration and set Unit to Custom. The result is as follows: