This topic describes how to use Device-cloud Interconnection to analyze service invocation traces and parameters to improve troubleshooting efficiency.
Prerequisites
Install Cloud Toolkit 2021.4.1 or later in IntelliJ IDEA. For more information, see Install and configure Cloud Toolkit in IntelliJ IDEA.
Background information
When an application is running, developers often use breakpoint debugging to troubleshoot service invocation exceptions or resource access failures. However, breakpoint debugging is not suitable for all scenarios and has the following issues:
- Lack of a complete invocation overview: When an upstream service receives a request, it often splits the request into multiple sub-requests and aggregates the results. For example, a service might first access the cache. If the cache access times out, the service then accesses the database and aggregates the data before returning a response. Breakpoint debugging makes it difficult to determine which sub-requests were initiated and the duration of each sub-request.
- Inefficient debugging due to deep class nesting: Service framework encapsulation simplifies operations such as microservice invocations, cache access, and database access. You do not need to understand the internal processing details. However, the underlying processes are often complex. The path from the top-level entry point to a low-level exception usually involves multiple nested class calls, including various synchronous and asynchronous processes. This makes breakpoint debugging very difficult.
- Performance impact from breakpoint debugging: The breakpoint debugging process is usually time-consuming. Service frameworks often have timeout checks. The time spent on debugging can cause the service to time out.
Enable Device-cloud Interconnection and print trace information
- Start IntelliJ IDEA.
- In the top menu bar, choose .
- In the Settings dialog box, choose .
- On the Microservice page, select Device-cloud Interconnection, and then click Advanced Configuration.
- In the Advanced Configuration dialog box, select Print trace information, and then click OK.
Note This feature relies on the underlying ARMS Agent for instrumentation and tracing. The plugin automatically attaches the agent when the application starts. No additional steps are required.
View the request trace
After you start the application, the following trace is displayed when the application invokes a service or accesses an external resource.
The trace output contains the following information:
TraceId: Marks the entire request processing procedure. In a distributed microservice scenario, the TraceId is passed from the frontend application node to all downstream nodes. You can use this TraceId to query the entire trace in the EDAS console or the ARMS console.Service: The request processing entry point for the current application, such as a Spring Cloud service, Dubbo service, or HSF service.API: The method signature in the trace.Line: The specific line number where the method is processed.Cost: The time taken by this method and its downstream processes, in milliseconds.Ext: Extended information, such as request processing status codes, database access SQL statements, and resource destination addresses.Console link: A link to the trace information collected in the ARMS console. ARMS trace collection is near real-time. If the trace is not displayed when you open this link, wait a moment and refresh the page.
Analyze the request trace
By viewing the request trace, you can easily obtain an overview of key nodes in the request processing procedure. To further analyze the parameters, return values, or exceptions of key nodes, you can use the Arthas tool that is integrated in the plugin.
- In the top menu bar, choose .
The plugin automatically downloads and starts the Arthas package, which opens in the Terminal tab in IntelliJ IDEA.Note In IntelliJ IDEA, the application runs in the Run or Debug tab, and Arthas runs in the Terminal tab. You can switch between the tabs as needed.
- Select the target process to attach Arthas. Enter the process serial number and press Enter.
The Arthas interface appears.Note If you start the application locally in a container, you cannot see the process inside the container from the host. You must manually enter the container to attach and monitor the process with Arthas.
- Use the Arthas Trace and Watch commands for analysis. Use the Exit command to quit Arthas.
The request trace analysis provides the class path and method signature of key nodes. For example, for
com.alibaba.edas.boot.DemoConsumerController.redisGetAndSet(), the class path iscom.alibaba.edas.boot.DemoConsumerControllerand the method name isredisGetAndSet. You can use this information for analysis.- Trace command
The Trace command lets you view the internal call path of a method and outputs the time spent at each node in the path. The functionality of the Arthas Trace command is the same as that described in View the request trace. However, they use different instrumentation mechanisms. You can use both for a comprehensive analysis.
The format of the Trace command is as follows:
trace <class-path> <method-name>The following is a sample output:
You can press Q or Ctrl+C to exit this command.
- Watch command
The Watch command lets you observe the processing results of methods at key nodes. You can observe input parameters, return values, and thrown exceptions.
The format of the Watch command is as follows:
watch <class-path> <method-name> <observation-target> <condition>For more information about the command, see the official Arthas documentation. This section describes commonly used command parameters. The following command observes the
redisGetAndSetmethod ofcom.alibaba.edas.boot.DemoConsumerController, outputs the input parameters and return value of the method call, and sets the property traversal depth of the output to 2.watch com.alibaba.edas.boot.DemoConsumerController redisGetAndSet '{params,returnObj}' -x 2The output is as follows:
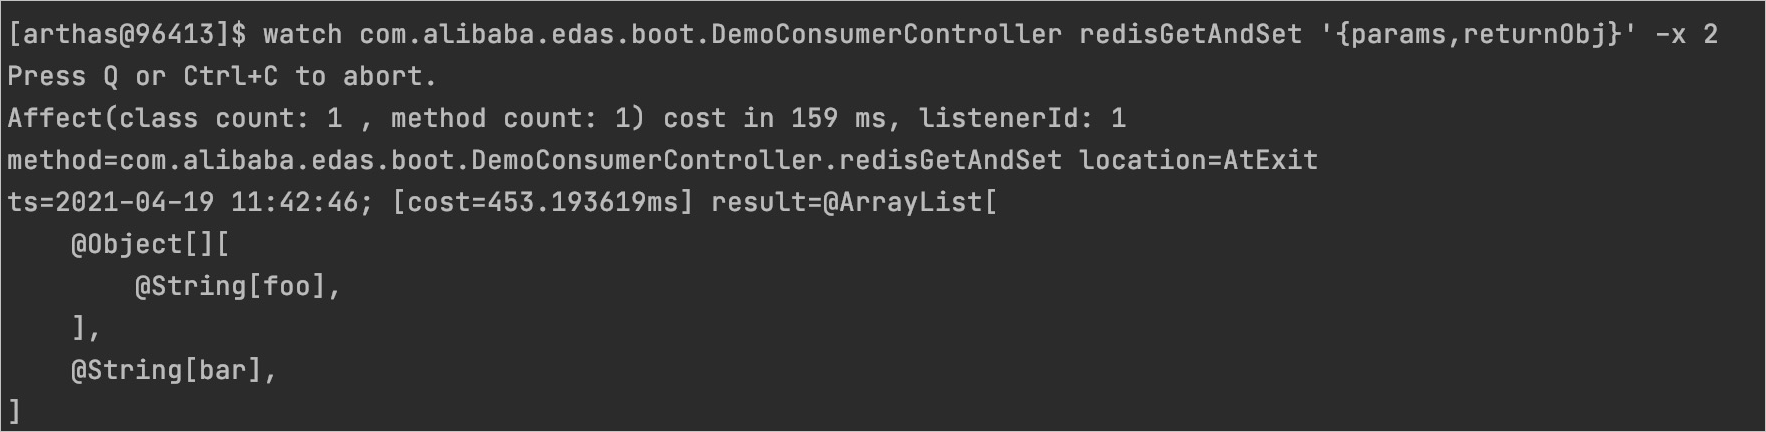 Note The property traversal depth in the example is 2. By adjusting this parameter, you can view the specific property values of complex nested objects in a method call.
You can press Q or Ctrl+C to exit this command.
- Exit command
To stop using Arthas, enter
exitand press Enter.
- Trace command