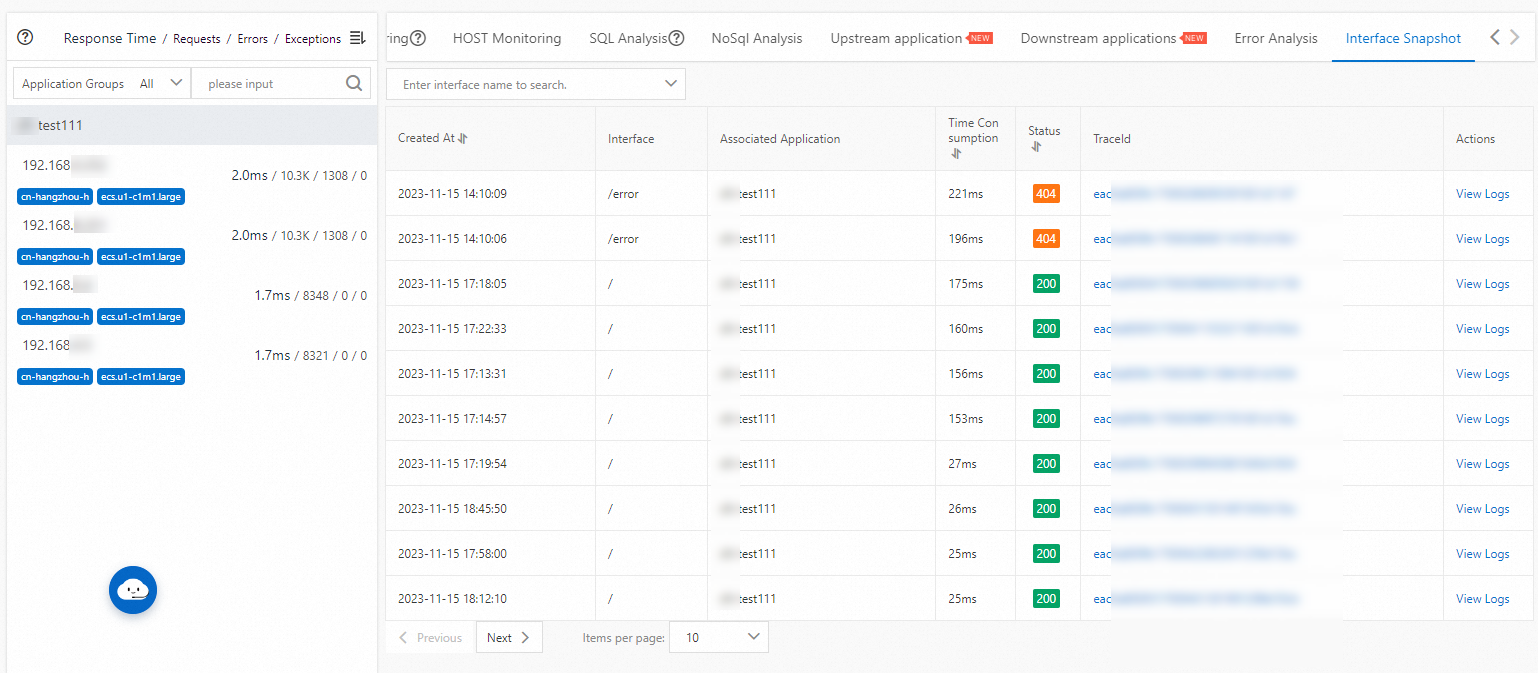
When troubleshooting slow responses or failed API calls in a microservice application, you need to trace individual requests across services. Interface snapshots capture every API call made within an application during a specified time period, showing the trace ID, interface name, timestamp, duration, and status for each call. Use interface snapshots to pinpoint slow operations, identify errors at specific interfaces, and correlate traces with business logs.
Available operations
The Interface Snapshot tab lists all interfaces called in an application during a selected time period. The following table describes the operations available on this tab.
| Operation | Steps |
|---|---|
| Search for a specific interface | Enter the interface name in the search box and press Enter. |
| Inspect a trace | Click a trace ID in the TraceId column to open the trace detail view. For more information, see Trace details. |
| View associated business logs | Click View Logs in the Actions column to see business logs linked to that trace. |
To view logs from the Interface Snapshot tab, associate trace IDs with your application's business logs first. This lets you jump directly from a failed trace to the relevant log entries, which reduces troubleshooting time. For setup instructions, see Associate trace IDs with business logs.
Open the Interface Snapshot tab
Log on to the .
-
In the left-side navigation pane, choose .
On the Applications page, select a region in the top navigation bar. From the Microservices Namespace drop-down list, select a microservices namespace. From the Cluster Type drop-down list, select ECS Clusters. Click the name of the application that you want to manage.
In the left-side navigation pane, choose .
On the Application Details page, select the target node and click the Interface Snapshot tab.