Error analysis tracks application errors over time, breaks down HTTP status codes, and lets you drill down from individual errors to their distributed traces and business logs. Use error analysis to detect error spikes, isolate whether failures are client-side (4xx) or server-side (5xx), and investigate each error.
Prerequisites
Before you begin, make sure that you have:
An application deployed in EDAS
(Optional) Trace IDs associated with your business logs, which enables the View Logs feature for individual errors. For setup instructions, see Associate trace IDs with business logs
Open error analysis
Log on to the .
In the left-side navigation pane, click Applications.
On the Applications page, select a region in the top navigation bar and an option from the Microservice Namespace drop-down list. Select ECS Clusters from the Cluster Type drop-down list. Then, click the name of the application whose errors you want to analyze.
In the left-side navigation pane, choose .
On the Application Details page, click the node you want to inspect, and then click the Error Analysis tab on the right.
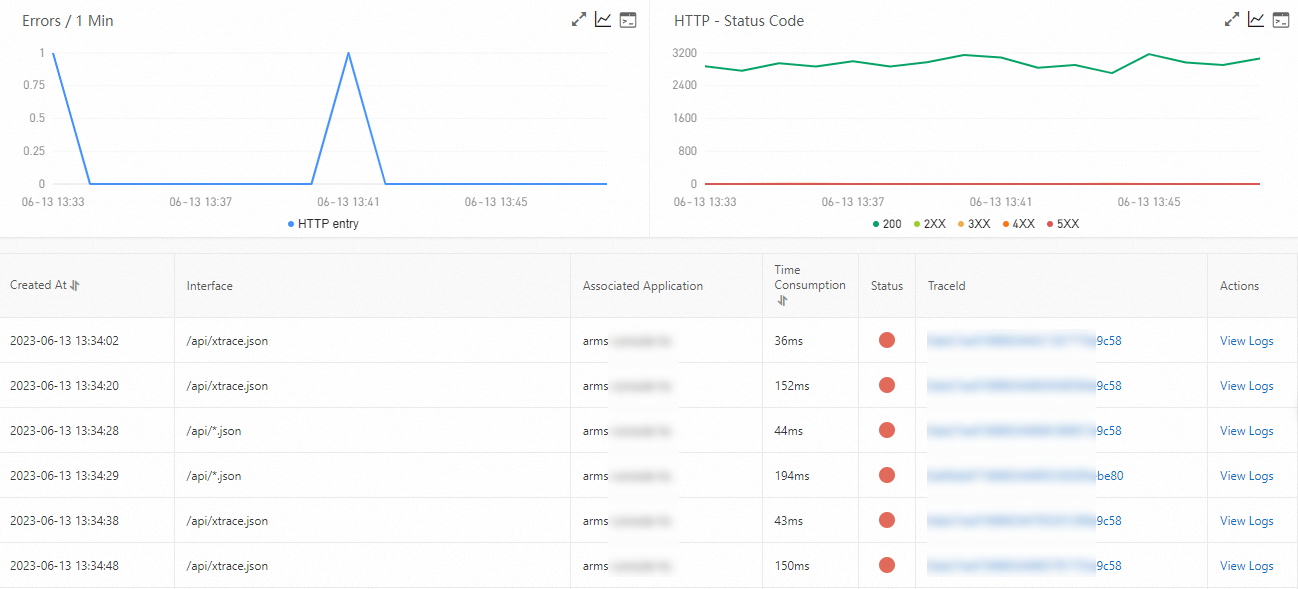
The Error Analysis tab contains three sections:
| Section | Description |
|---|---|
| Errors | A time series chart that shows the error count over the selected time period. Use it to spot error spikes. |
| HTTP - Status Code | A time series chart that breaks down HTTP status codes returned by the application. Use it to distinguish client errors (4xx) from server errors (5xx). |
| Error list | A table of individual errors with trace IDs and log access. Use it to drill down into specific errors. |
Error count trend
The Errors section shows the number of errors over the selected time period as a time series curve. Use this chart to spot error spikes.
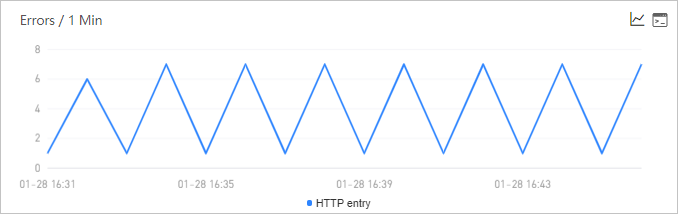
The chart supports the following interactions:
| Action | How |
|---|---|
| View detailed statistics | Hover over a data point |
| Zoom into a time range | Click and drag to select a range |
| Compare across dates | Click the  icon to view metrics for a specific period or compare the same period across different dates icon to view metrics for a specific period or compare the same period across different dates |
| View API details | Click the  icon icon |
HTTP status code distribution
The HTTP - Status Code section breaks down HTTP status codes returned by the application over the selected time period. Use this chart to distinguish between client errors (4xx) and server errors (5xx) and identify patterns in specific status codes.
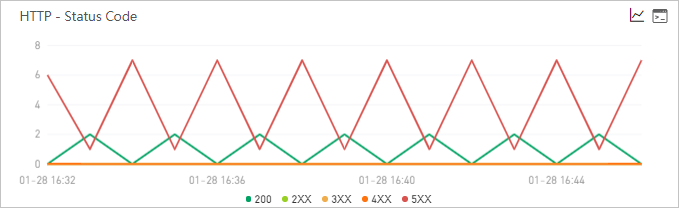
The chart supports the following interactions:
| Action | How |
|---|---|
| View detailed statistics | Hover over a data point |
| Zoom into a time range | Click and drag to select a range |
| Toggle a status code series | Click the corresponding legend entry |
| Compare across dates | Click the icon to view metrics for a specific period or compare the same period across different dates |
| View API details | Click the icon |
Error list
The error list shows every error that occurred during the selected time period. Each row includes error details and a trace ID linked to the full distributed trace.
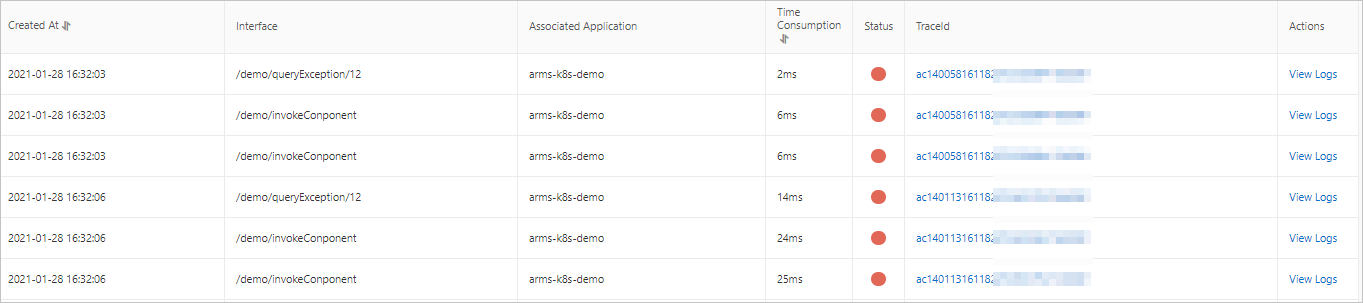
To investigate an error:
| Action | How |
|---|---|
| View the distributed trace | Click the trace ID in the TraceId column |
| View associated business logs | Click View Logs in the Actions column |
The View Logs feature requires trace IDs to be associated with your application's business logs. For setup instructions, see Associate trace IDs with business logs.
Troubleshoot errors with error analysis
Combine the three sections to build a complete picture of an issue:
Spot the anomaly. Check the Errors chart for spikes. Note the time when the spike occurred.
Narrow the scope. Switch to HTTP - Status Code to determine whether the errors are client-side (4xx) or server-side (5xx). A cluster of 5xx codes typically points to a backend or infrastructure issue, while 4xx codes suggest invalid requests or authentication problems.
Find the root cause. In the error list, locate errors from the spike period. Click the trace ID to view the distributed trace and pinpoint where the failure occurred.
Check the logs. Click View Logs for the error to review associated business logs and gather additional context.