The application topology in Managed Service for OpenTelemetry visualizes the relationships among internal services of your application, so you can trace request flows and understand how your services connect at a glance.
Prerequisites
Before you begin, make sure that you have:
An Alibaba Cloud account with access to the Managed Service for OpenTelemetry console
Application data reported to Managed Service for OpenTelemetry. For details, see Connection Description
View the application topology
Log on to the . In the left-side navigation pane, click Applications.
On the Applications page, select a region in the top navigation bar, then click the name of the application you want to manage.
In the top navigation bar, click the Topology tab.
The topology displays the relationships among internal services of your application for the selected time range.
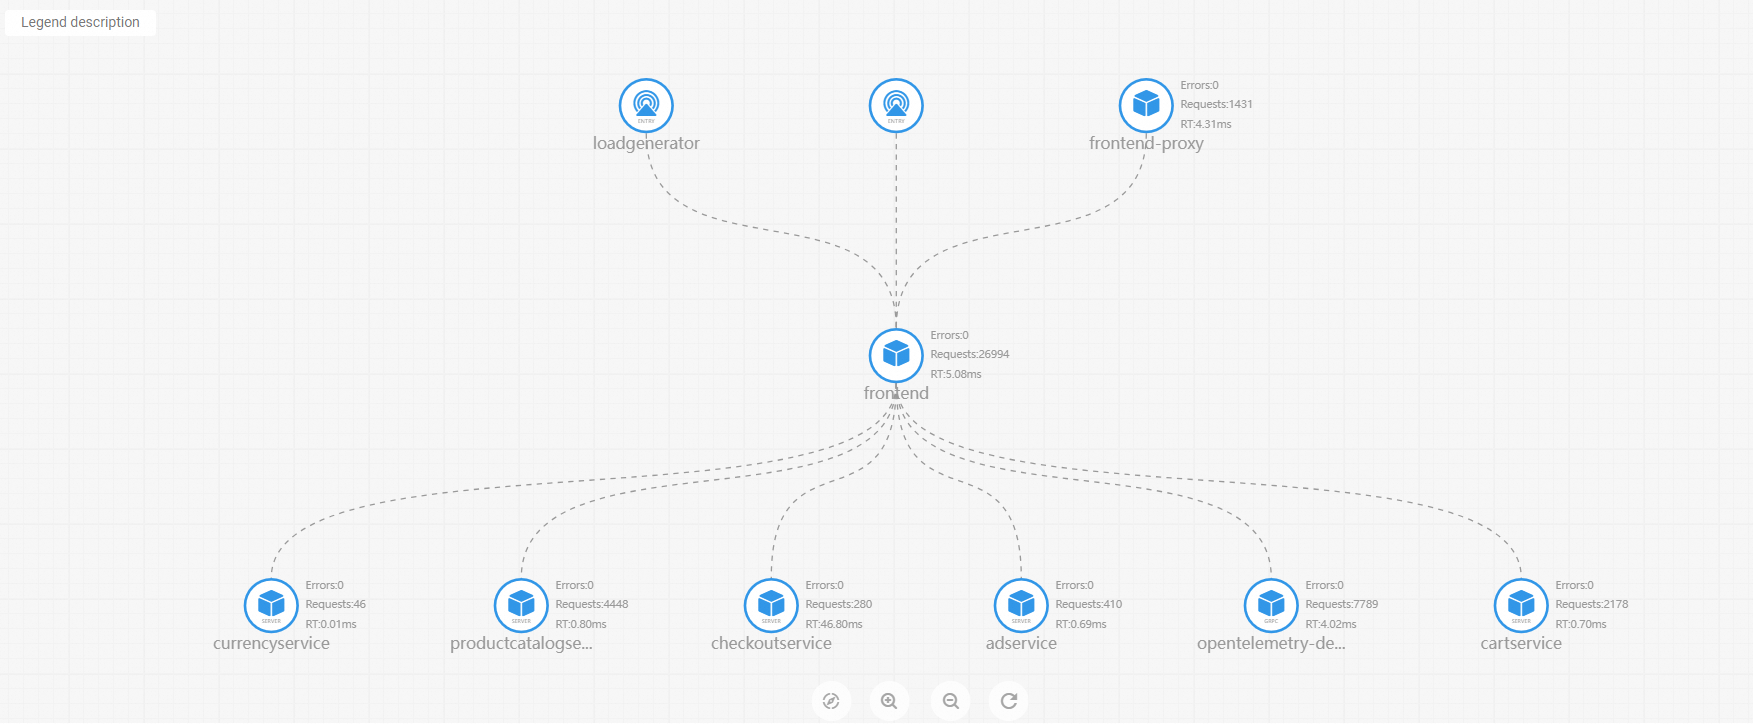
Read the topology
The topology map represents each internal service as a node and each call relationship as a connection line between nodes. Use the topology to:
Trace request flows -- Follow connections to see how requests travel from one service to another.
Understand dependencies -- See which services depend on each other in the call chain.
Filter by time range
Adjust the time range at the top of the topology view to compare service relationships across different time periods.
What's next
Connection Description -- Set up data reporting for additional applications.