When application response times degrade, the root cause often lies in database interactions -- slow queries, connection spikes, or unexpected load patterns. Database analysis in Managed Service for OpenTelemetry, a feature of Application Real-Time Monitoring Service (ARMS), surfaces these issues by tracking request volumes, response times, and slow queries across all databases your applications connect to.
With database analysis, you can:
Monitor request trends and average response times across all databases.
Identify slow queries that degrade application performance.
Filter by database name, type, application, or instance to isolate specific issues.
Drill down from a database overview into individual calls and distributed traces.
Page layout
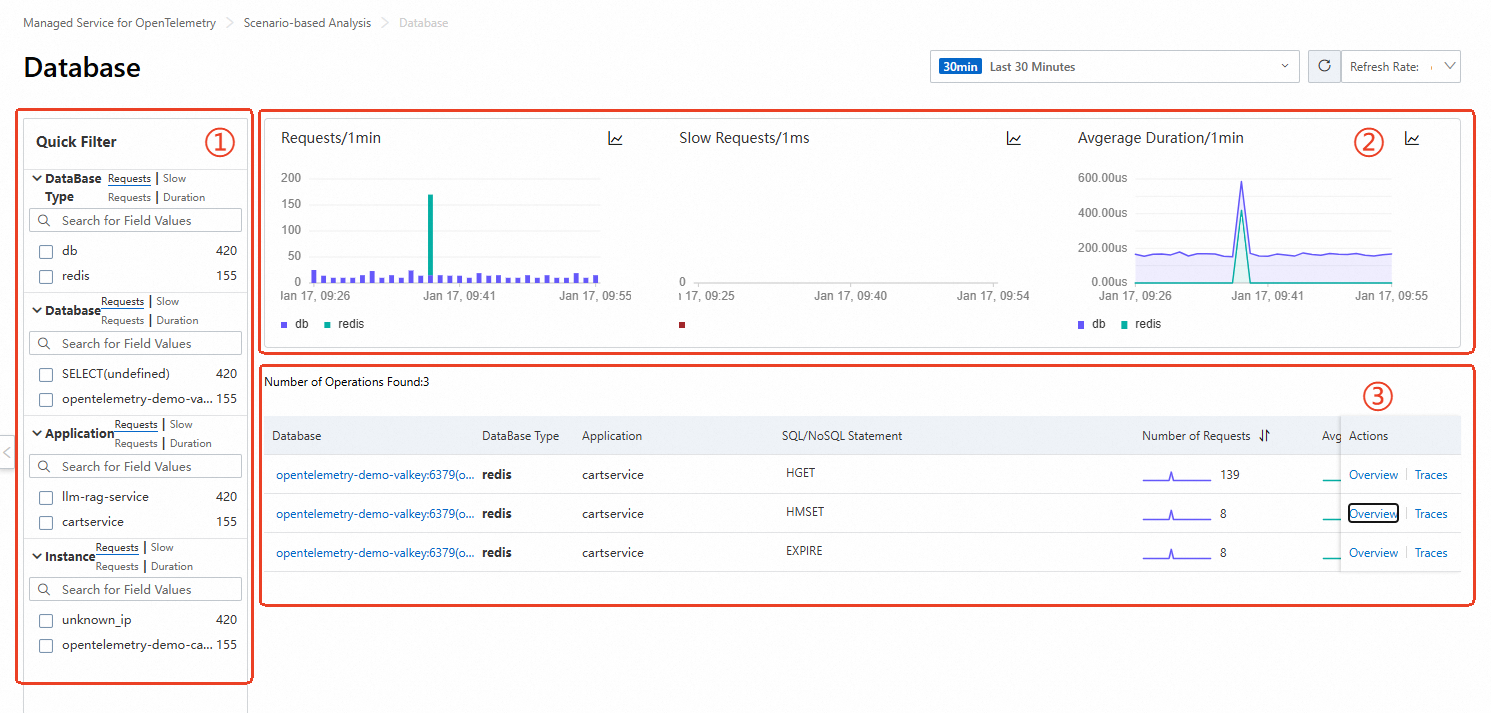
The database analysis page has three sections:
| Section | Description |
|---|---|
| Quick Filter (icon 1) | Narrow the database list by database name, database type, application, and instance. |
| Trend charts (icon 2) | Time-series graphs for request volume, slow query count, and average duration. |
| Database list (icon 3) | Per-database metrics: database name, application, SQL or NoSQL statements, number of requests, average duration, and slow queries. |
Open the database analysis page
Log on to the Managed Service for OpenTelemetry console.
In the left-side navigation pane, choose Scenario-based Analysis > Database.
In the upper-right corner, select a time range.
Filter databases
Use the Quick Filter section (icon 1 in the preceding figure) to narrow results by one or more of the following criteria:
| Filter | Use case |
|---|---|
| Database name | Find a specific database when you already know its name. |
| Database type | Isolate all databases of a given type. |
| Application | Show only databases called by a particular application. |
| Instance | Narrow results to a single application instance. |
Combine multiple filters to focus on a specific subset -- for example, all databases of a particular type called by a specific application on a specific instance.
Analyze trends
The trend charts (icon 2) display three time-series graphs:
Database requests -- total request volume over the selected time range.
Slow queries -- number of queries that exceed the slow-query threshold.
Average duration -- mean response time across all database calls.
Compare metrics across time periods
Click the  icon to open the comparison dialog, where you can:
View metric data for a specific time window.
Compare the same time window across different dates to spot regressions or improvements.
Switch chart types
Toggle between a column chart ( ) and a trend chart (
 ) depending on what you need:
| Chart type | Best for |
|---|---|
| Column chart | Comparing discrete values across time intervals. |
| Trend chart | Observing patterns, spikes, or gradual changes over time. |
Investigate individual databases
The database list (icon 3) shows every monitored database with these metrics:
| Column | Description |
|---|---|
| Database name | Name of the database, linked to its call-level analysis. |
| Application | The application that calls this database. |
| SQL or NoSQL statements | Statements executed against the database. |
| Number of requests | Total request count in the selected time range. |
| Average duration | Mean response time per request. |
| Slow queries | Count of queries exceeding the slow-query threshold. |
Drill-down actions
From the database list, drill down in three ways:
| Action | How | Result |
|---|---|---|
| View database calls | Click a database name. | Call-level analysis for that database. See Database call analysis. |
| View overview | Click Overview in the Actions column. | Summary of request count, slow queries, average duration, and call distribution. |
| View traces | Click Traces in the Actions column. | End-to-end trace data showing how a database call fits into the broader request flow. See Trace Explorer. |
Troubleshoot a slow database call
To find and diagnose the root cause of a slow database call:
Set the time range to the period when the issue occurred.
Use Quick Filter to narrow results to the affected database type or application.
Check the trend charts for spikes in slow queries or average duration during that period.
In the database list, find the problematic database by reviewing the Average duration or Slow queries columns.
Click the database name to inspect individual calls, or click Traces to view the full request path from the application to the database and back.