After you configure the integration, Managed Service for Prometheus pulls performance metrics from Kafka, enabling real-time monitoring and data analysis.
Prerequisites
Container cluster
-
Activate Managed Service for Prometheus. For more information, see Prometheus instance billing.
-
Create a Kubernetes cluster. For more information, see Create an ACK managed cluster.
-
Activate Alibaba Cloud Resource Center. For more information, see Activate Resource Center.
ECS (VPC)
-
Managed Service for Prometheus is activated. Instance billing.
-
An ECS instance is created. Create and manage an ECS instance by using the ECS console (express version).
-
Resource Center is activated. Activate Resource Center.
Integrate Kafka
Log on to the Managed Service for Prometheus console. In the left-side navigation pane, click Integration Center.
-
Click the Kafka card and follow the on-screen instructions to complete the integration. The following tables describe the key parameters.
Container cluster
Parameter
Description
pod label selector
The label key and value configured for the pod when you deploy the JMX agent. Managed Service for Prometheus uses this label for service discovery. For more information, see Deploy and configure a Kafka JMX agent.
metric collection interval
The interval for collecting monitoring data. The default value is 15.
ECS (VPC)
Parameter
Description
Kafka cluster name
Assign a unique cluster name for each integration to prevent duplicate metric scraping and incorrect dashboard results.
Endpoint
The IP address or DNS name of a Kafka broker. Separate multiple addresses with commas or semicolons.
Example: 192.168.0.1:9092,10.0.11.123:9092
Enable SASL
Select if the Kafka server uses SASL.
SASL Username
If SASL is enabled, enter the username.
SASL Password
If SASL is enabled, enter the password.
SASL Mechanism
Select the SASL mechanism. Valid values: plain, scram-sha512, and scram-sha256.
Enable TLS
Select if the Kafka server uses TLS.
Ignore TLS security verification
If TLS is enabled on the Kafka server and you use a self-signed certificate, select this option to ignore TLS security verification.
metric collection interval
The interval for collecting monitoring data. The default value is 15.
Custom Tags
Add tags to the metrics of the ECS instance. Then, you can monitor, manage, query, or analyze the metric data in a fine-grained manner when you use tools such as Grafana. For more information, see Add custom tags to ECS instance metrics in a VPC.
NoteA tag key cannot contain special characters used in the Prometheus functionality, such as hyphens (-), periods (.), or percent signs (%).
Tags must be specified in the key-value format required by Prometheus.
View Kafka component status
The installed component is displayed on the Integration Management page in the Managed Service for Prometheus console. The Integration Management page consists of the Integrated Environments, Integrated Addons, and Query Dashboards tabs, where you can view information such as targets, metrics, dashboards, and alerts.
Targets
On this tab, you can view the list of targets discovered by the default integration jobs.
The Targets page lists information for each scrape target, including its Endpoint, State, Labels, Last Scrape, Scrape Duration, and Error. If a target's State is DOWN (red label), the Error column displays the specific reason, such as connection refused. This indicates that the target endpoint is unreachable and you must verify that the service port on the instance is listening.
Metric scraping
On this tab, you can view detailed metric information and configure metrics to be dropped. For more information, see Configure metrics to be dropped.
On the Metric Scraping tab, select Custom Scrape to view a list of configured scraping tasks. The list includes the name, job name, associated component, service discovery method, scrape path, and scrape interval. For example, for the kafka and ecs-node-exporter tasks, the service discovery method is kubernetes_sd_configs, the scrape path is /metrics, and the scrape interval is 15s. For each task, you can select Disable, View Config, or Delete. You can also add a new scraping task by clicking Add.
Dashboards
You can click a dashboard name to view the corresponding Grafana dashboard.
On the Dashboards tab, you can search for a dashboard by name or filter by tags, such as Kafka. The table displays the dashboard names and their corresponding tags. For example, a Kafka Basic dashboard is included by default.
For example, the Prometheus Agent dashboard has job, instance, and agent drop-down filters. Its panels display information about Agent Status, various errors (such as Agent Discovery/Scrape Errors, Agent Configuration Delivery Errors, and Agent Scrape Processing Errors), and the Agent Version. At the bottom, the Agent Overview table displays metrics such as agent name, heartbeat, targets, series, writeArms, pod_name, memoryUsed, memoryLimit, cpuUsed, and cpuLimit.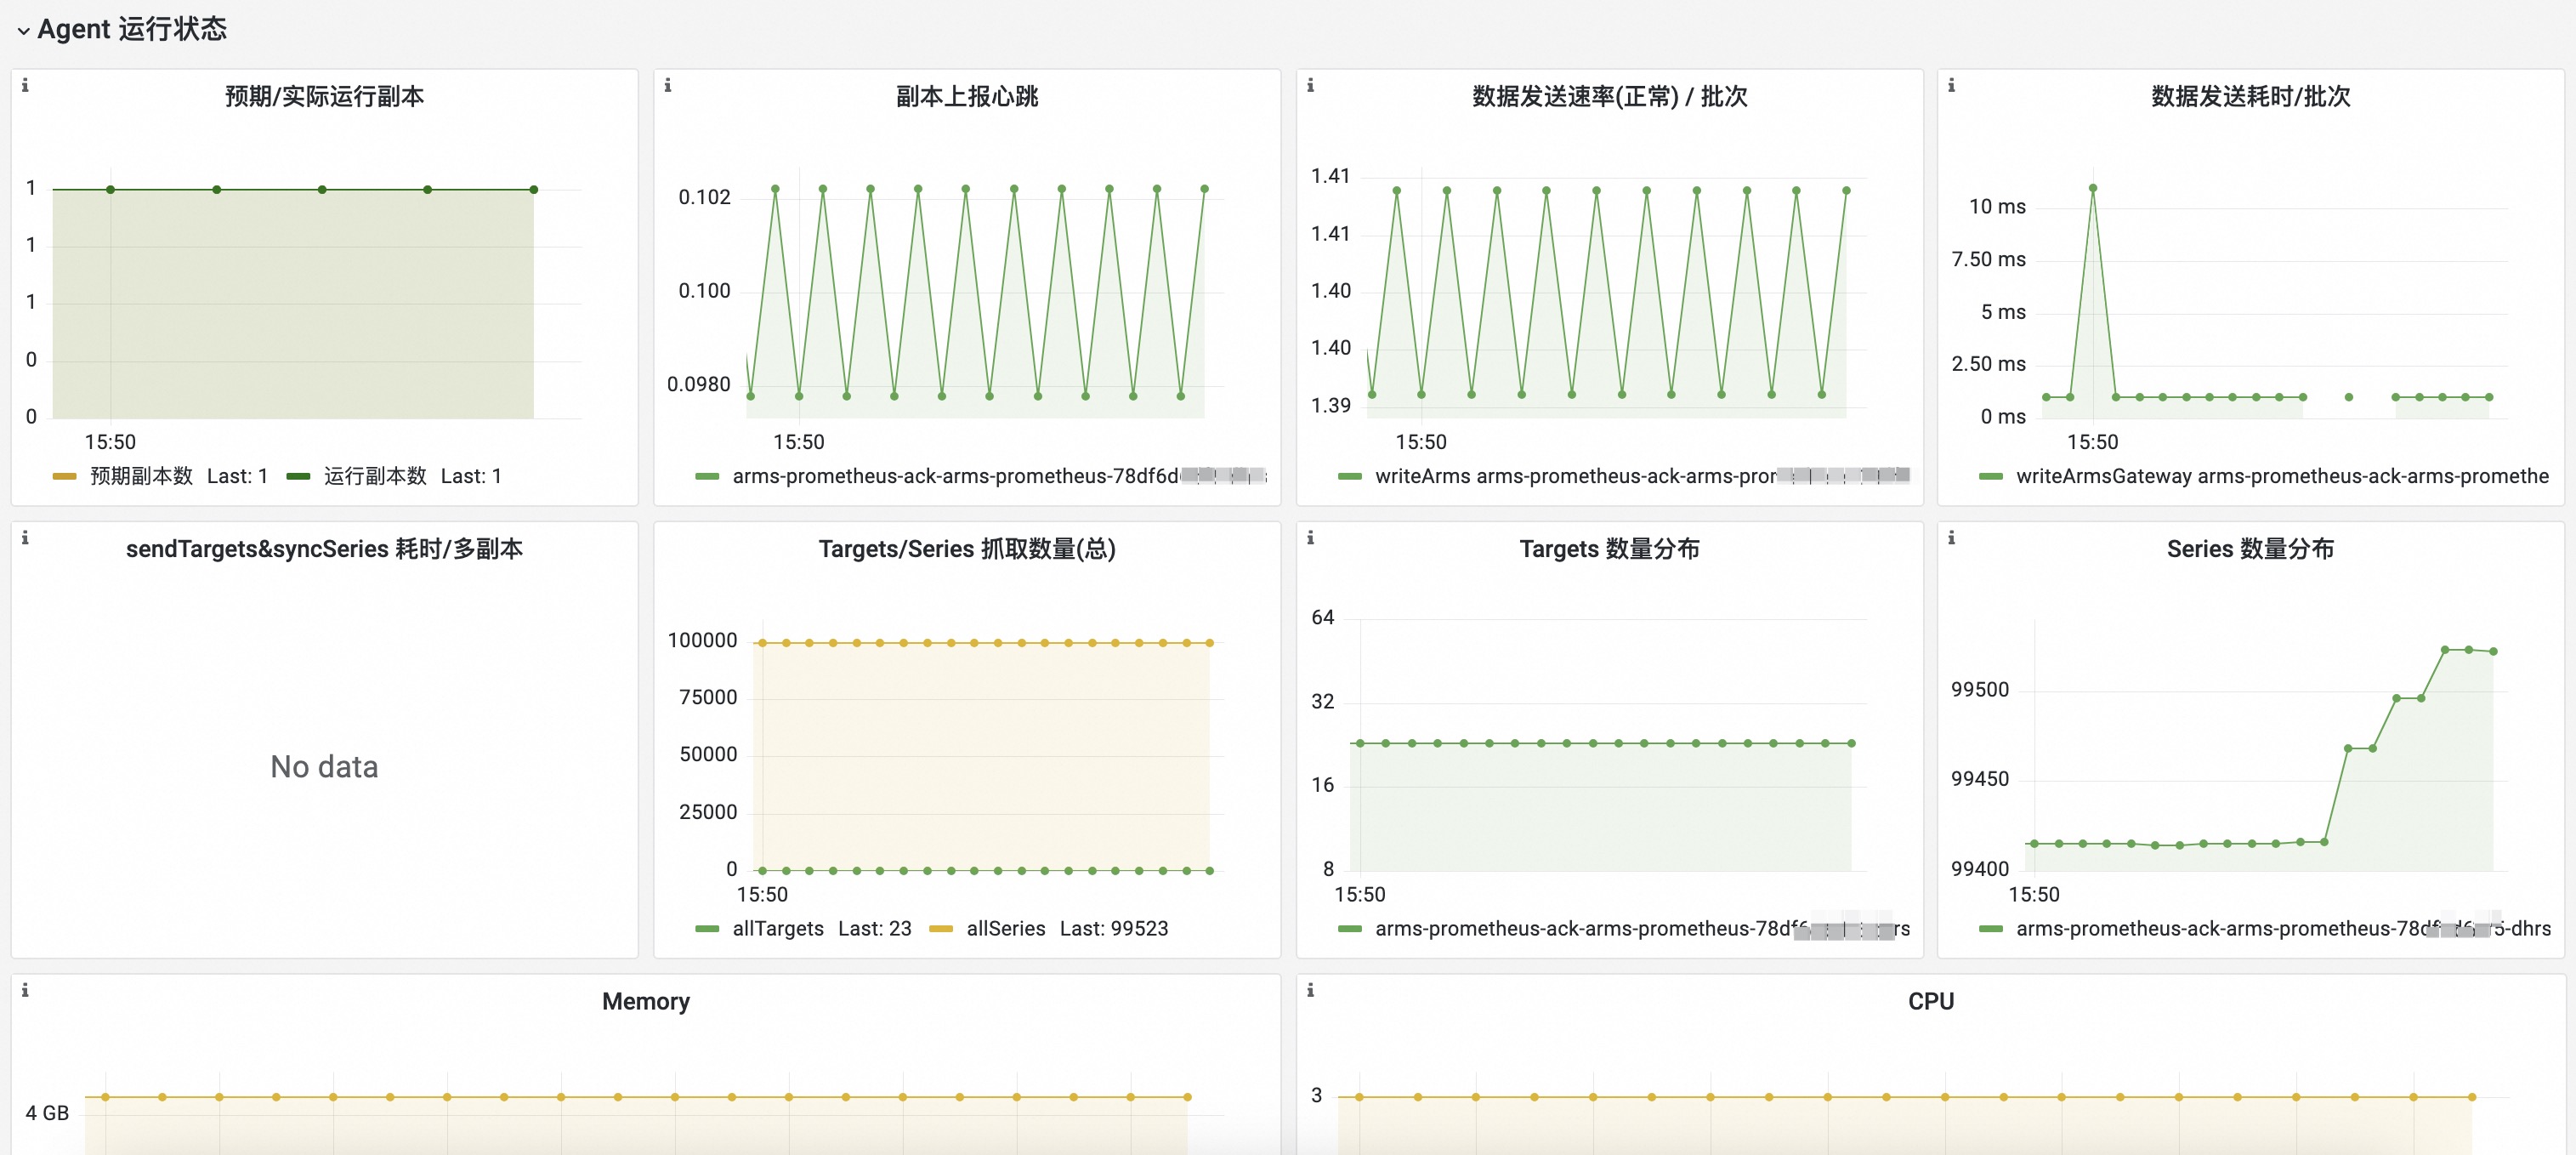
Related documents
-
Create alert rules for key metrics to monitor their health in real time and handle exceptions promptly. For more information, see Create alert rules for a Prometheus instance.
-
For more information about monitoring Kafka with Prometheus, see Monitor Kafka using Prometheus.