To support flexible and diverse visual analysis, Quick BI separates data configuration from style settings. The data pane lets you quickly create new fields for a chart. This topic describes common chart operations on the dashboard editor page.
Chart data pane
Configure field styles in batches
To modify multiple fields efficiently, edit them in batches.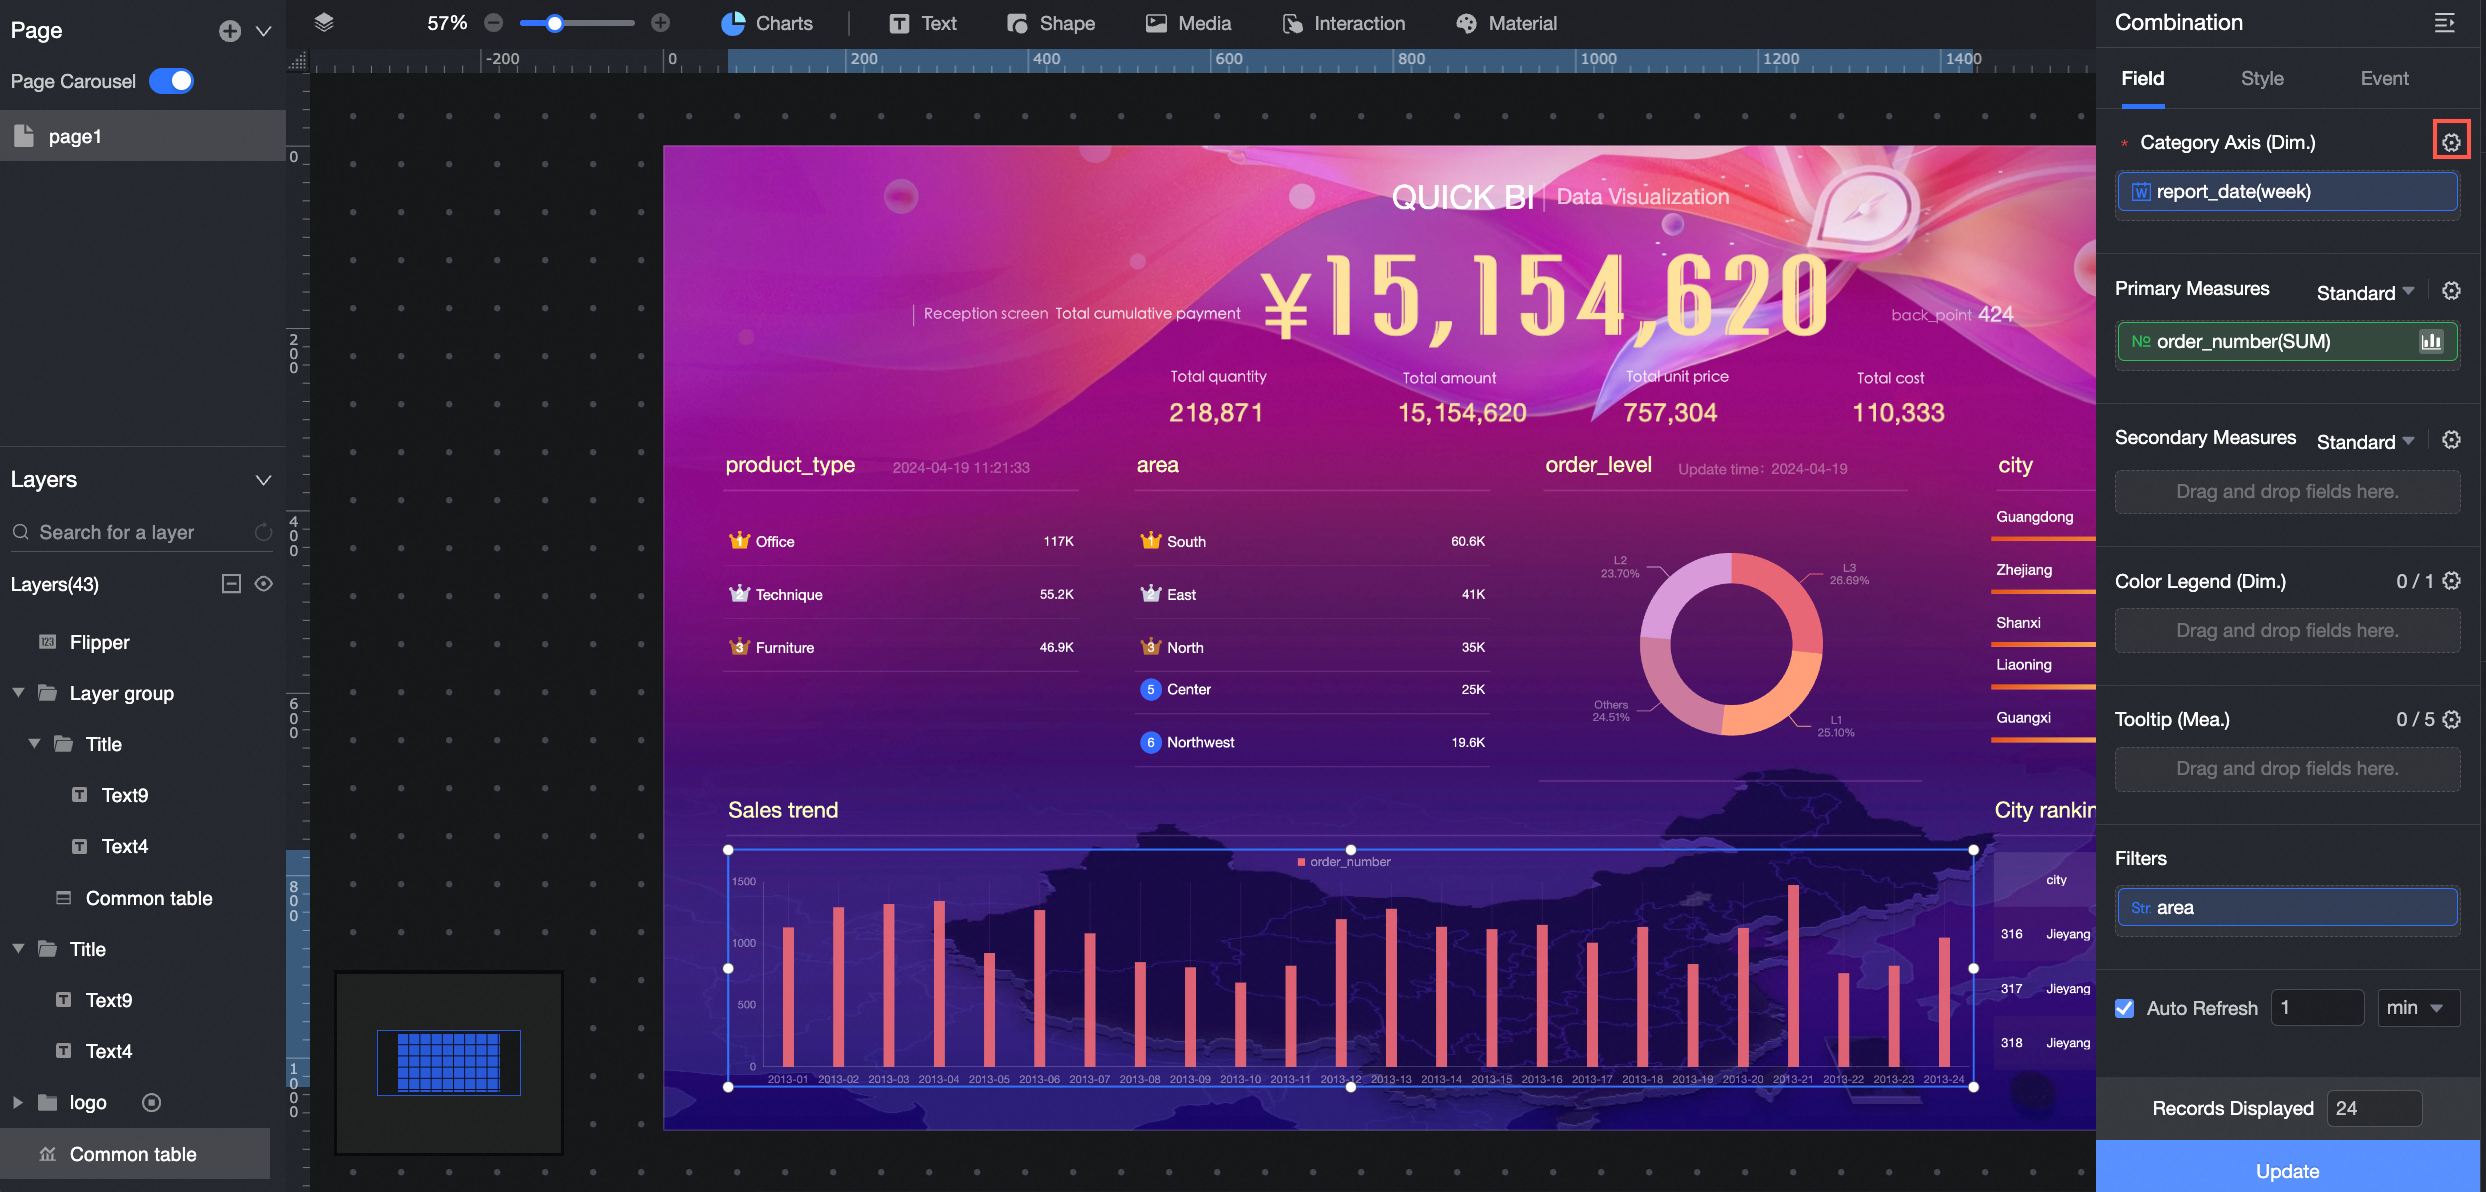
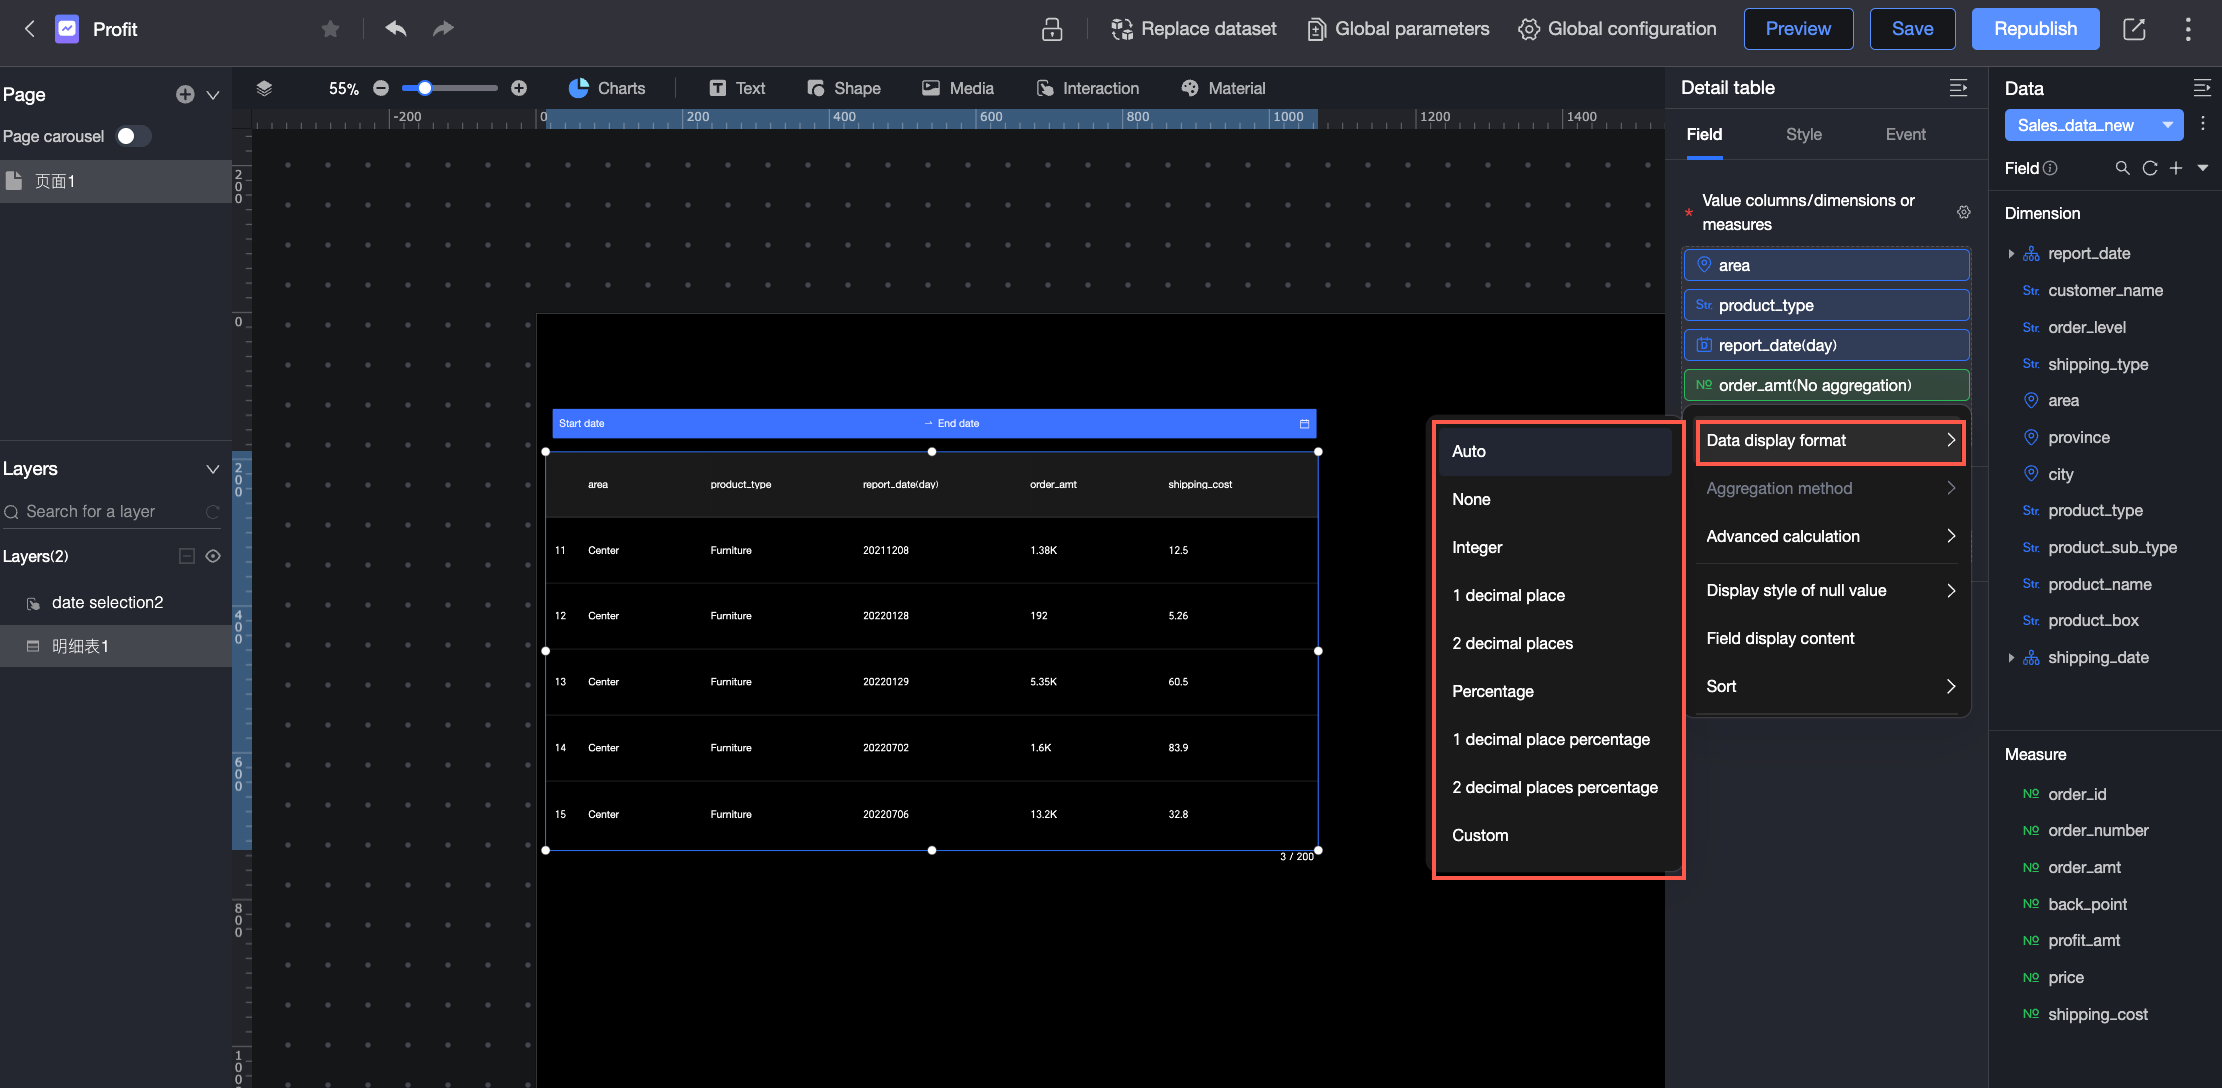
Set data display format
You can set the display format for a measure. Supported formats include Auto, None (displays the original value), Integer, 1 Decimal Place, 2 Decimal Places, Percentage, Percentage (1 decimal place), Percentage (2 decimal places), and Custom.
For more information about configuring display formats in Custom mode, see Custom Data Display Format.
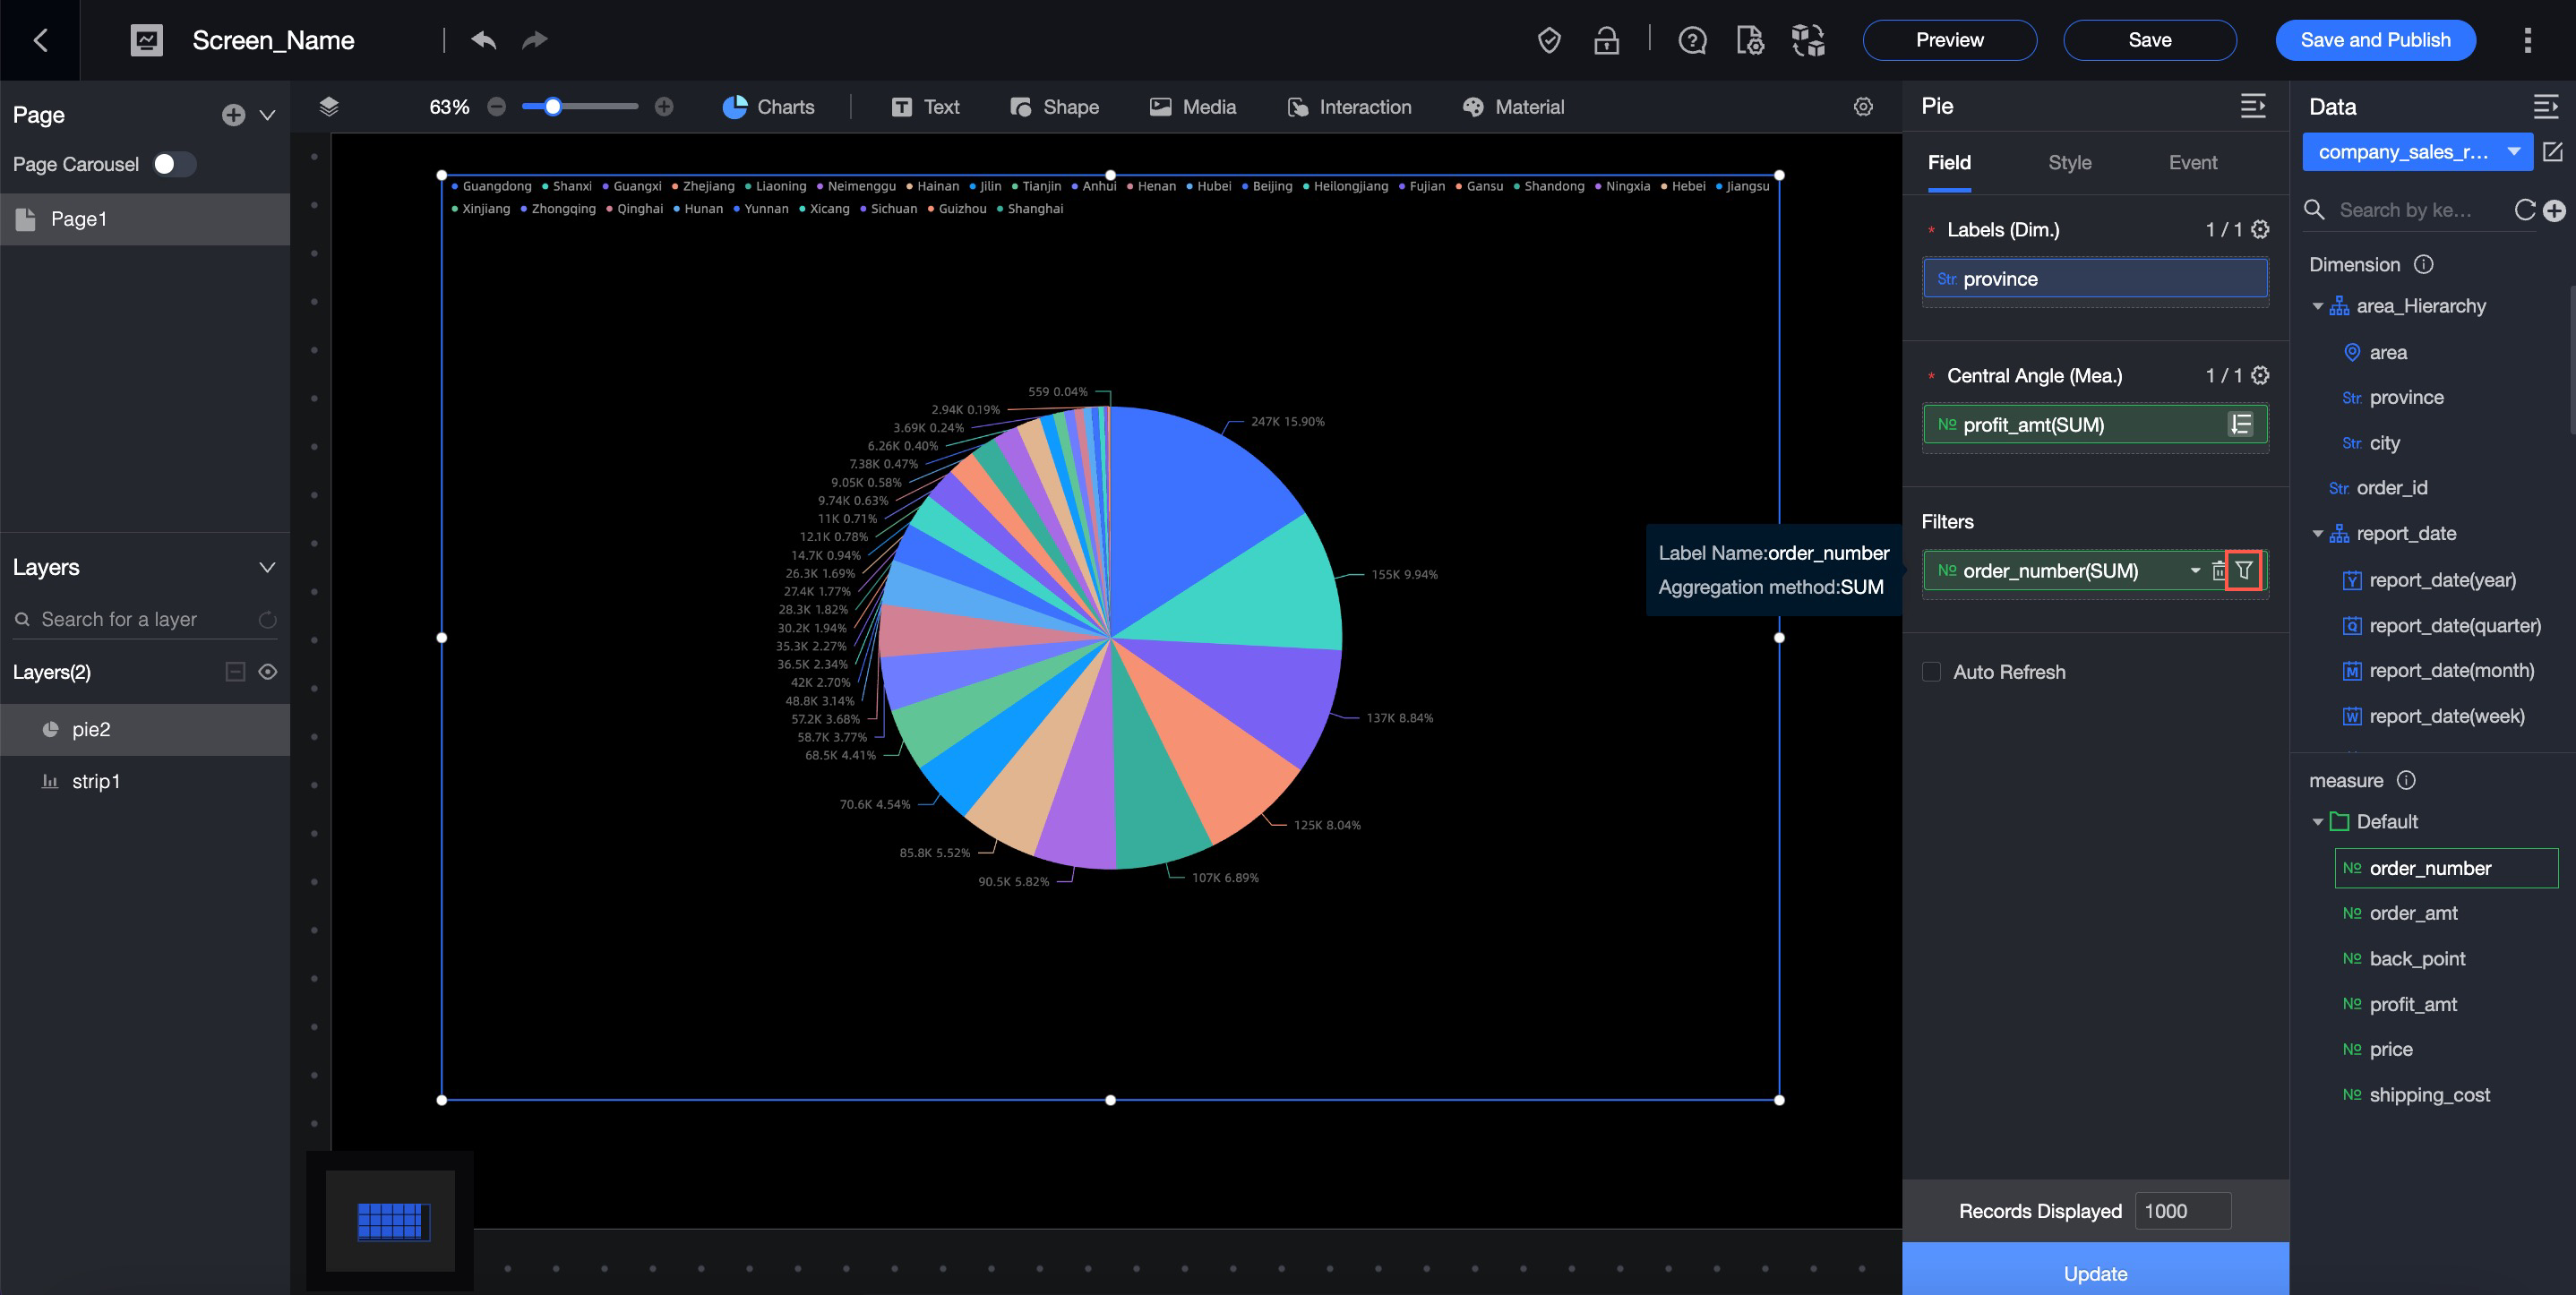
Filter data
Filters narrow the data in your chart. For large datasets, use a filter to display only the necessary data, which makes your report more precise. You can filter data by text, numeric, and date fields.
Text fields
You can set a filter to filter out municipalities from the province field.
Example: Filter by province
In the Filter pane, next to the Province field, click the
 icon to set the filter range.
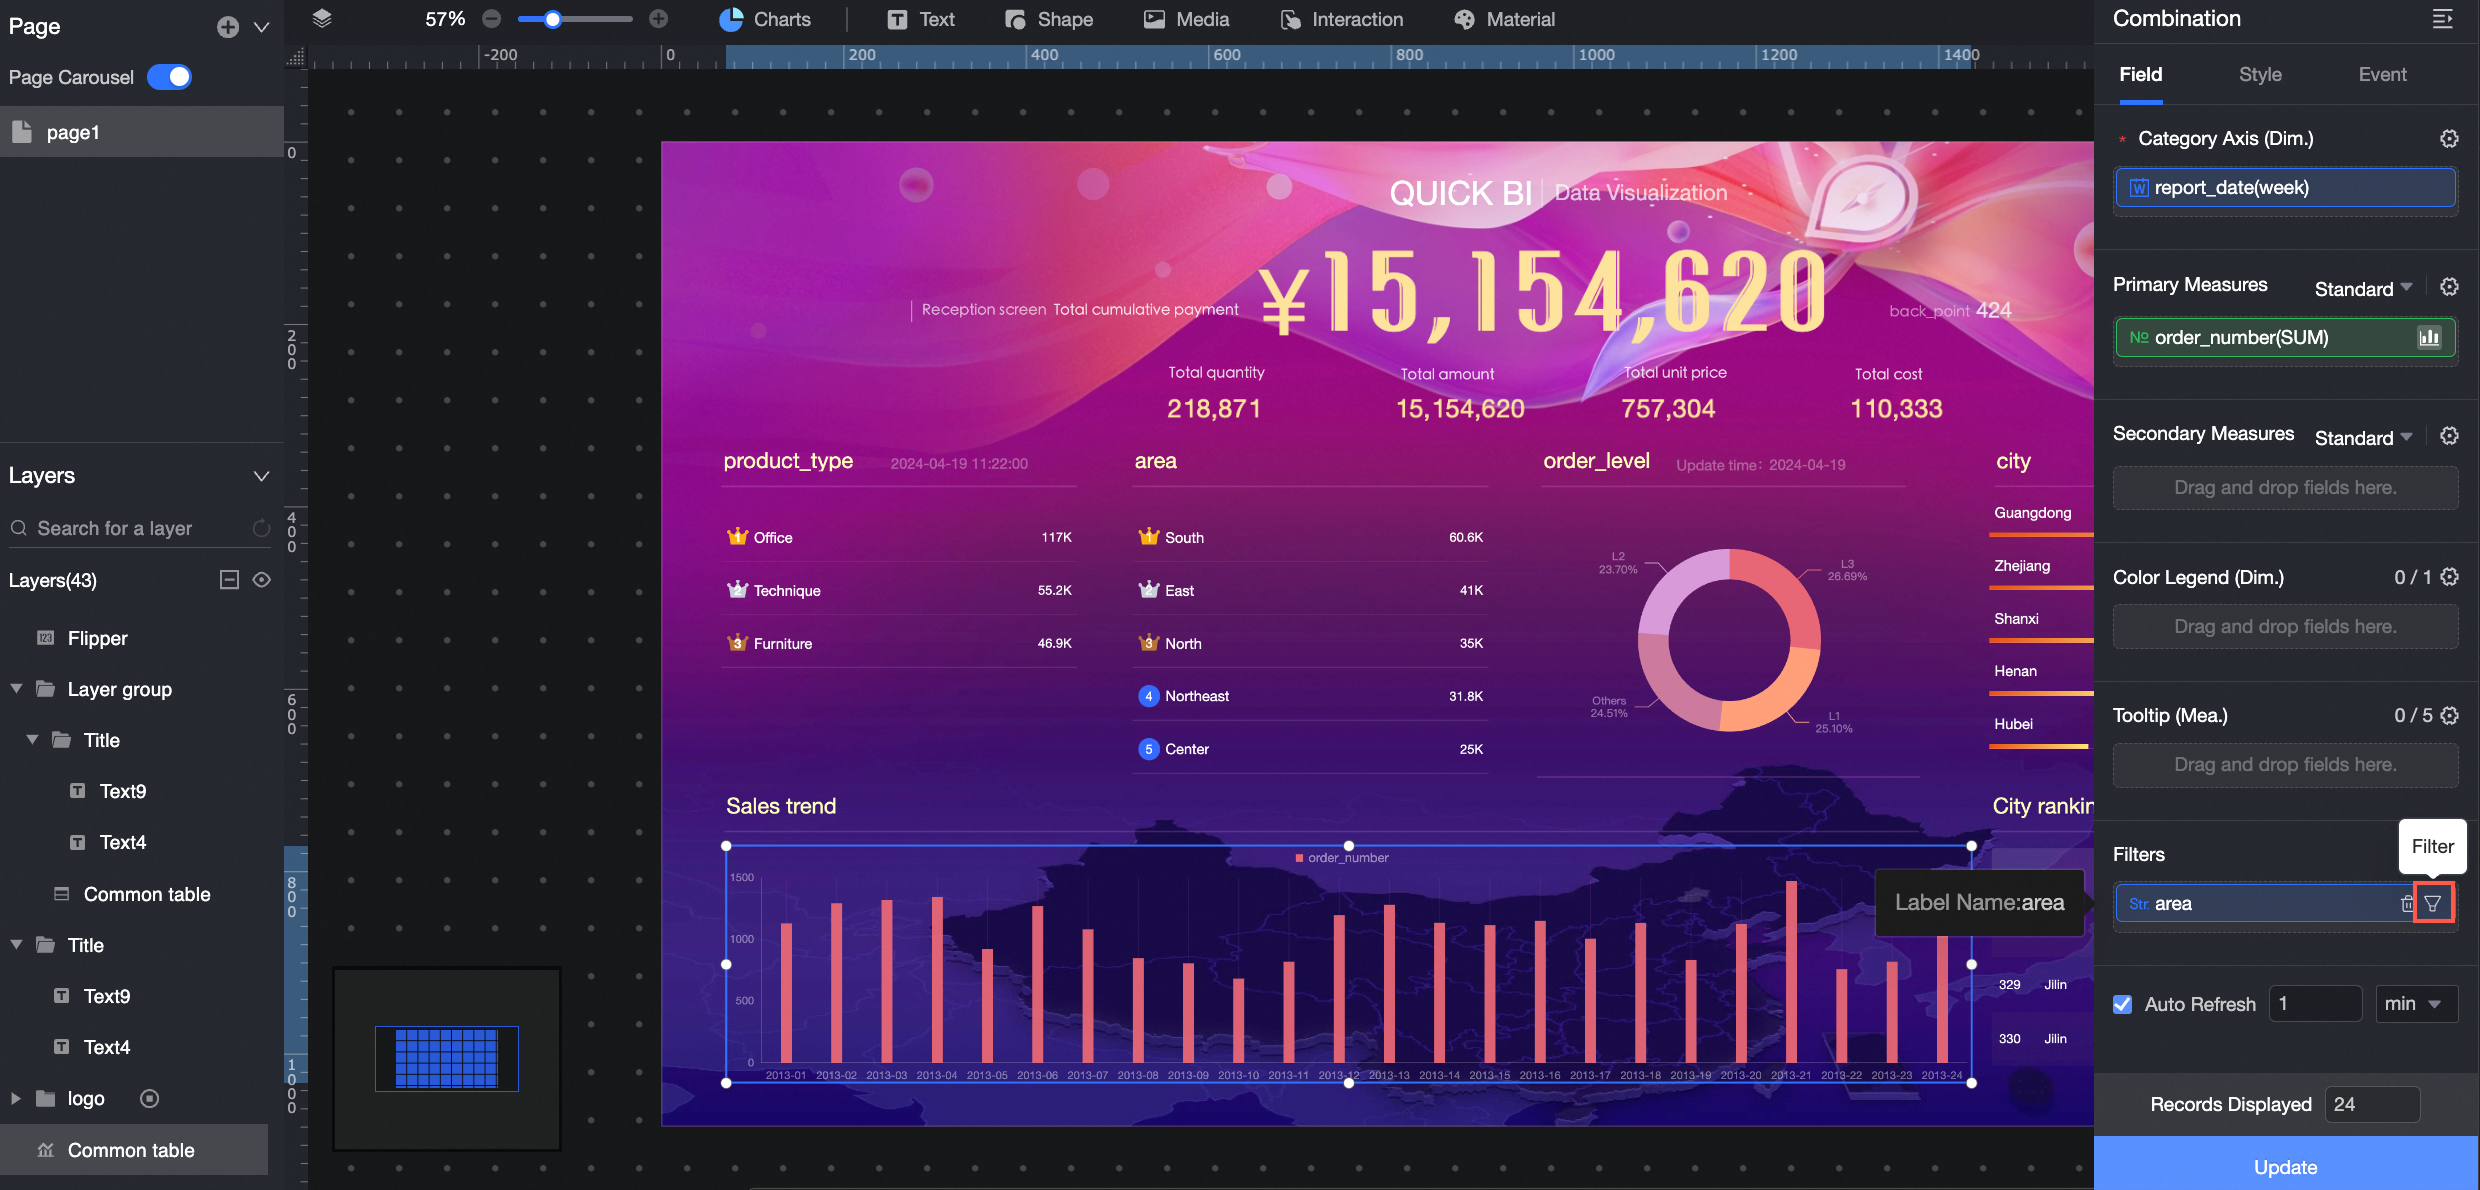
Configure the filter as needed.
Parameter
Description
Example
Filter method
Supports Filter by Condition and Filter by Enumeration.
Filter by Enumeration
Condition type
Supports Single Condition, OR Condition, and AND Condition.
NoteThis option is available only when Filter method is set to Filter by Condition.
Not applicable
Query method
Supports Single Select and Multi-select.
NoteThis option is available only when Filter method is set to Filter by Enumeration.
Not applicable
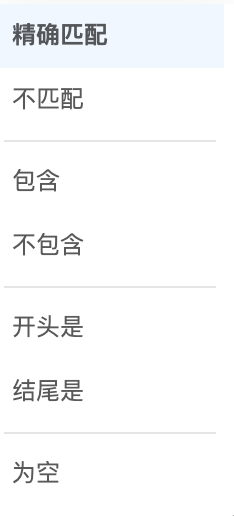
Filter condition
Set the filter conditions as needed.
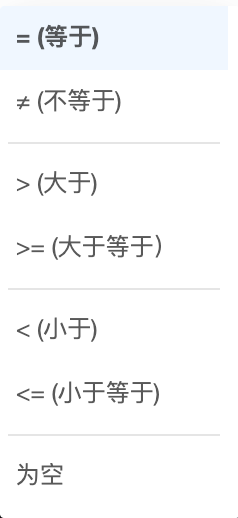
Dimension field:

Measure field:
Shanghai, Tianjin, Beijing, Chongqing
When setting filter conditions, you can click Quick Input to manually enter field names.
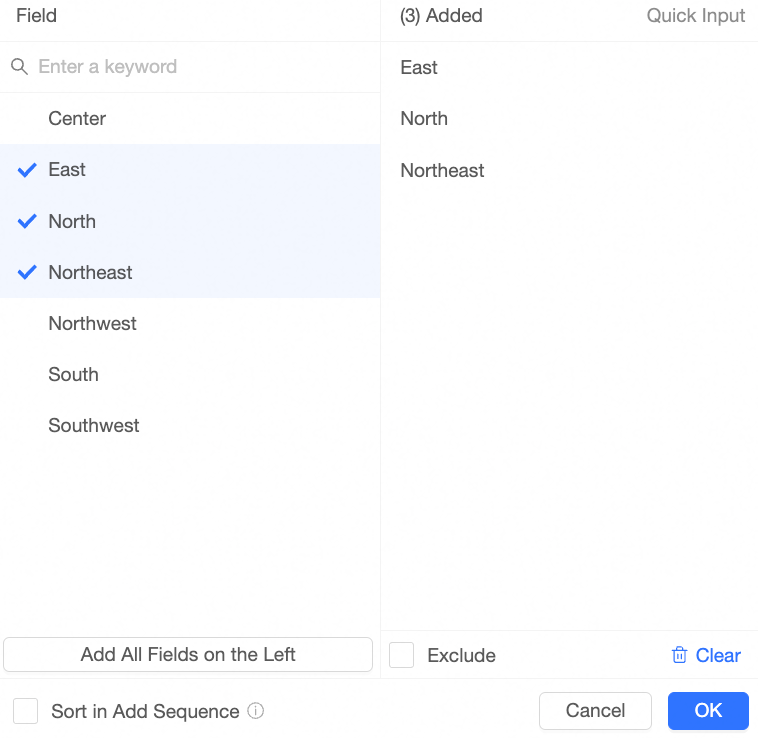
Alternatively, add the required field values from the list, as shown in the following figure.
The Field dialog box provides the following options:
Enter a keyword in the search box and click the keyword below to add the target field values from the left pane to the Added list on the right.
Click Add All Field Values from the Left to move all listed field values to the Added list.
Select the checkboxes next to the field values on the left to add them to the Added list on the right.
Click Exclude to exclude the field values in the Added list on the right.
Click Clear to remove all values from the Added list.
After you finish the configuration, click OK.
Click Update to apply the filter and redraw the chart.
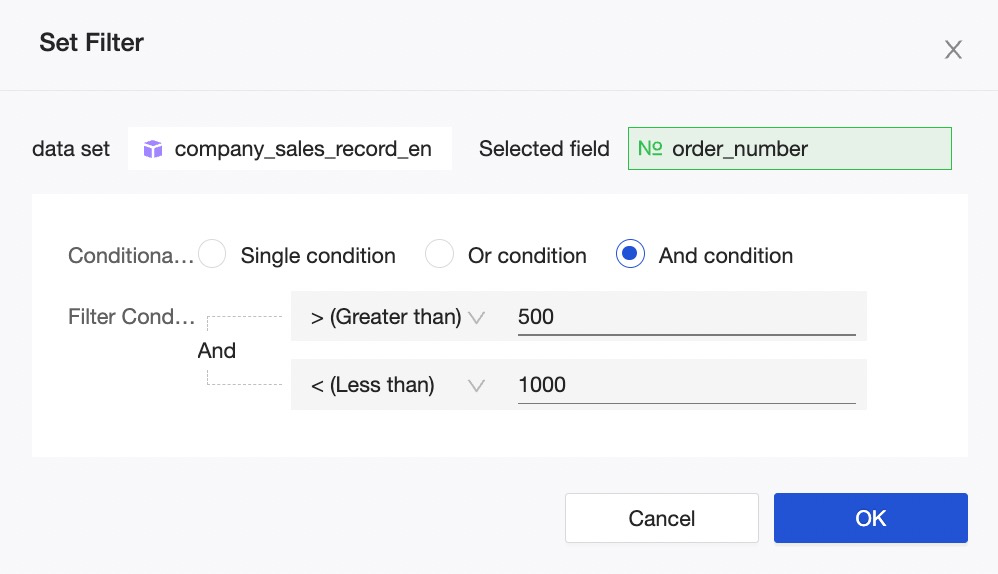
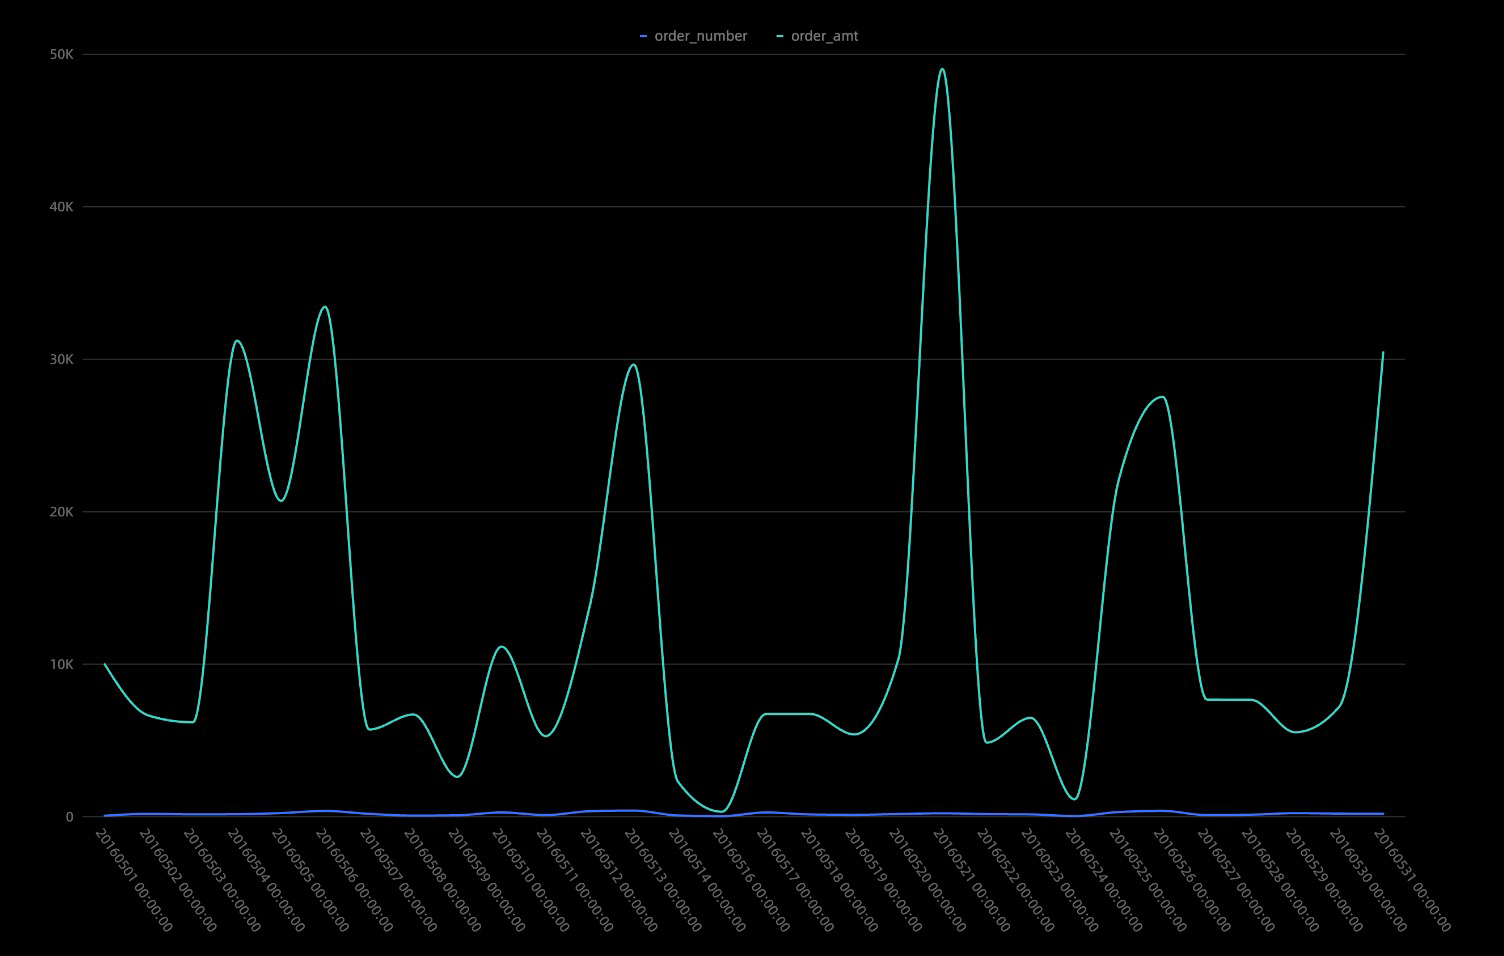
Numeric fields
You can set a filter range for numeric data. For example, you can set the order quantity range between 50,000 and 100,000. The chart then displays data within this range.
Example: Filter by order quantity
In the Filter pane, next to the Order Quantity field, click the
icon to set the filter range.Select a filter condition, such as greater than, less than, or equal to, as shown in the following figure.
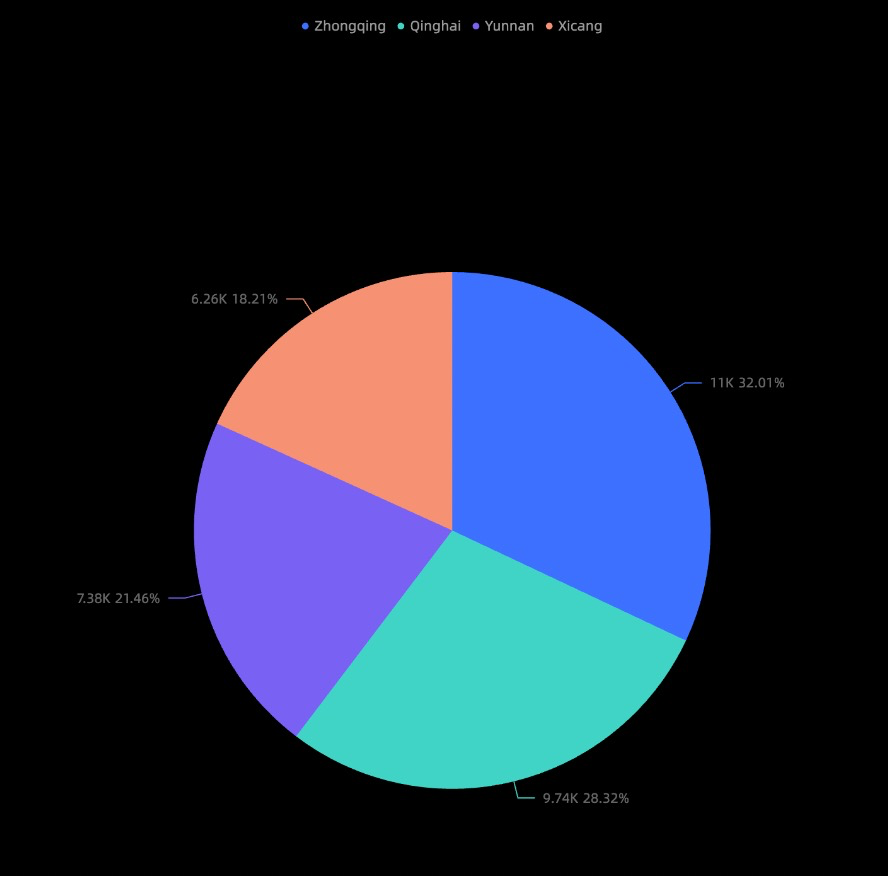
After you finish the configuration, click OK.
Click Update to apply the filter and redraw the chart.
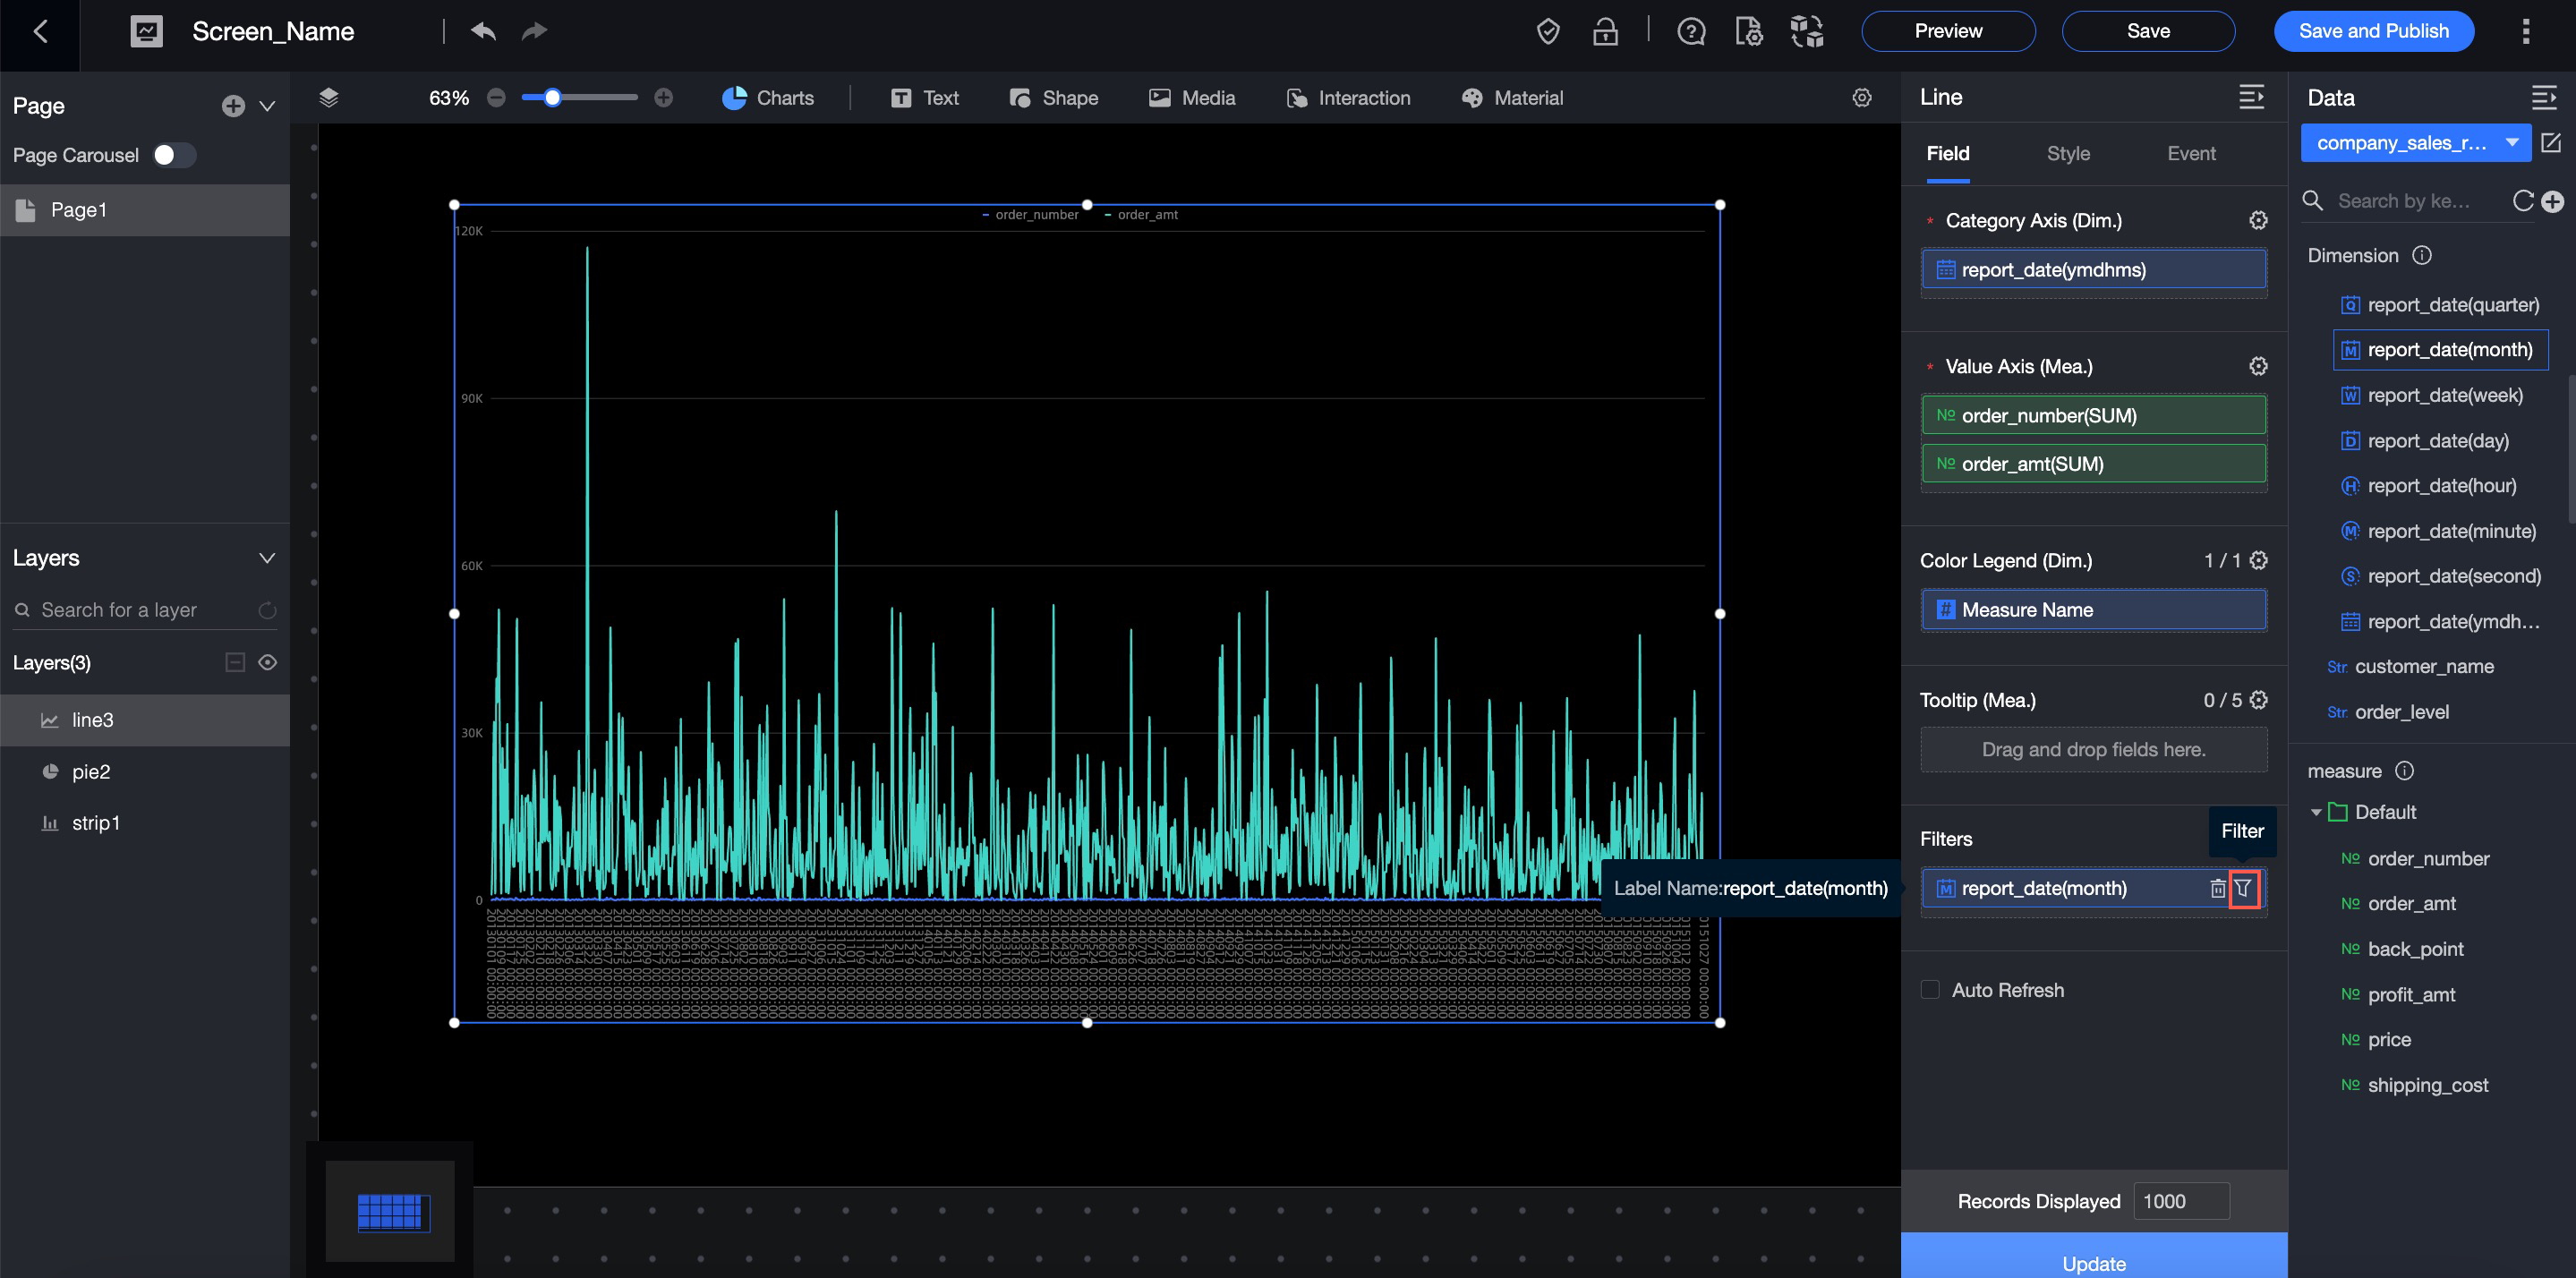
Date fields
You can set a filter to display data from a specific time period. For example, you can filter by order date to view the order quantity and profit from a specific period, such as February 2010.
Date values can be specified down to the second.
Example: Filter by Order Date (month)
In the Filter pane, next to the Order Date (month) field, click the
icon to set the filter range.Configure the filter as needed.
Parameter
Description
Example
Filter method
Supports Single Month and Month Range.
Single Month
Range type
Supports Starts From, Ends At, and Time Range.
NoteThis option is available only when Filter method is set to Month Range.
Not applicable
Filter condition
You can set a Relative Time or an Exact Time.
Exact Time
After you finish the configuration, click OK.
Click Update to apply the filter and redraw the chart.
Refresh data on a schedule
When Auto-refresh is enabled, the chart data updates automatically. For example, if you set the refresh interval to 5 minutes, the chart data updates automatically every 5 minutes.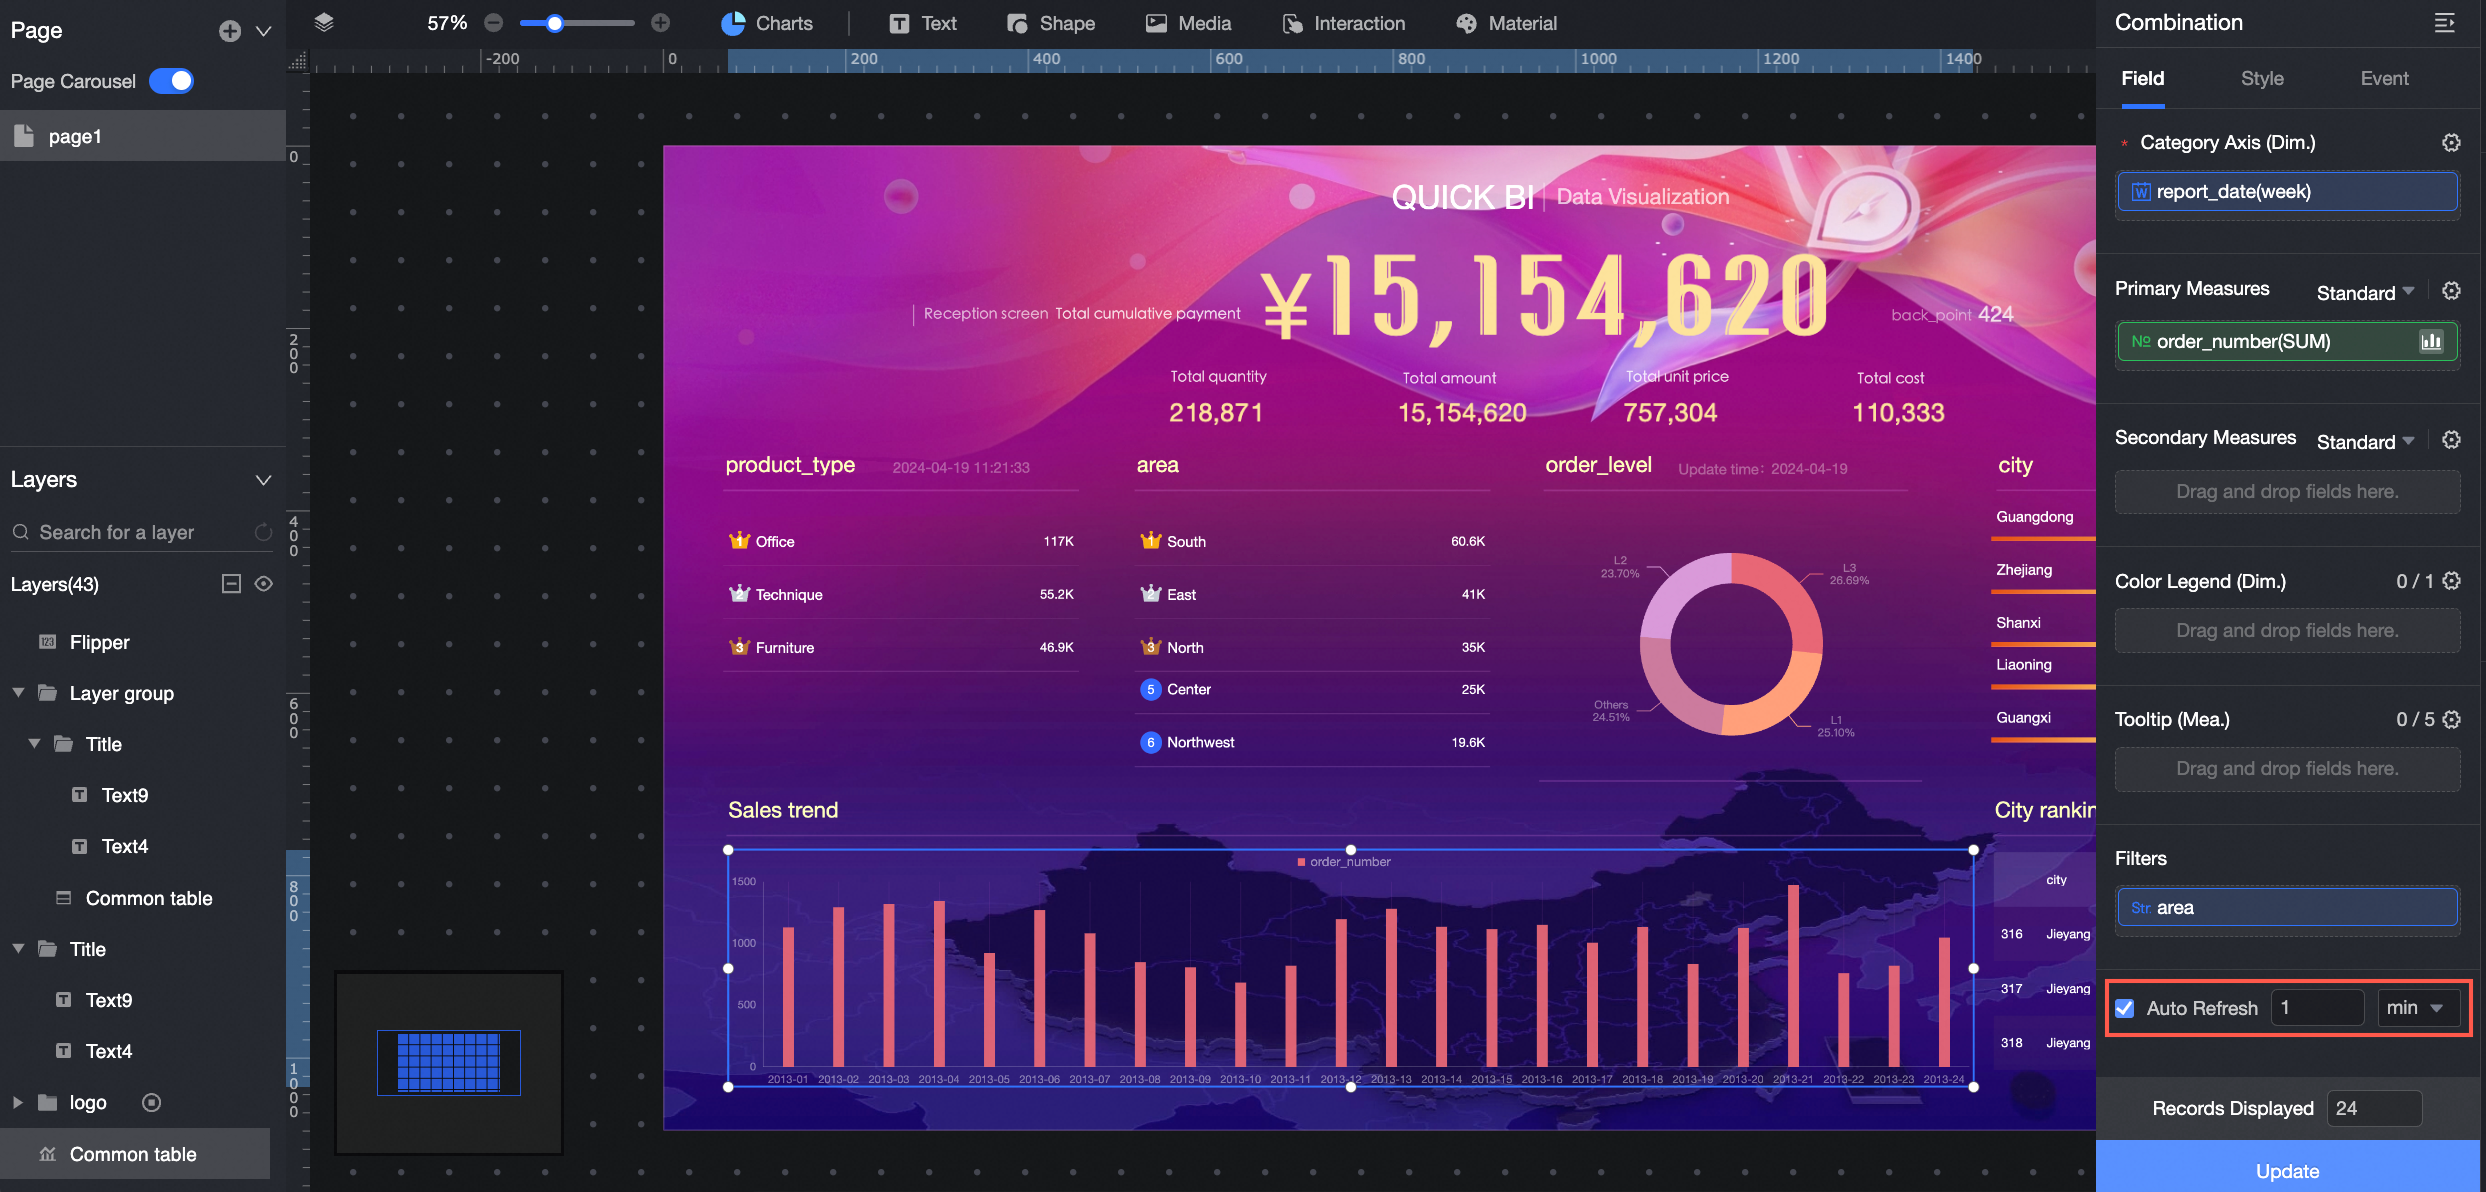
Set data display results
This setting controls the number of rows displayed in the data preview.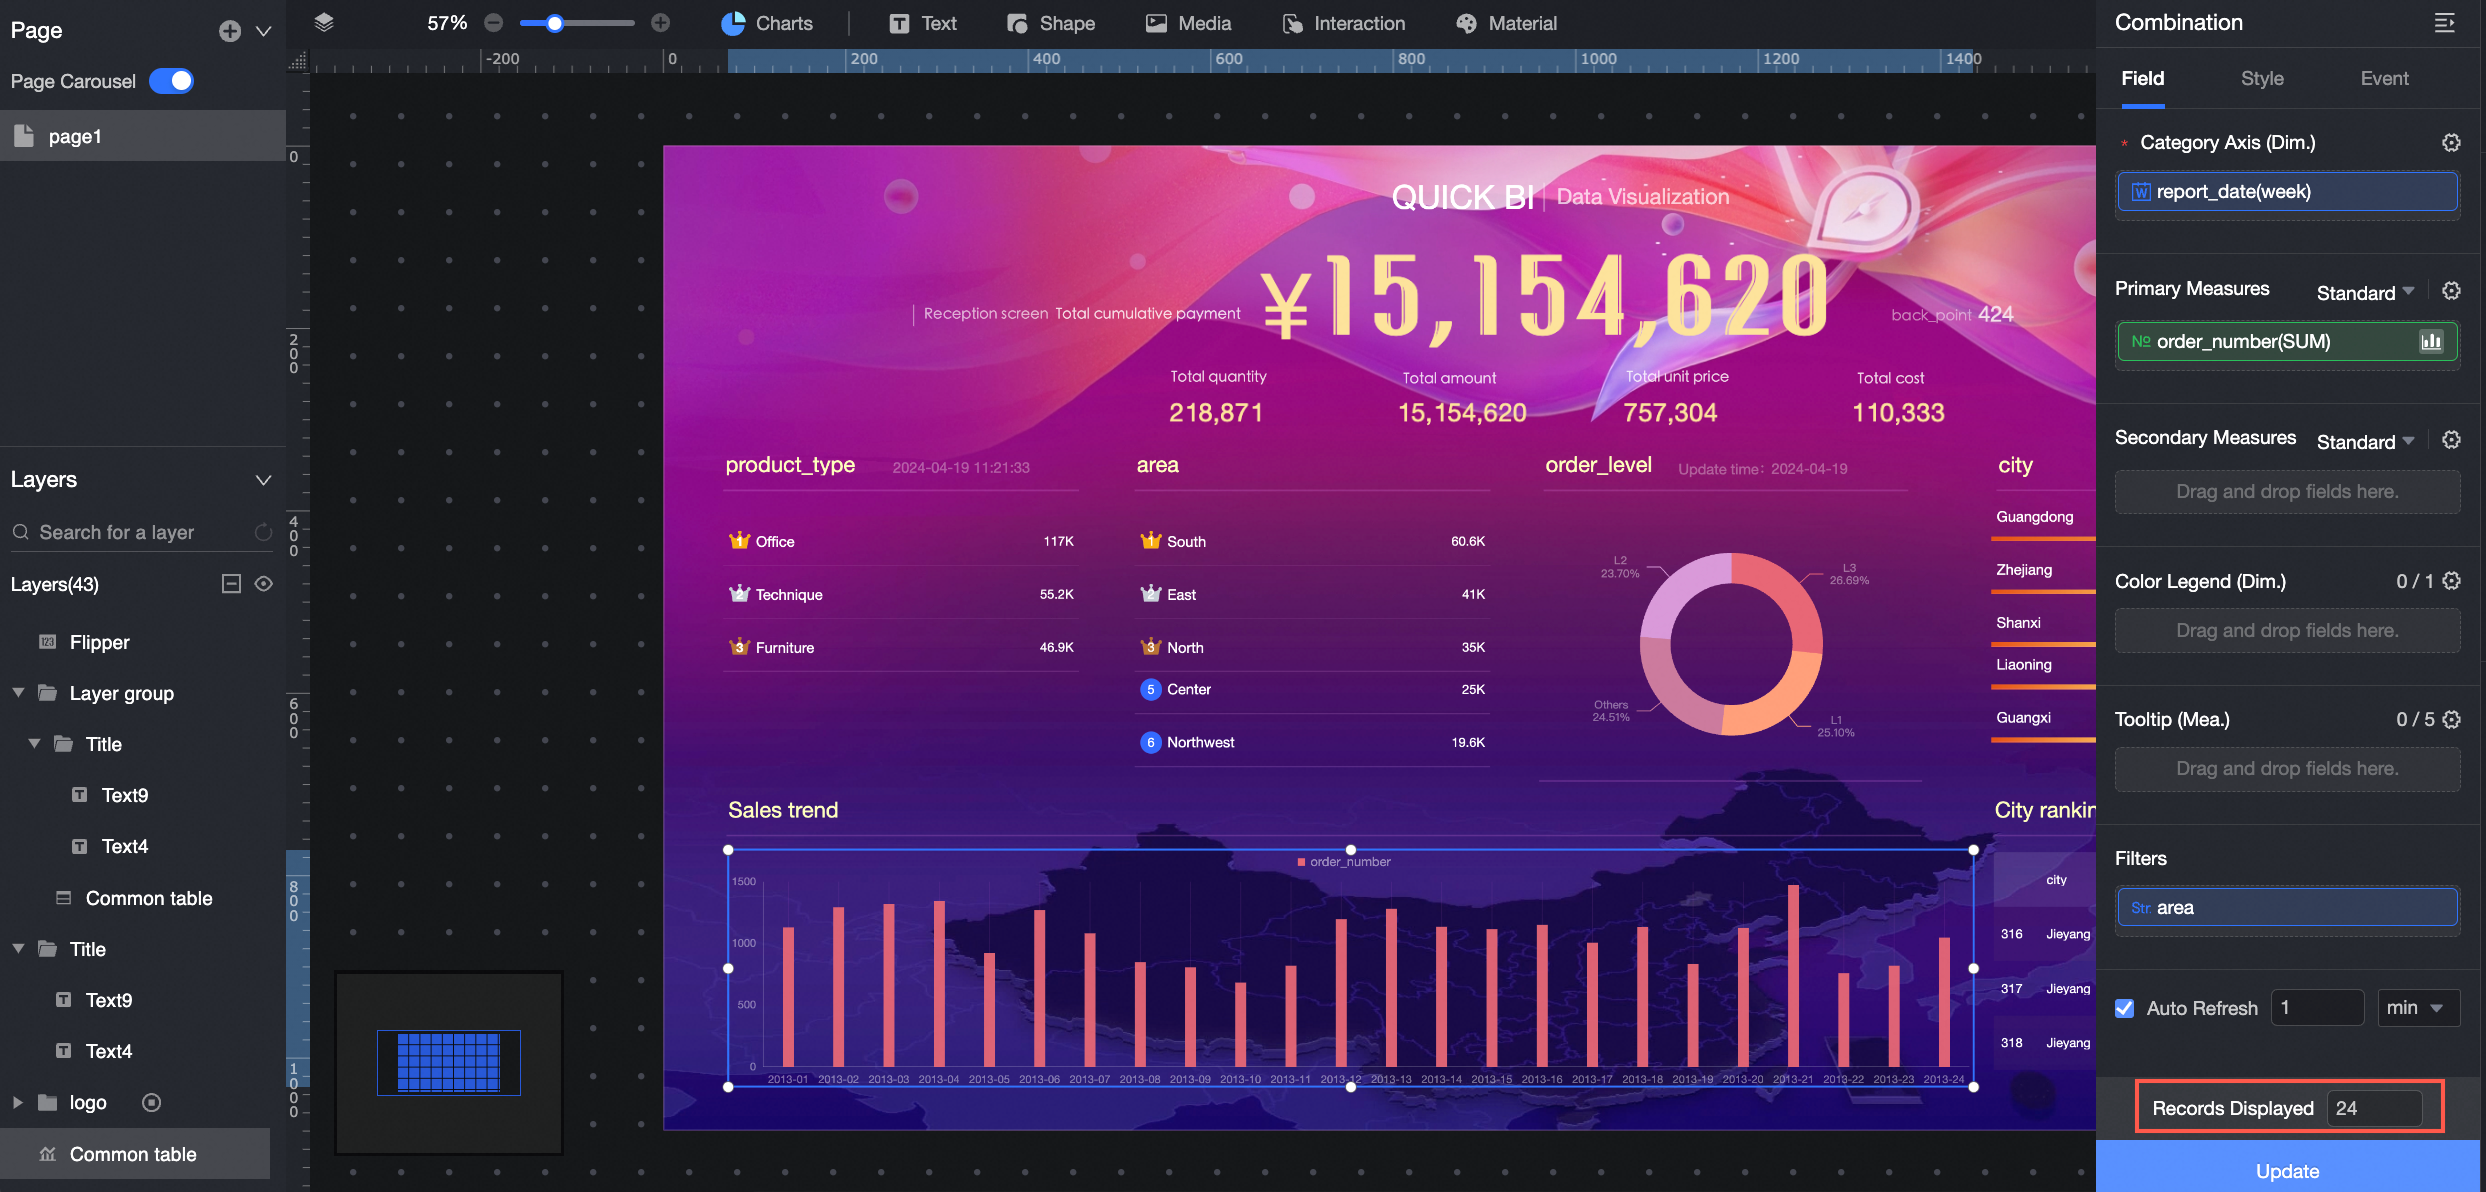
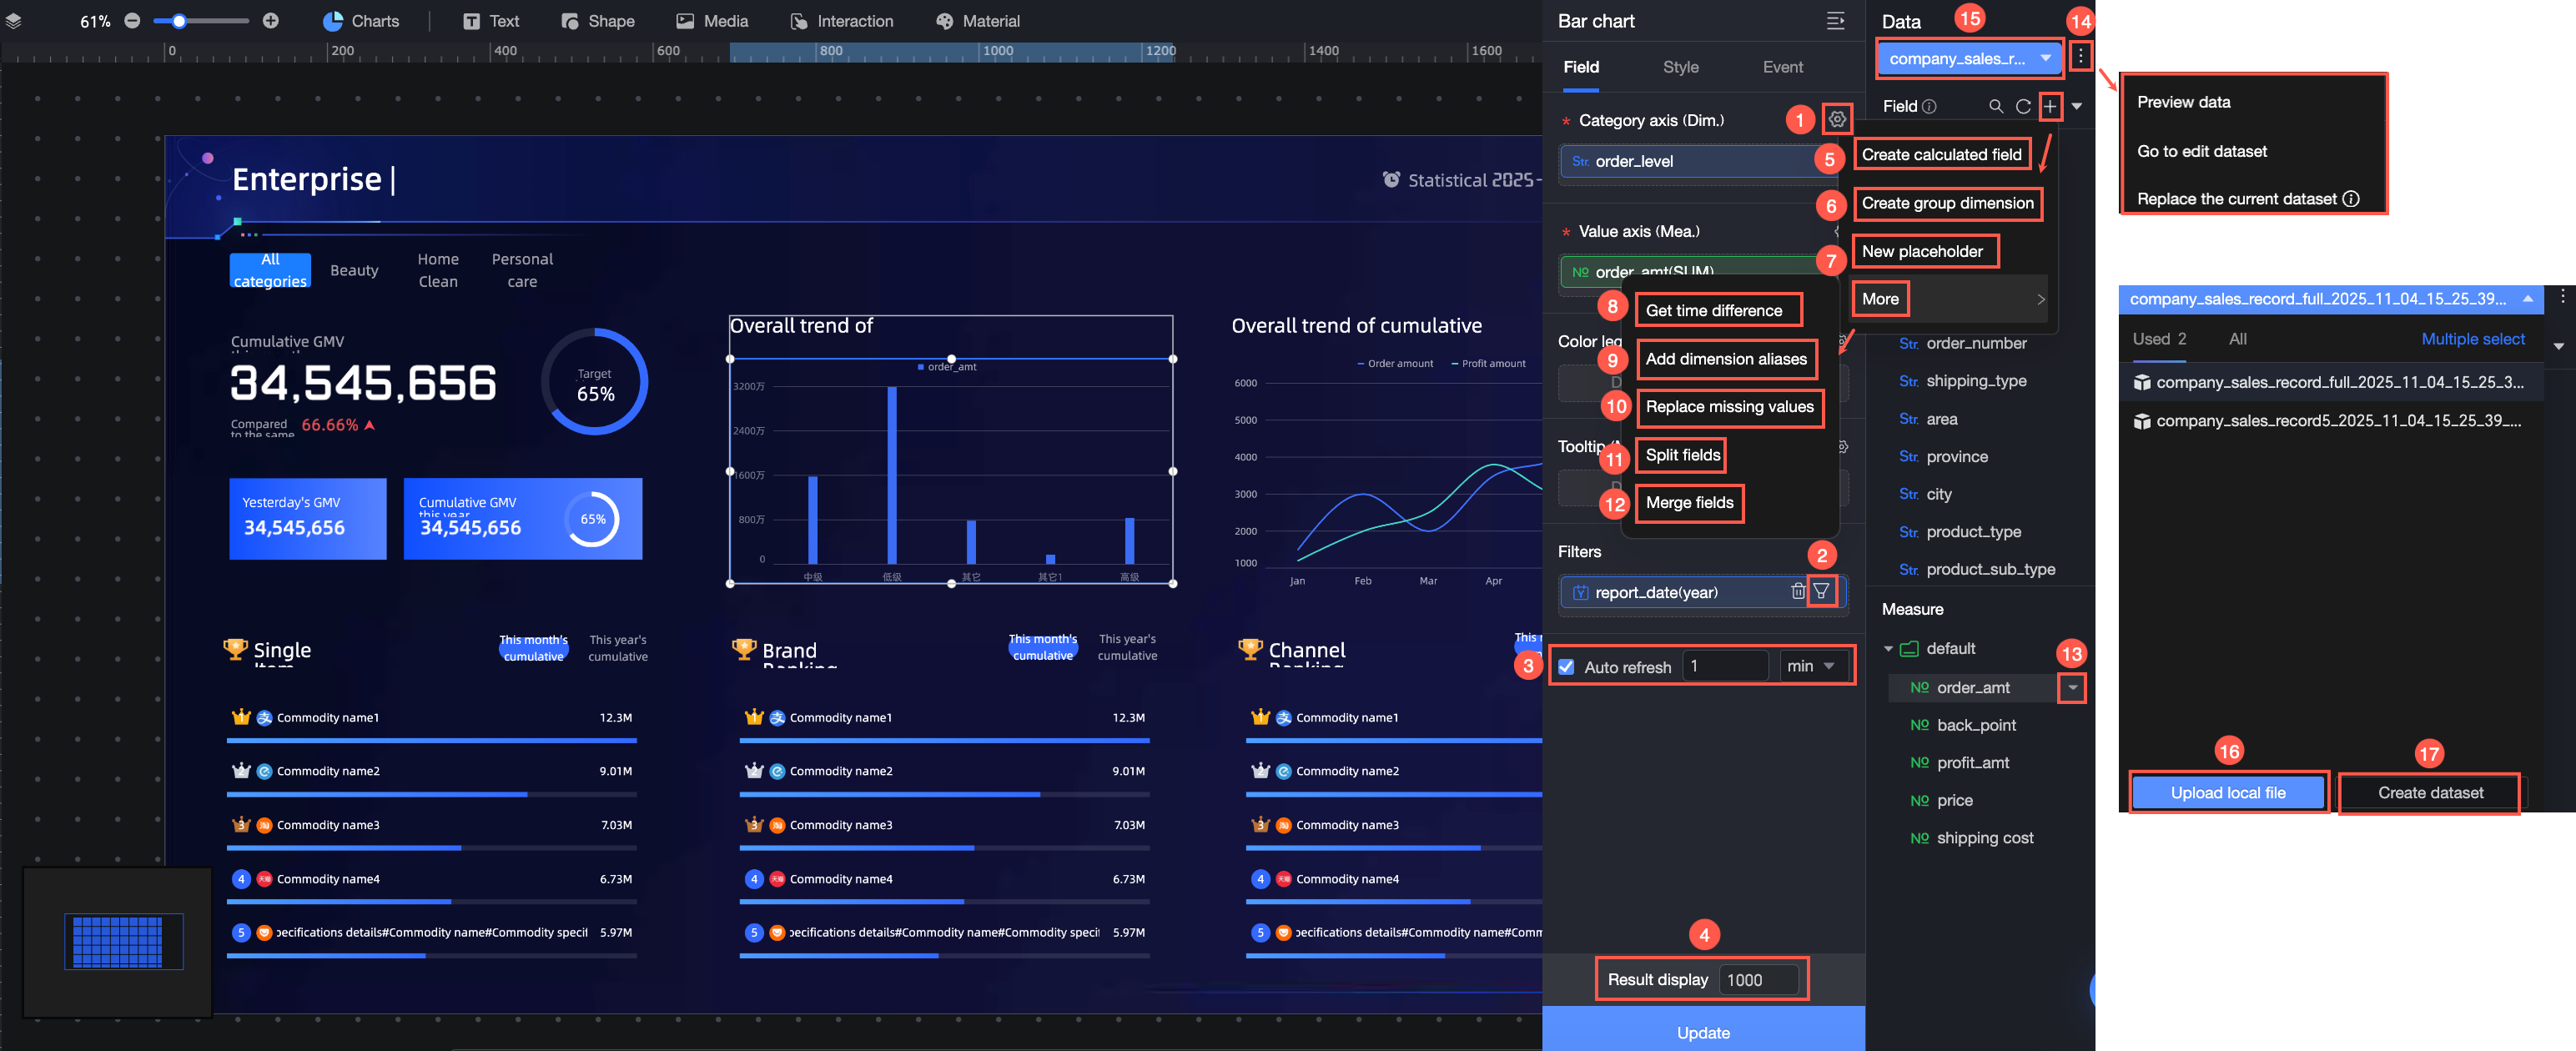
Create a calculated field
A calculated field applies only to the current chart and is not saved to the dataset.
It will not be available if you create a new chart, even one that uses the same dataset.
However, if you duplicate a chart, any calculated fields are also copied to the new chart.
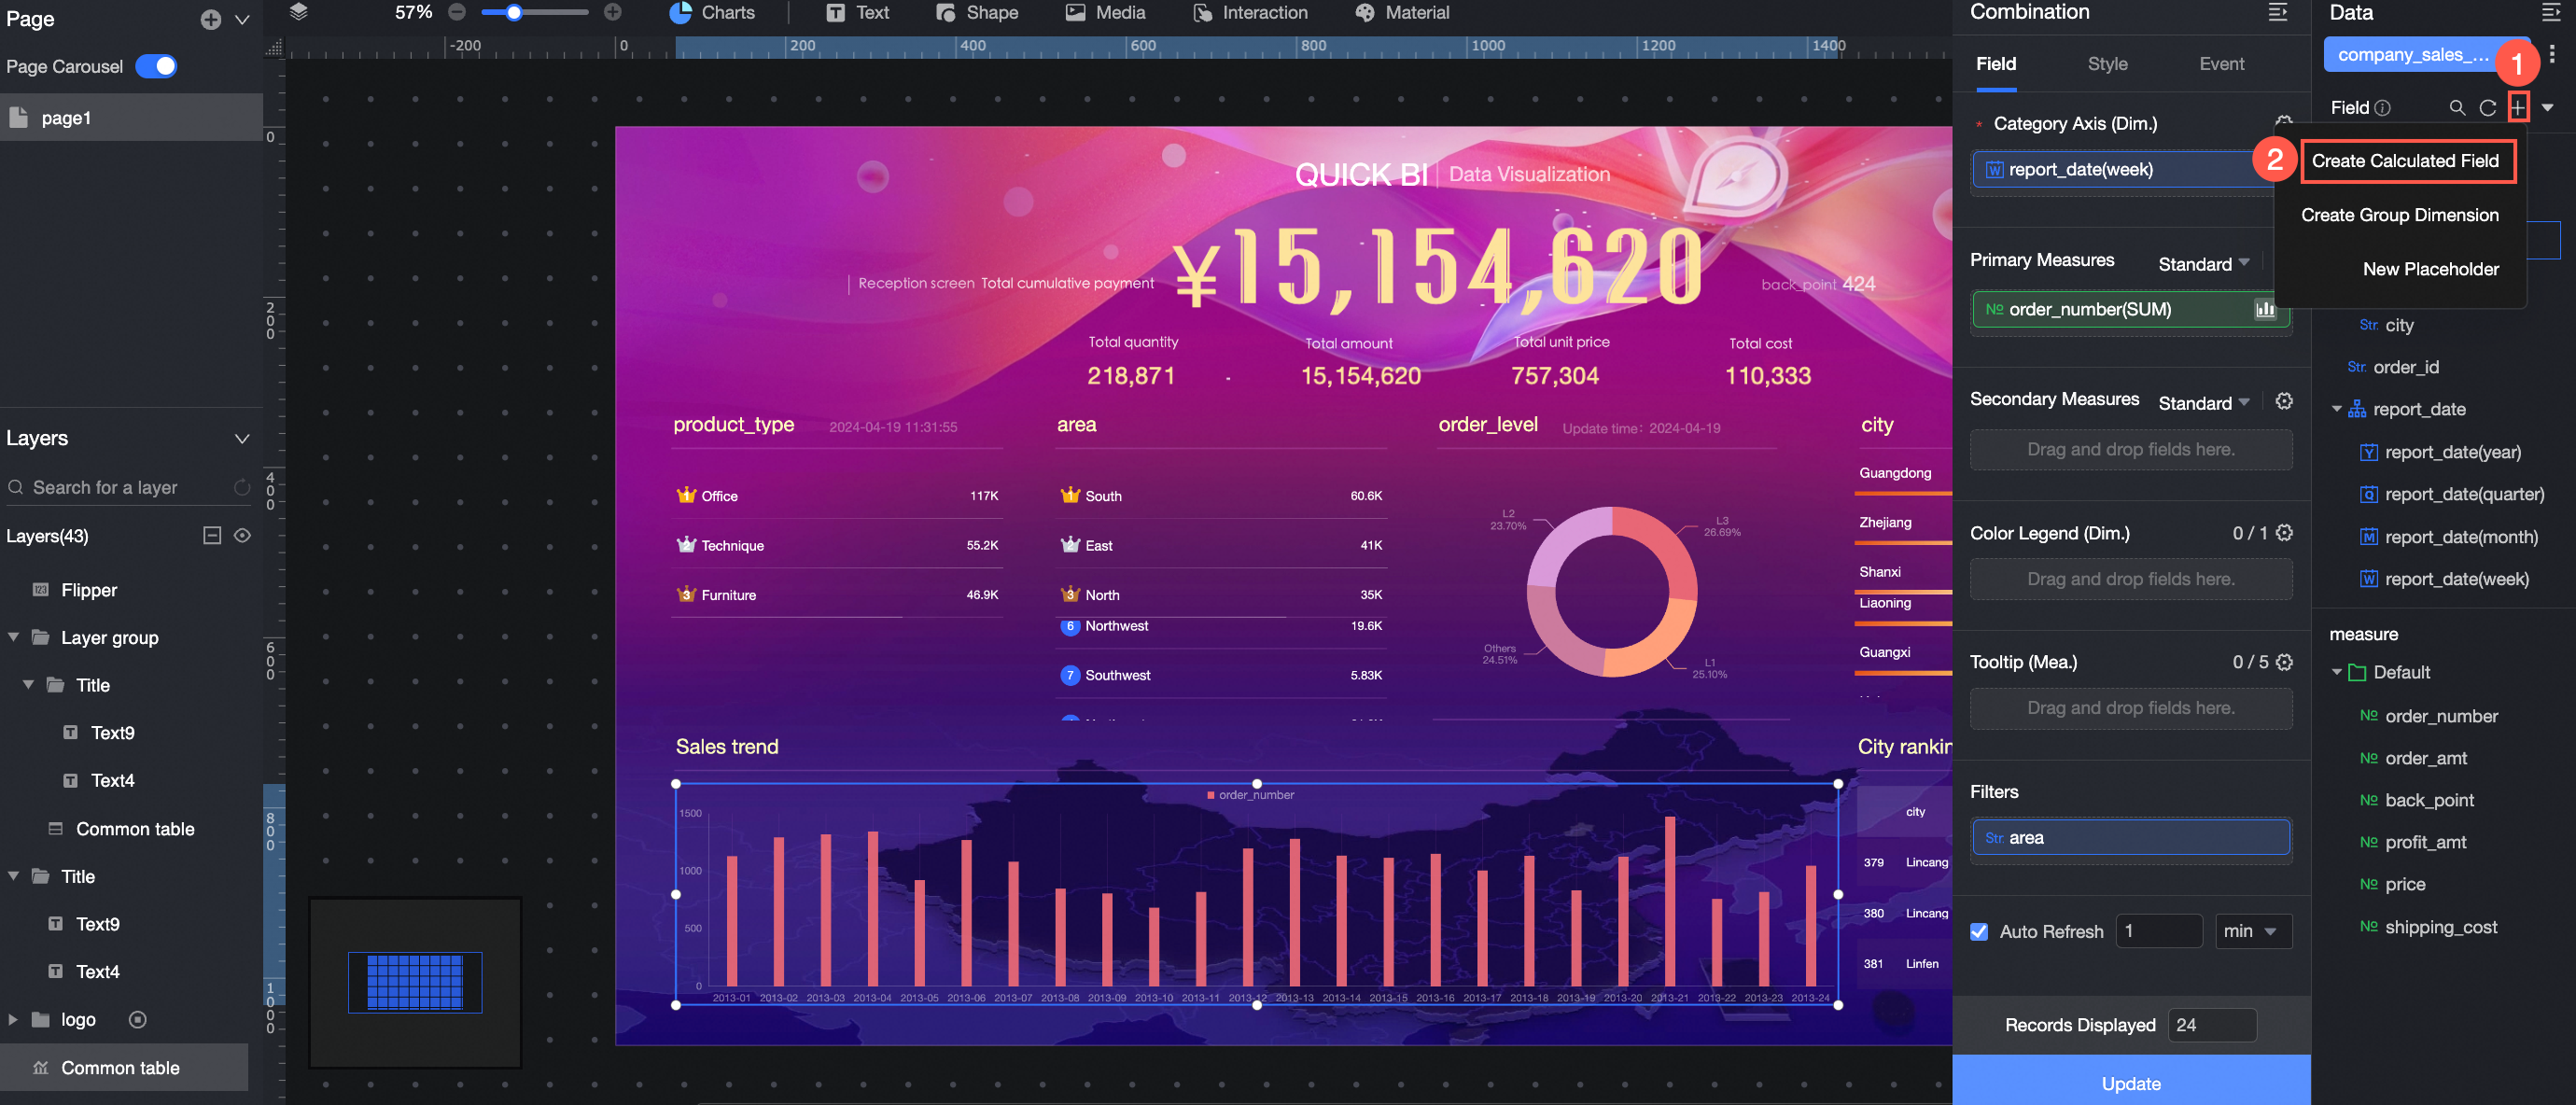
For more information, see Create a calculated field.
Create a group dimension
A group dimension applies only to the current chart and is not saved to the dataset.
It will not be available if you create a new chart, even one that uses the same dataset.
However, if you duplicate a chart, any group dimensions are also copied to the new chart.
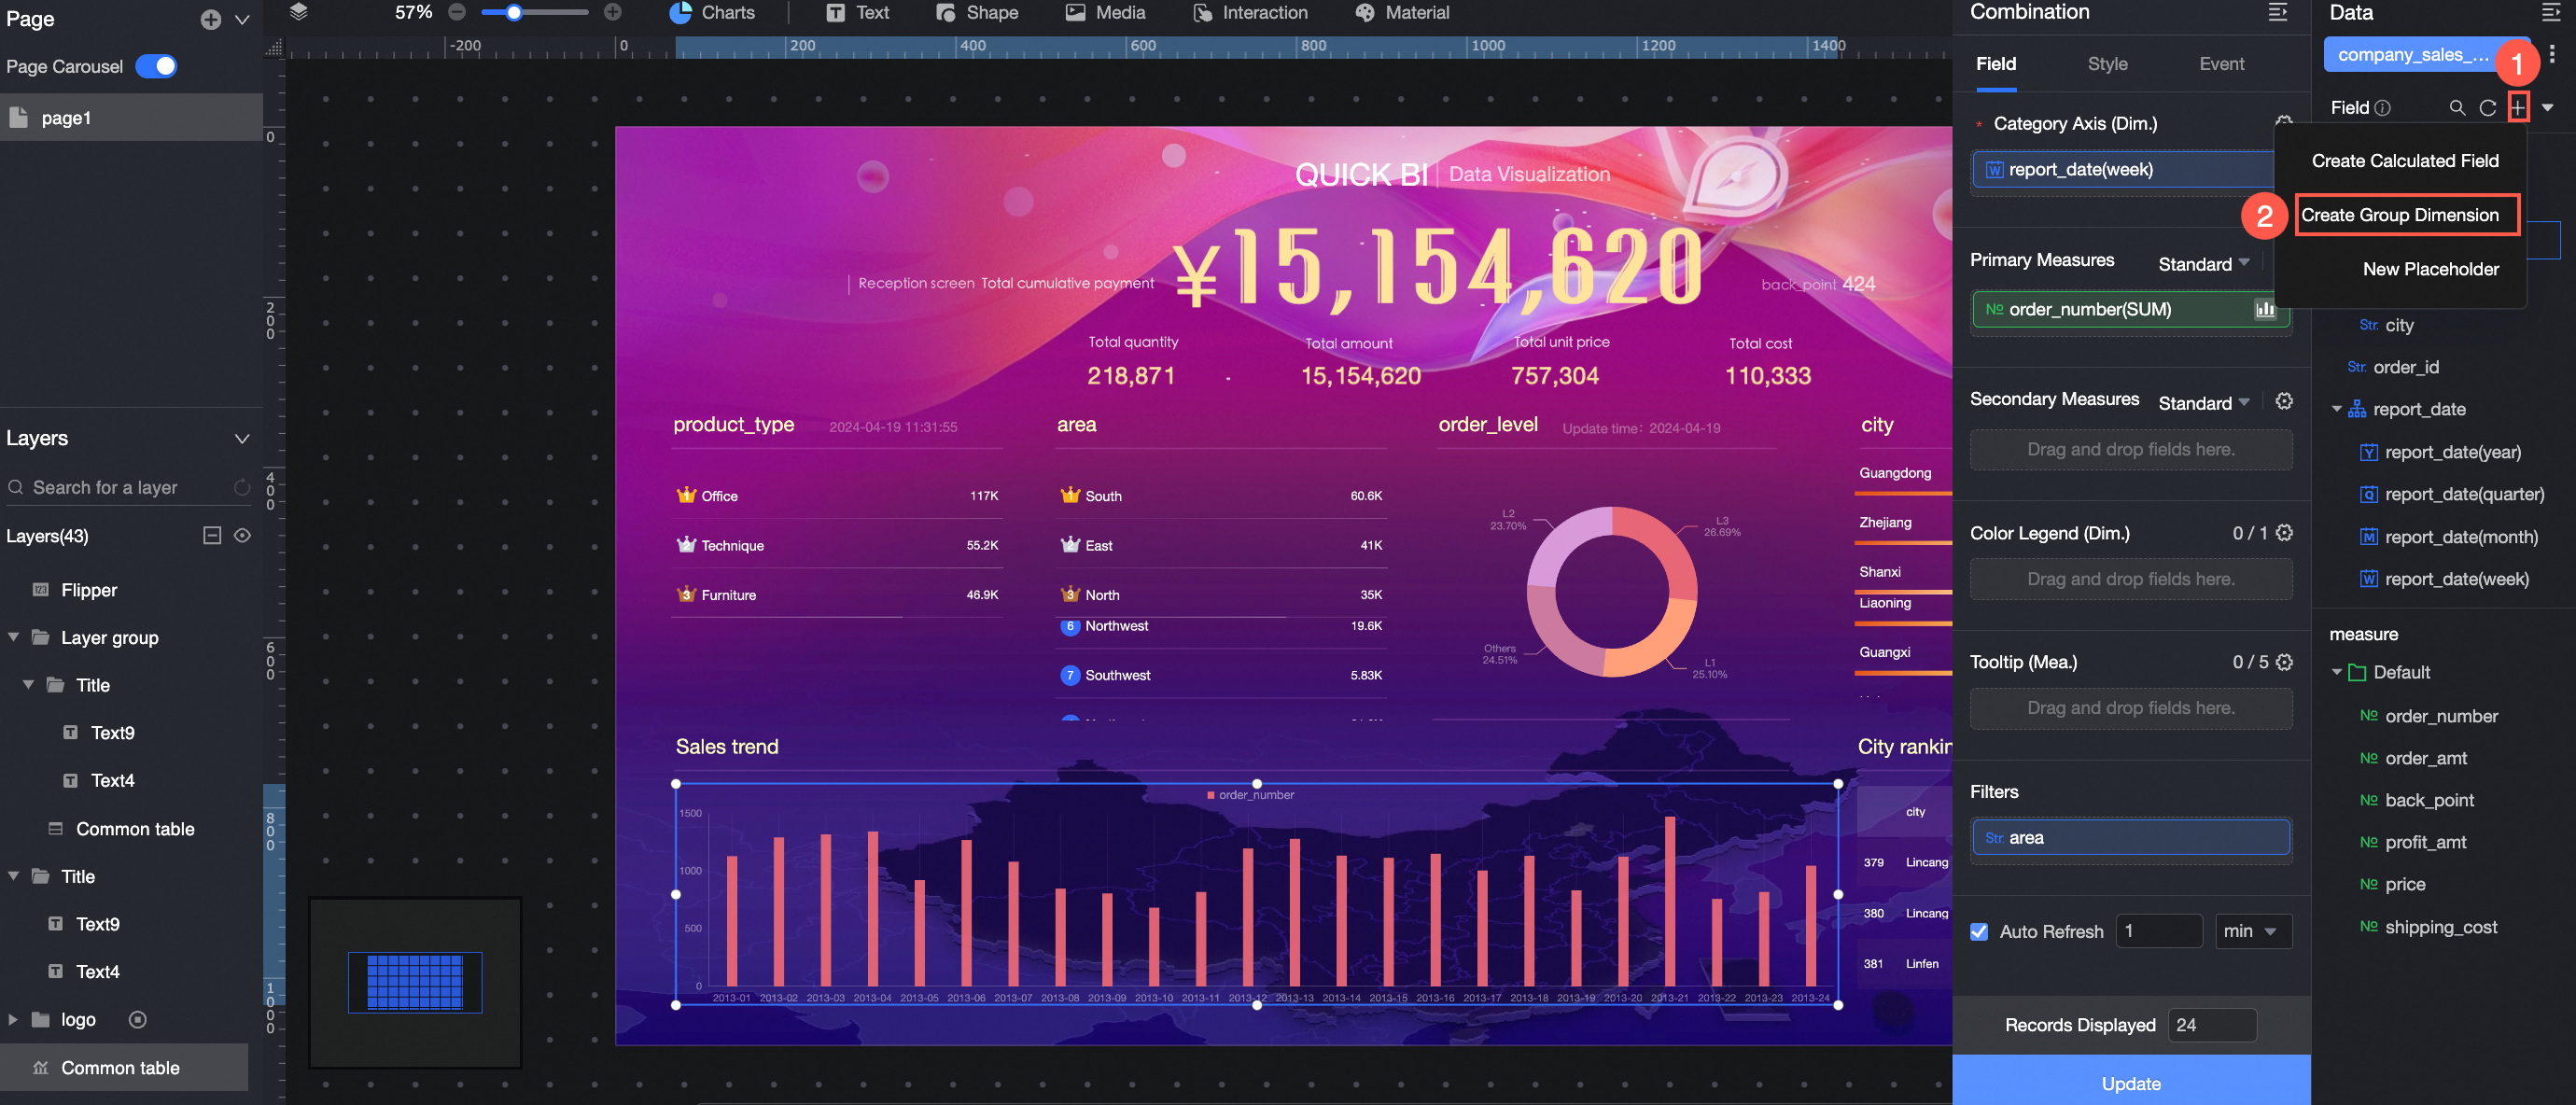
For more information, see Create a group dimension.
Create a placeholder
Click Create Placeholder to create a placeholder by manually entering a value.
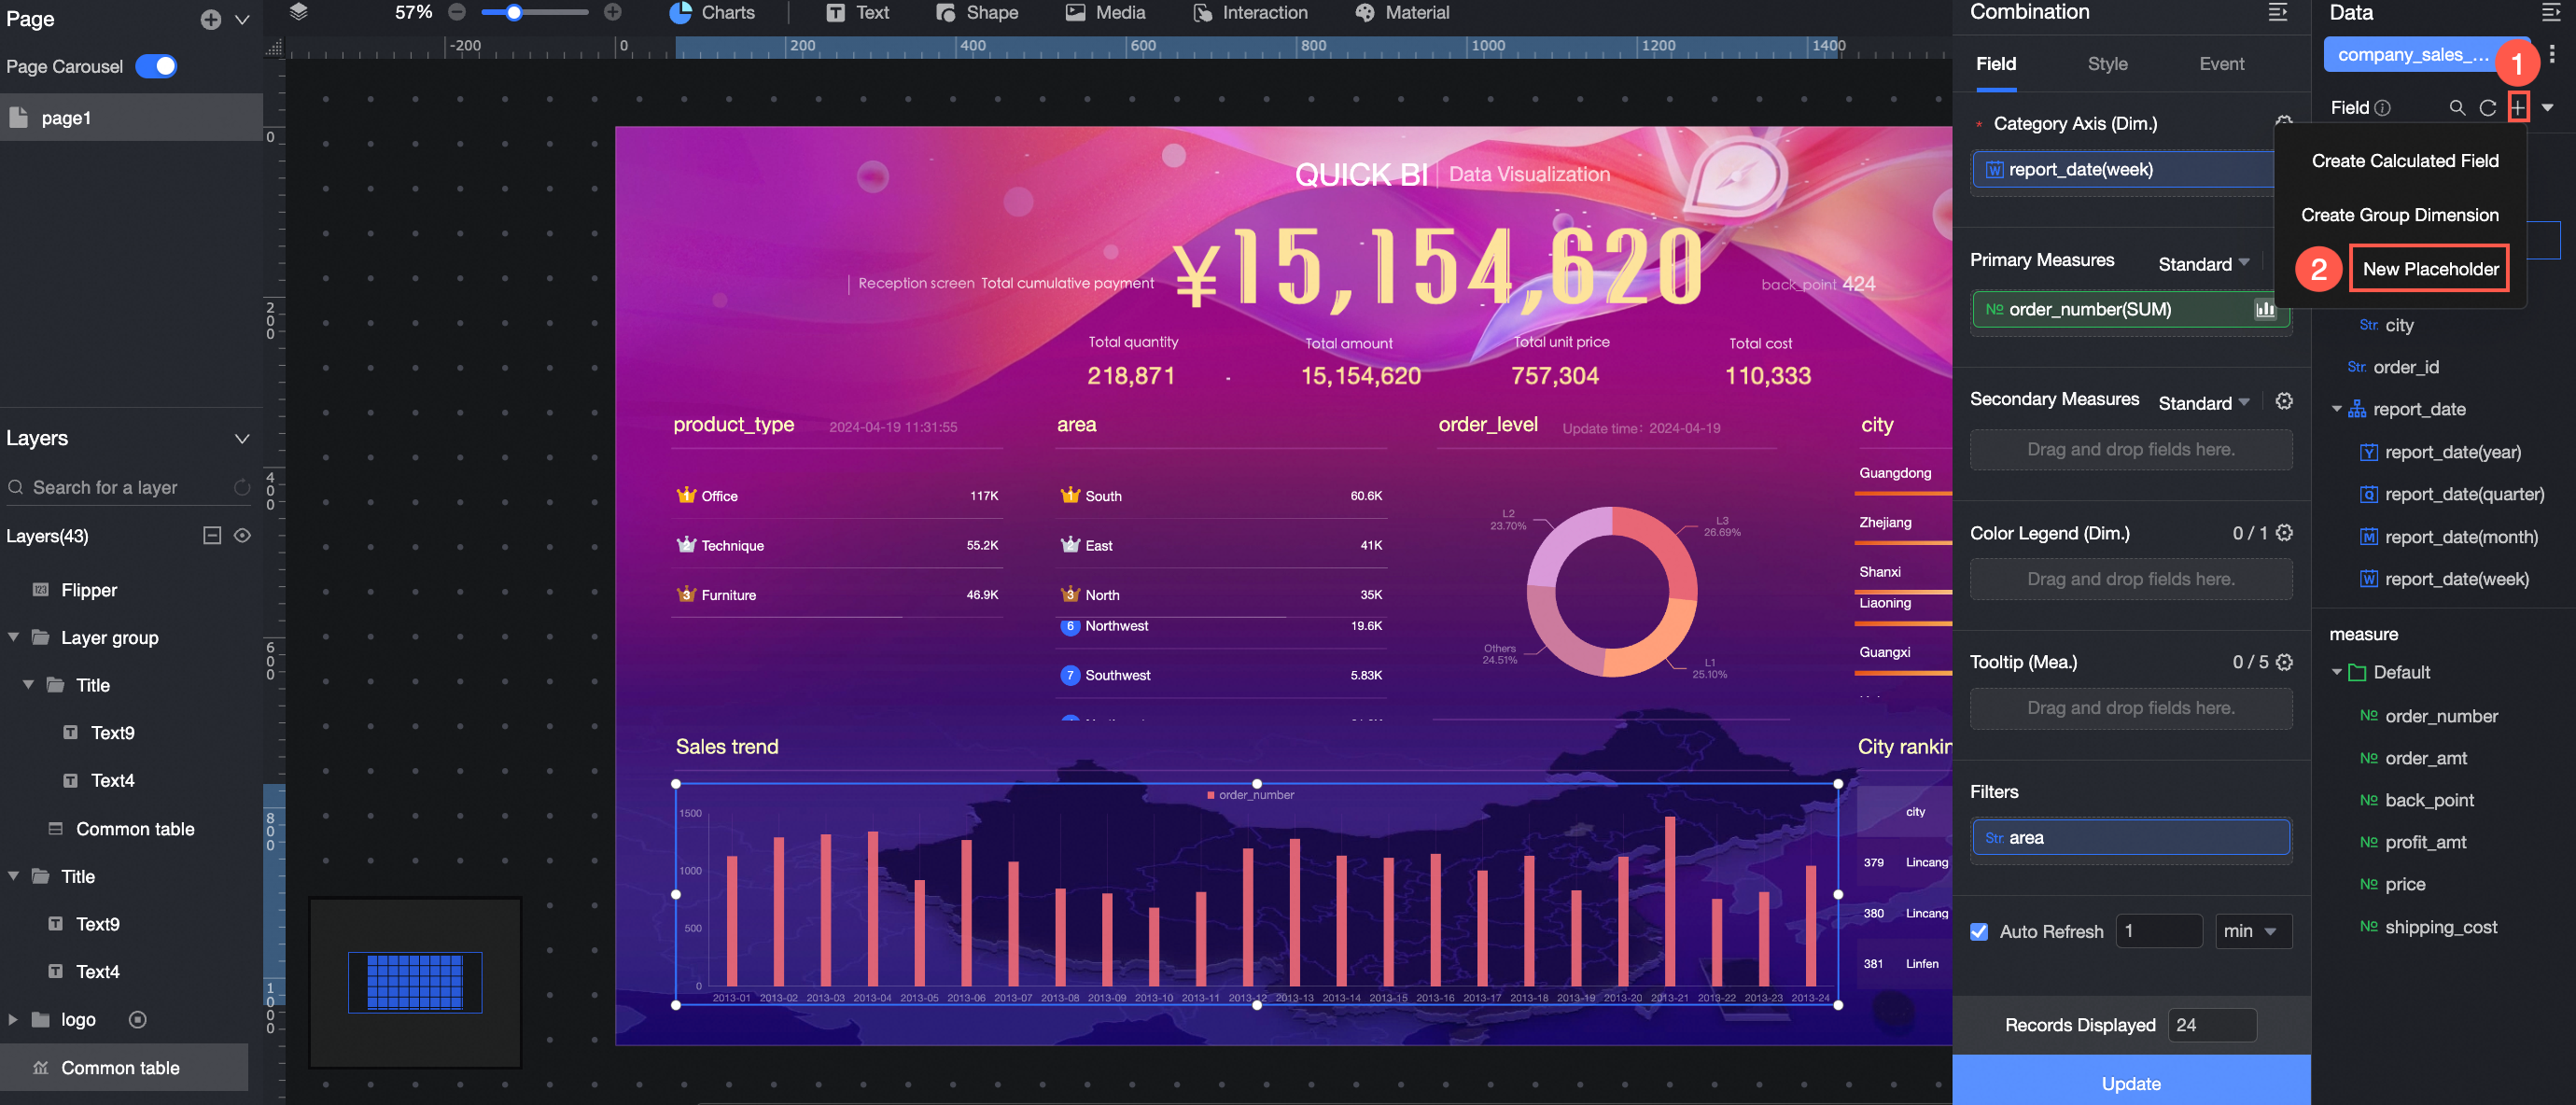
For more information, see Placeholders.
Get time difference
This feature calculates the time difference between two date fields, returning the result as a number. The calculation counts only complete time units.
Calculated fields are not supported.

For more information, see Get time difference.
Add a dimension value alias
Create a new alias for the values of a text field.
Only text fields support adding dimension value aliases.
This feature is limited to fields with 50 or fewer unique values.
Calculated fields are not supported.
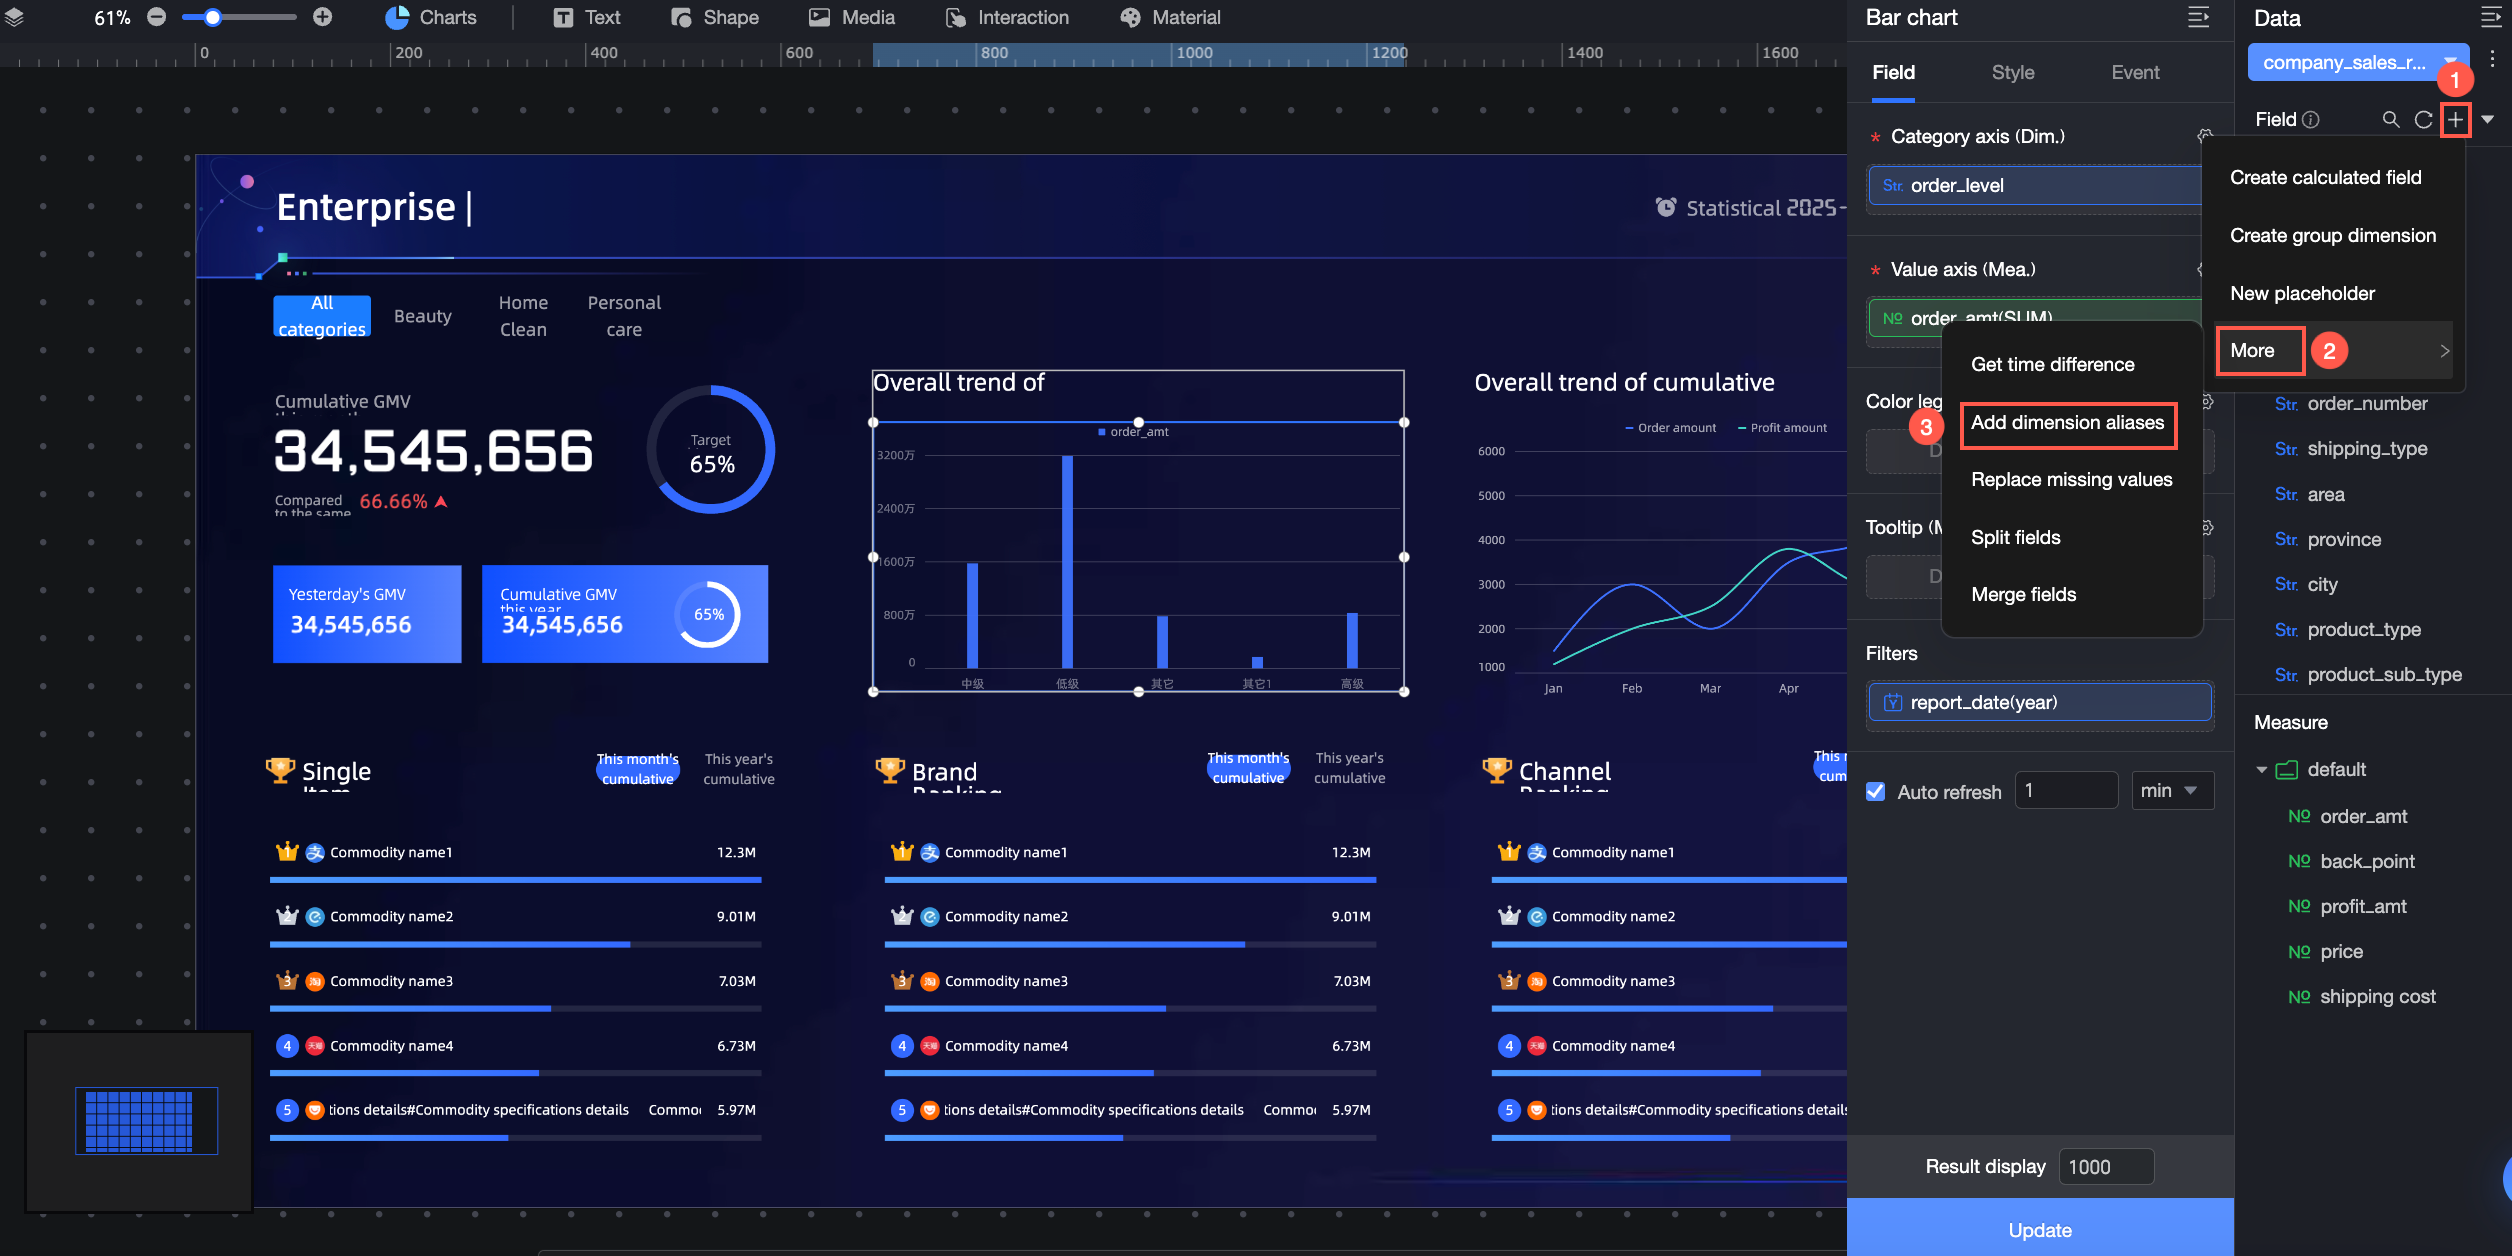
For more information, see Add a dimension value alias.
Replace missing values
Replace null values and empty strings with specified content.
Calculated fields are not supported.
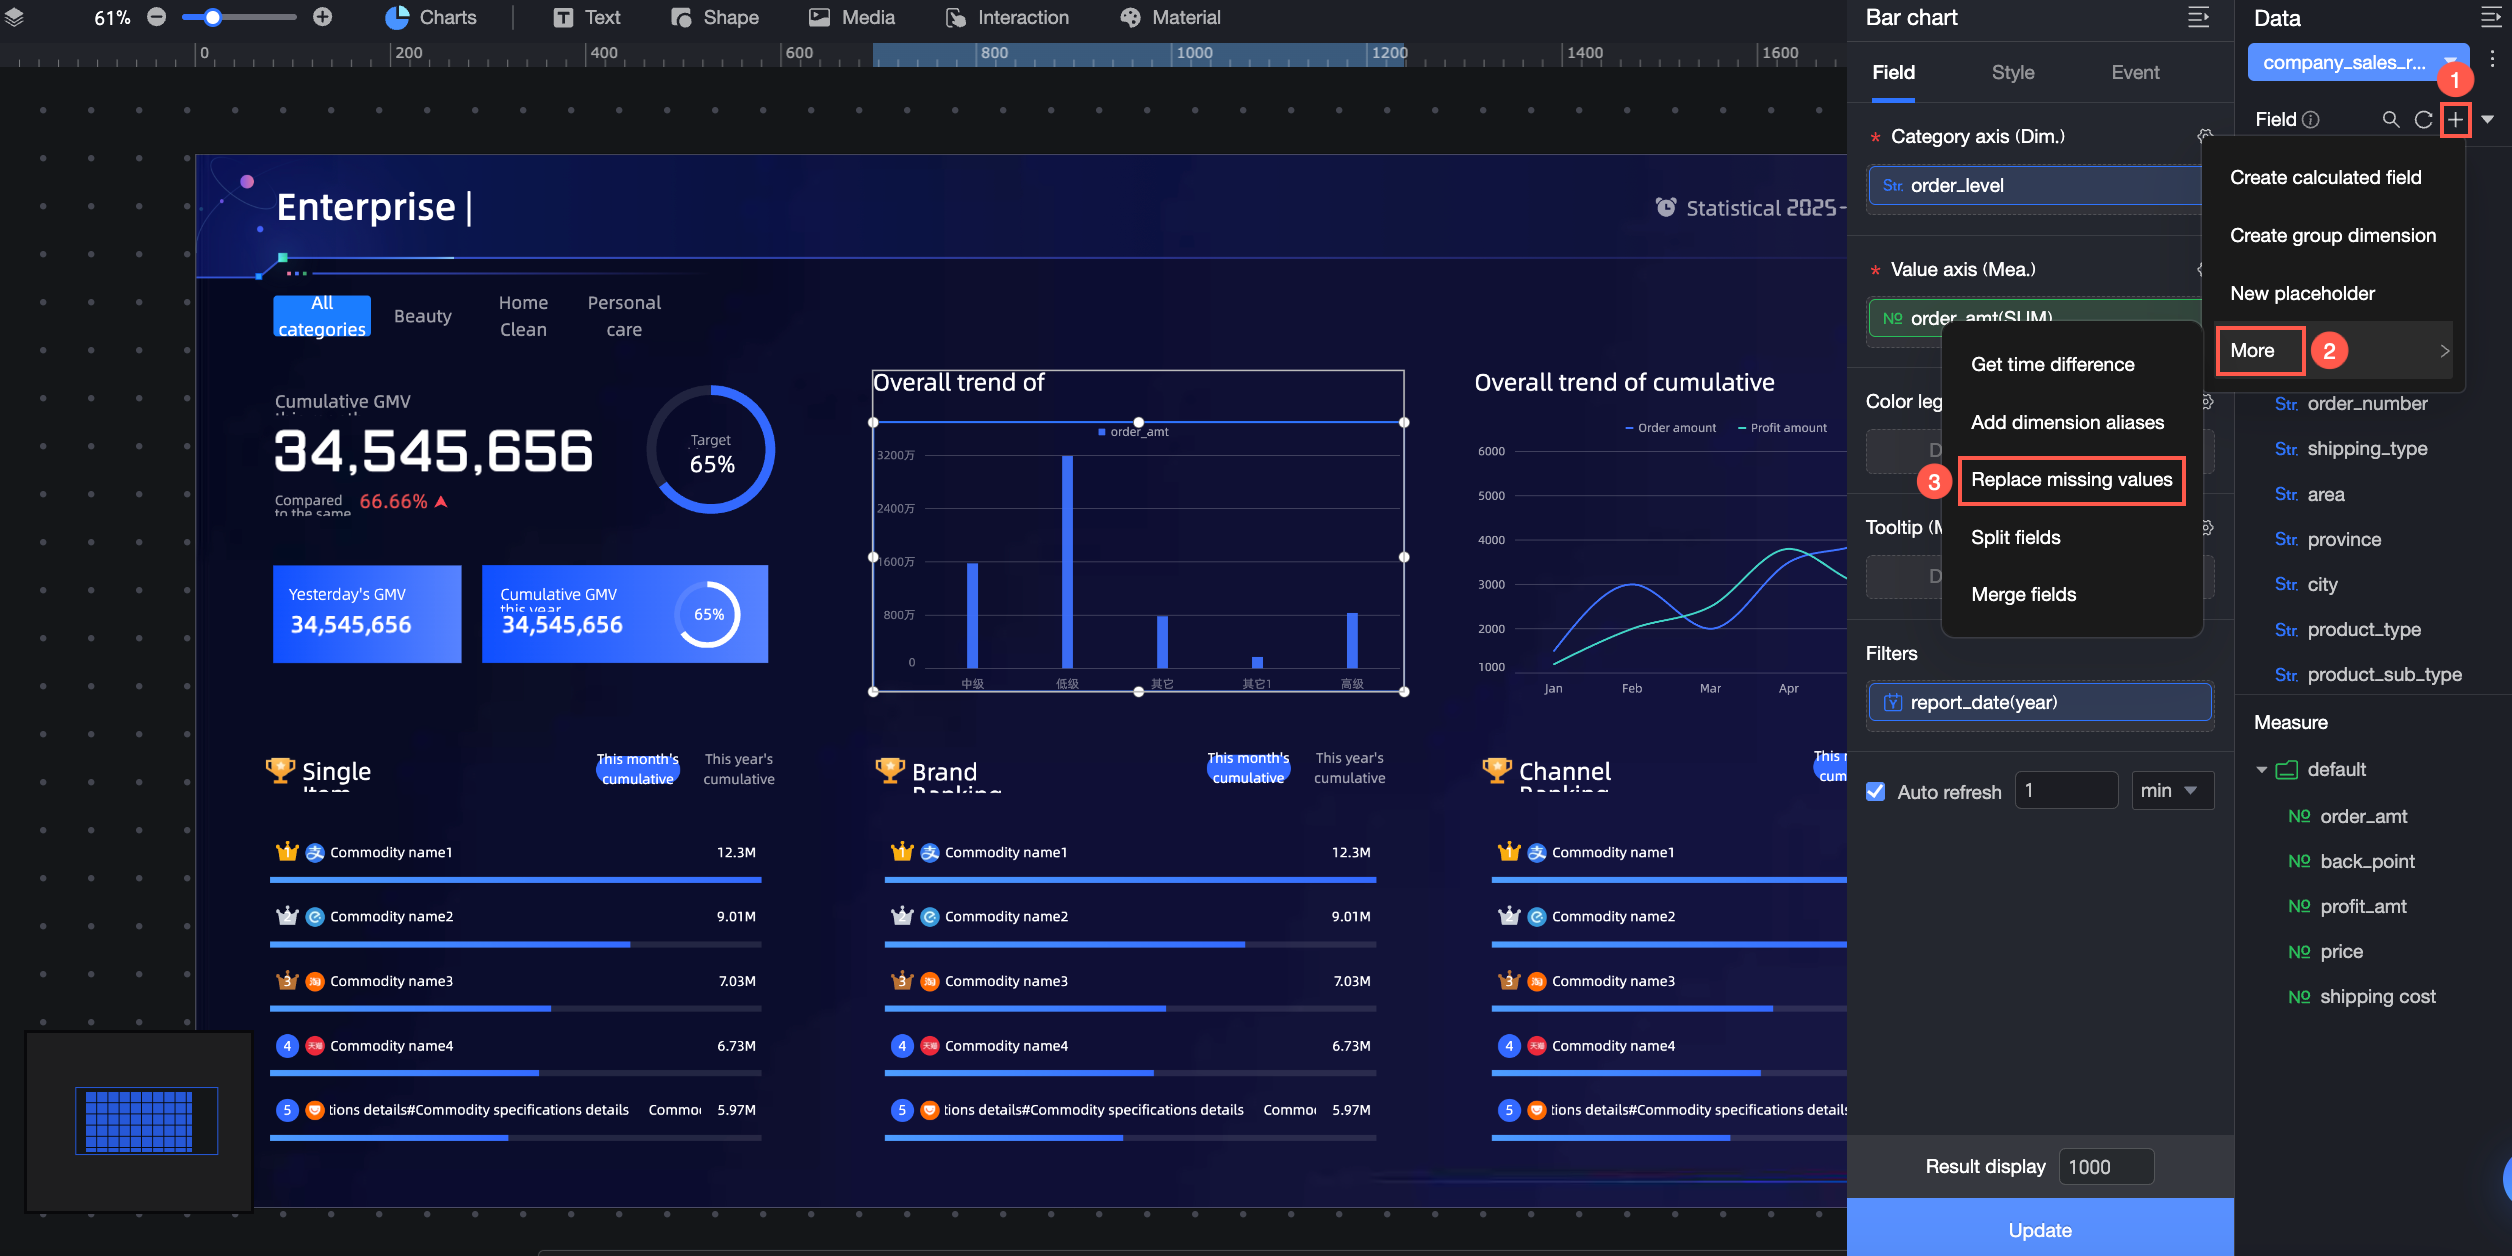
For more information, see Replace missing values.
Split a field
Split a text field into multiple fields based on a delimiter.
Only text fields can be split.
Calculated fields are not supported.
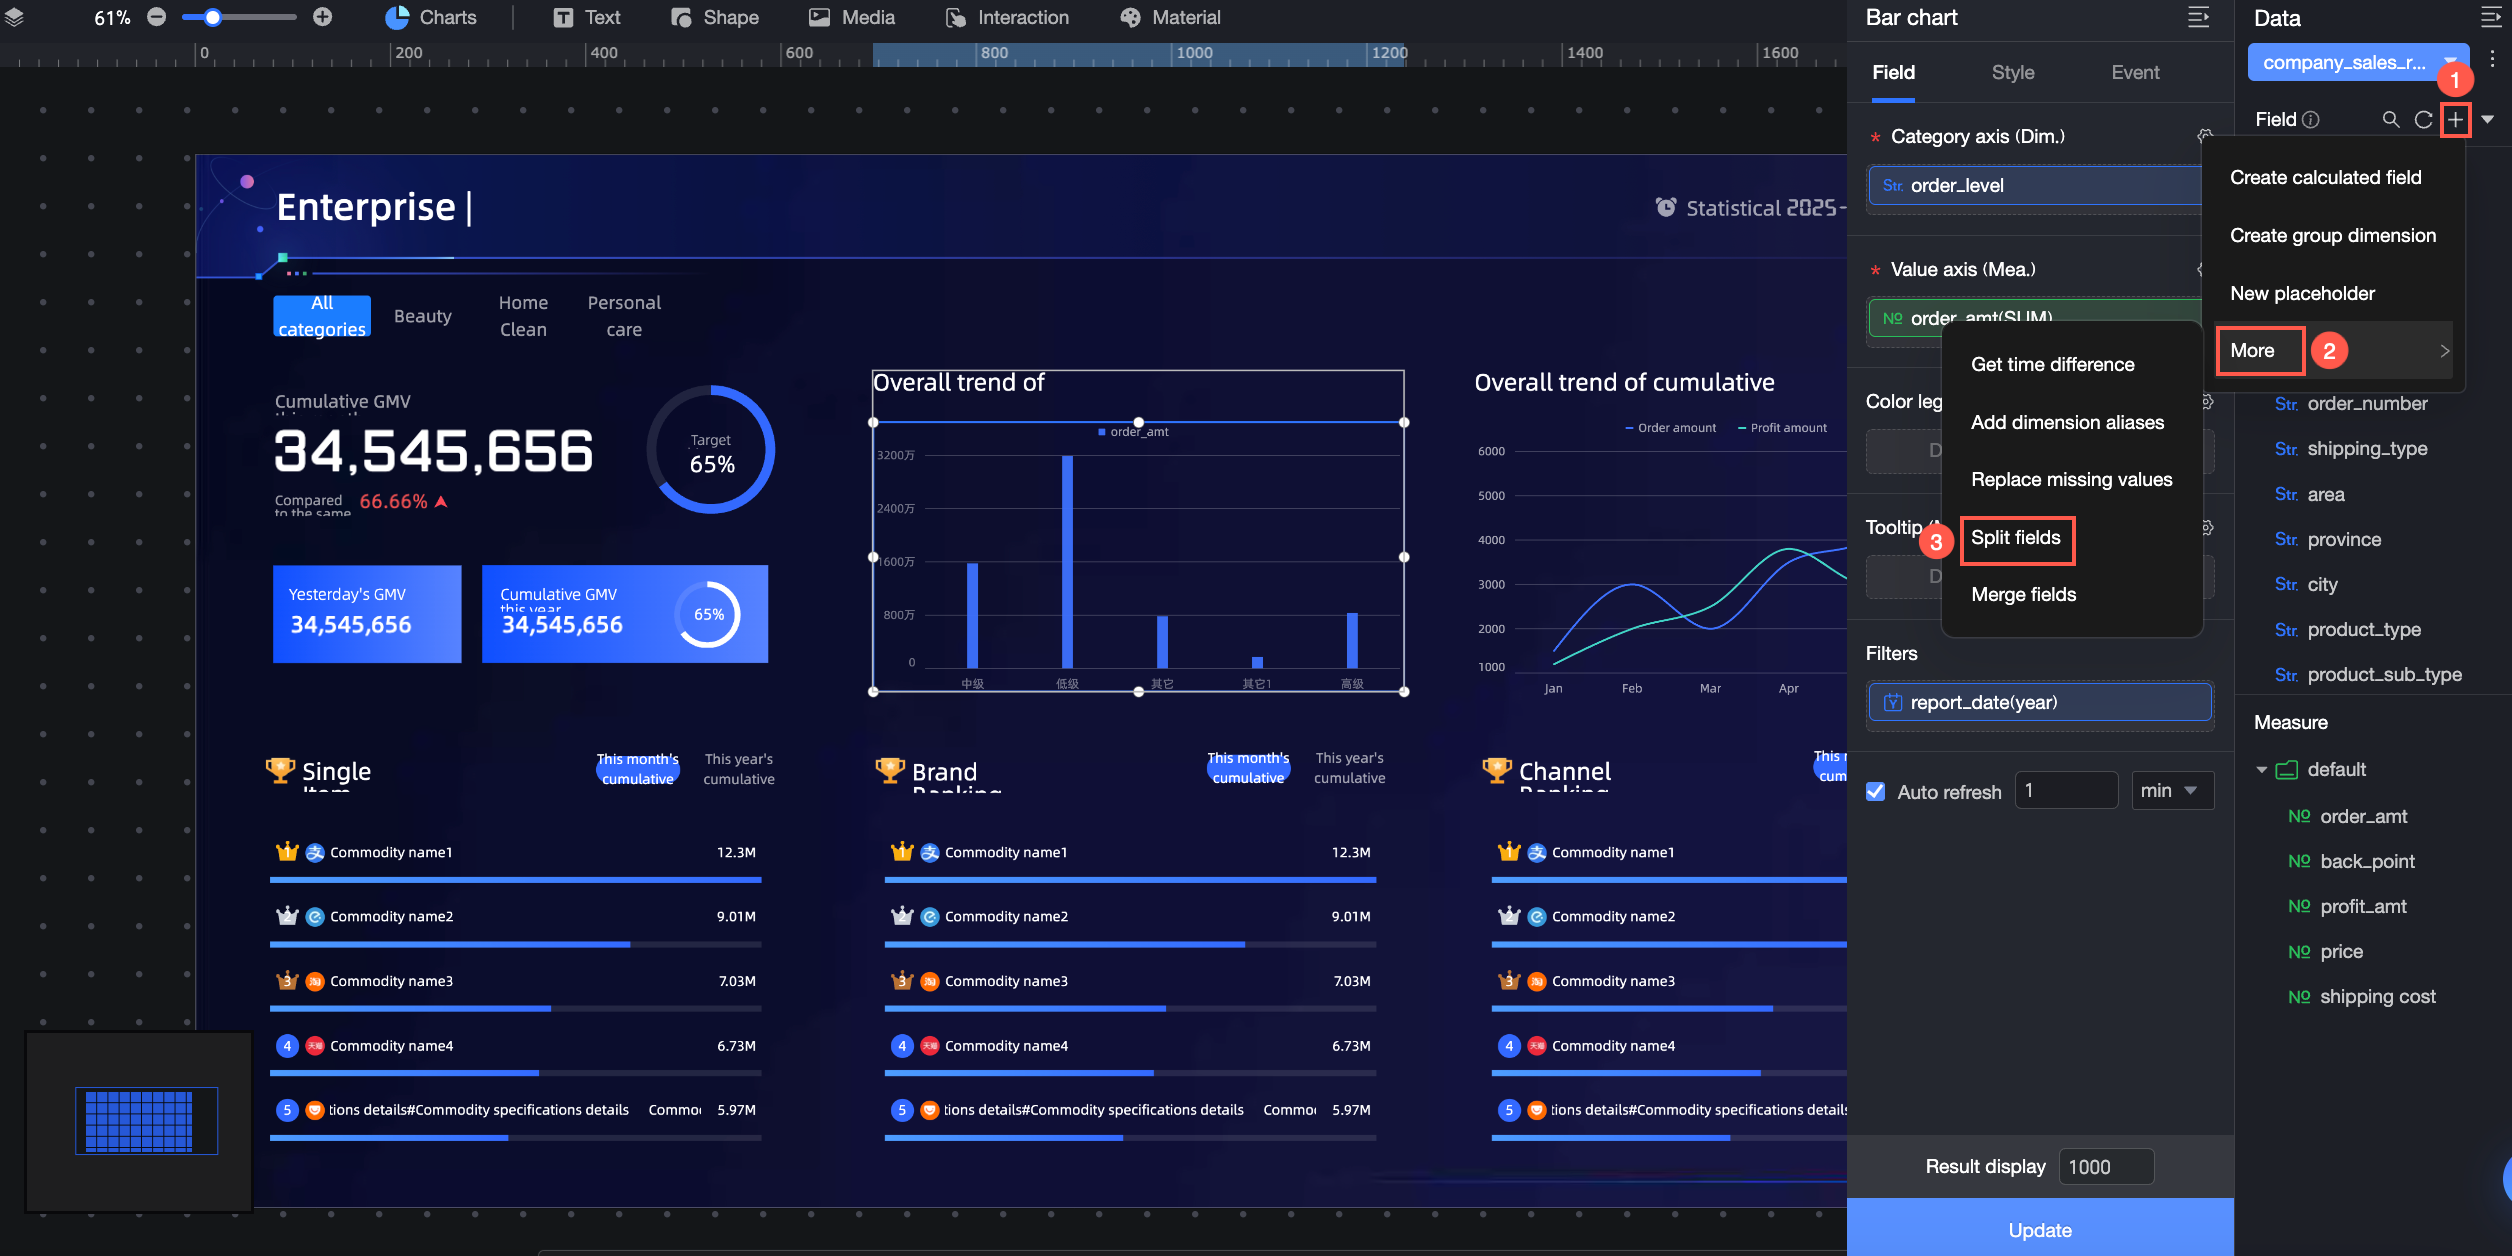
For more information, see Split a field.
Merge fields
Merge multiple text fields into a single new field using a separator.
You can merge up to 10 text fields.
Calculated fields are not supported.
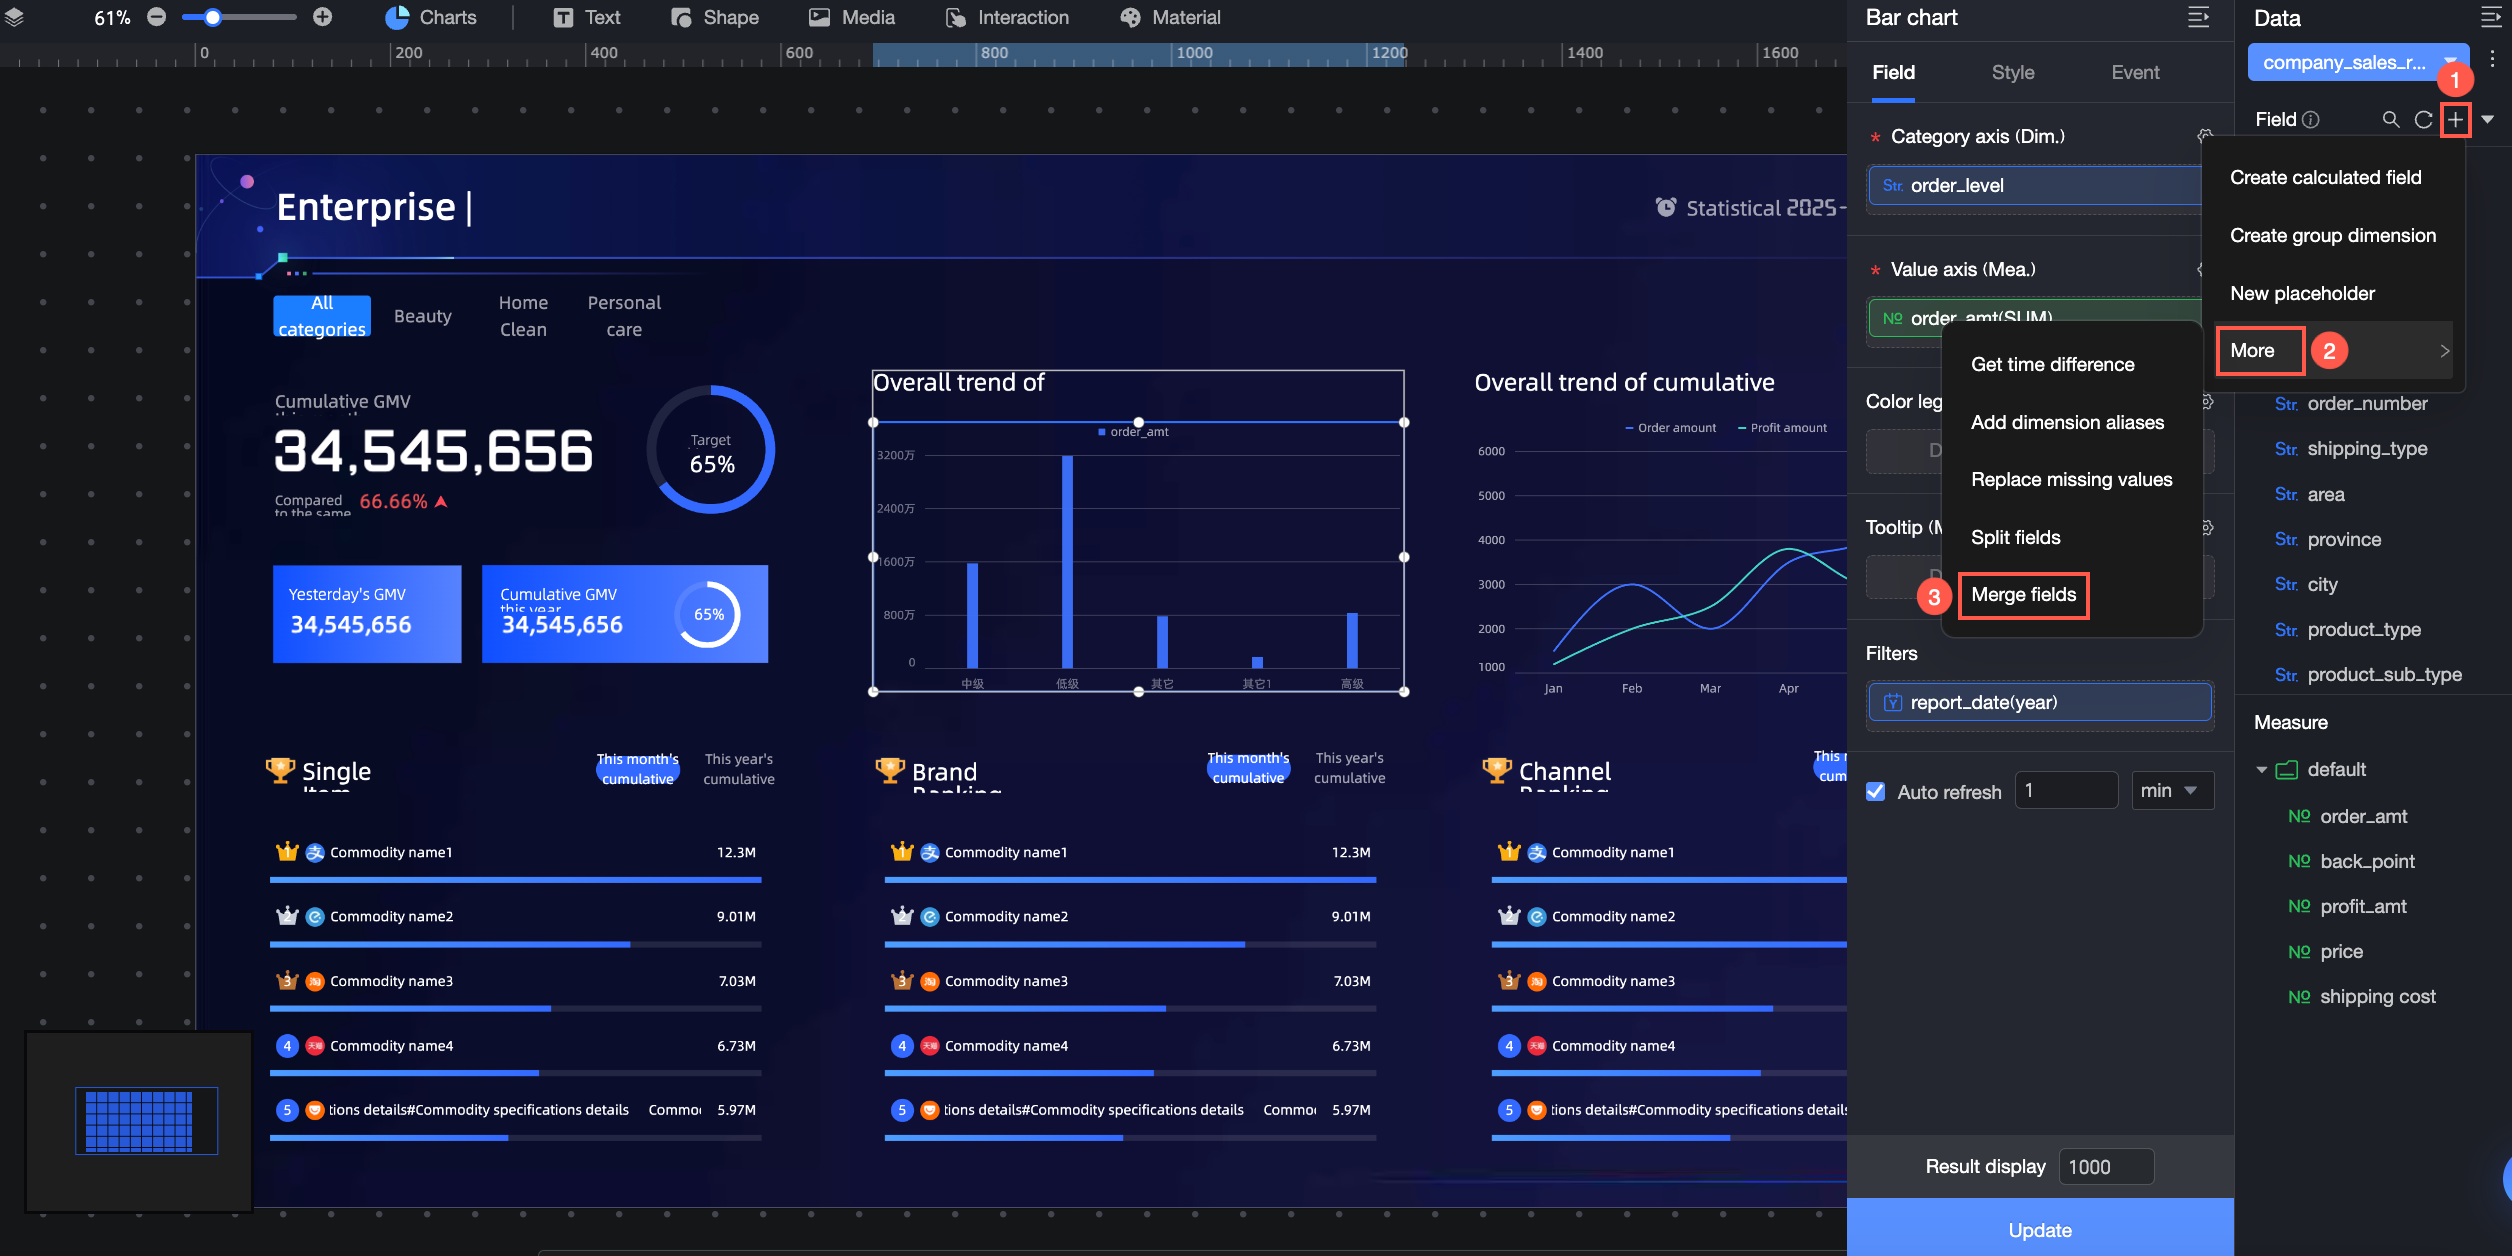 For more information, see Merge fields.
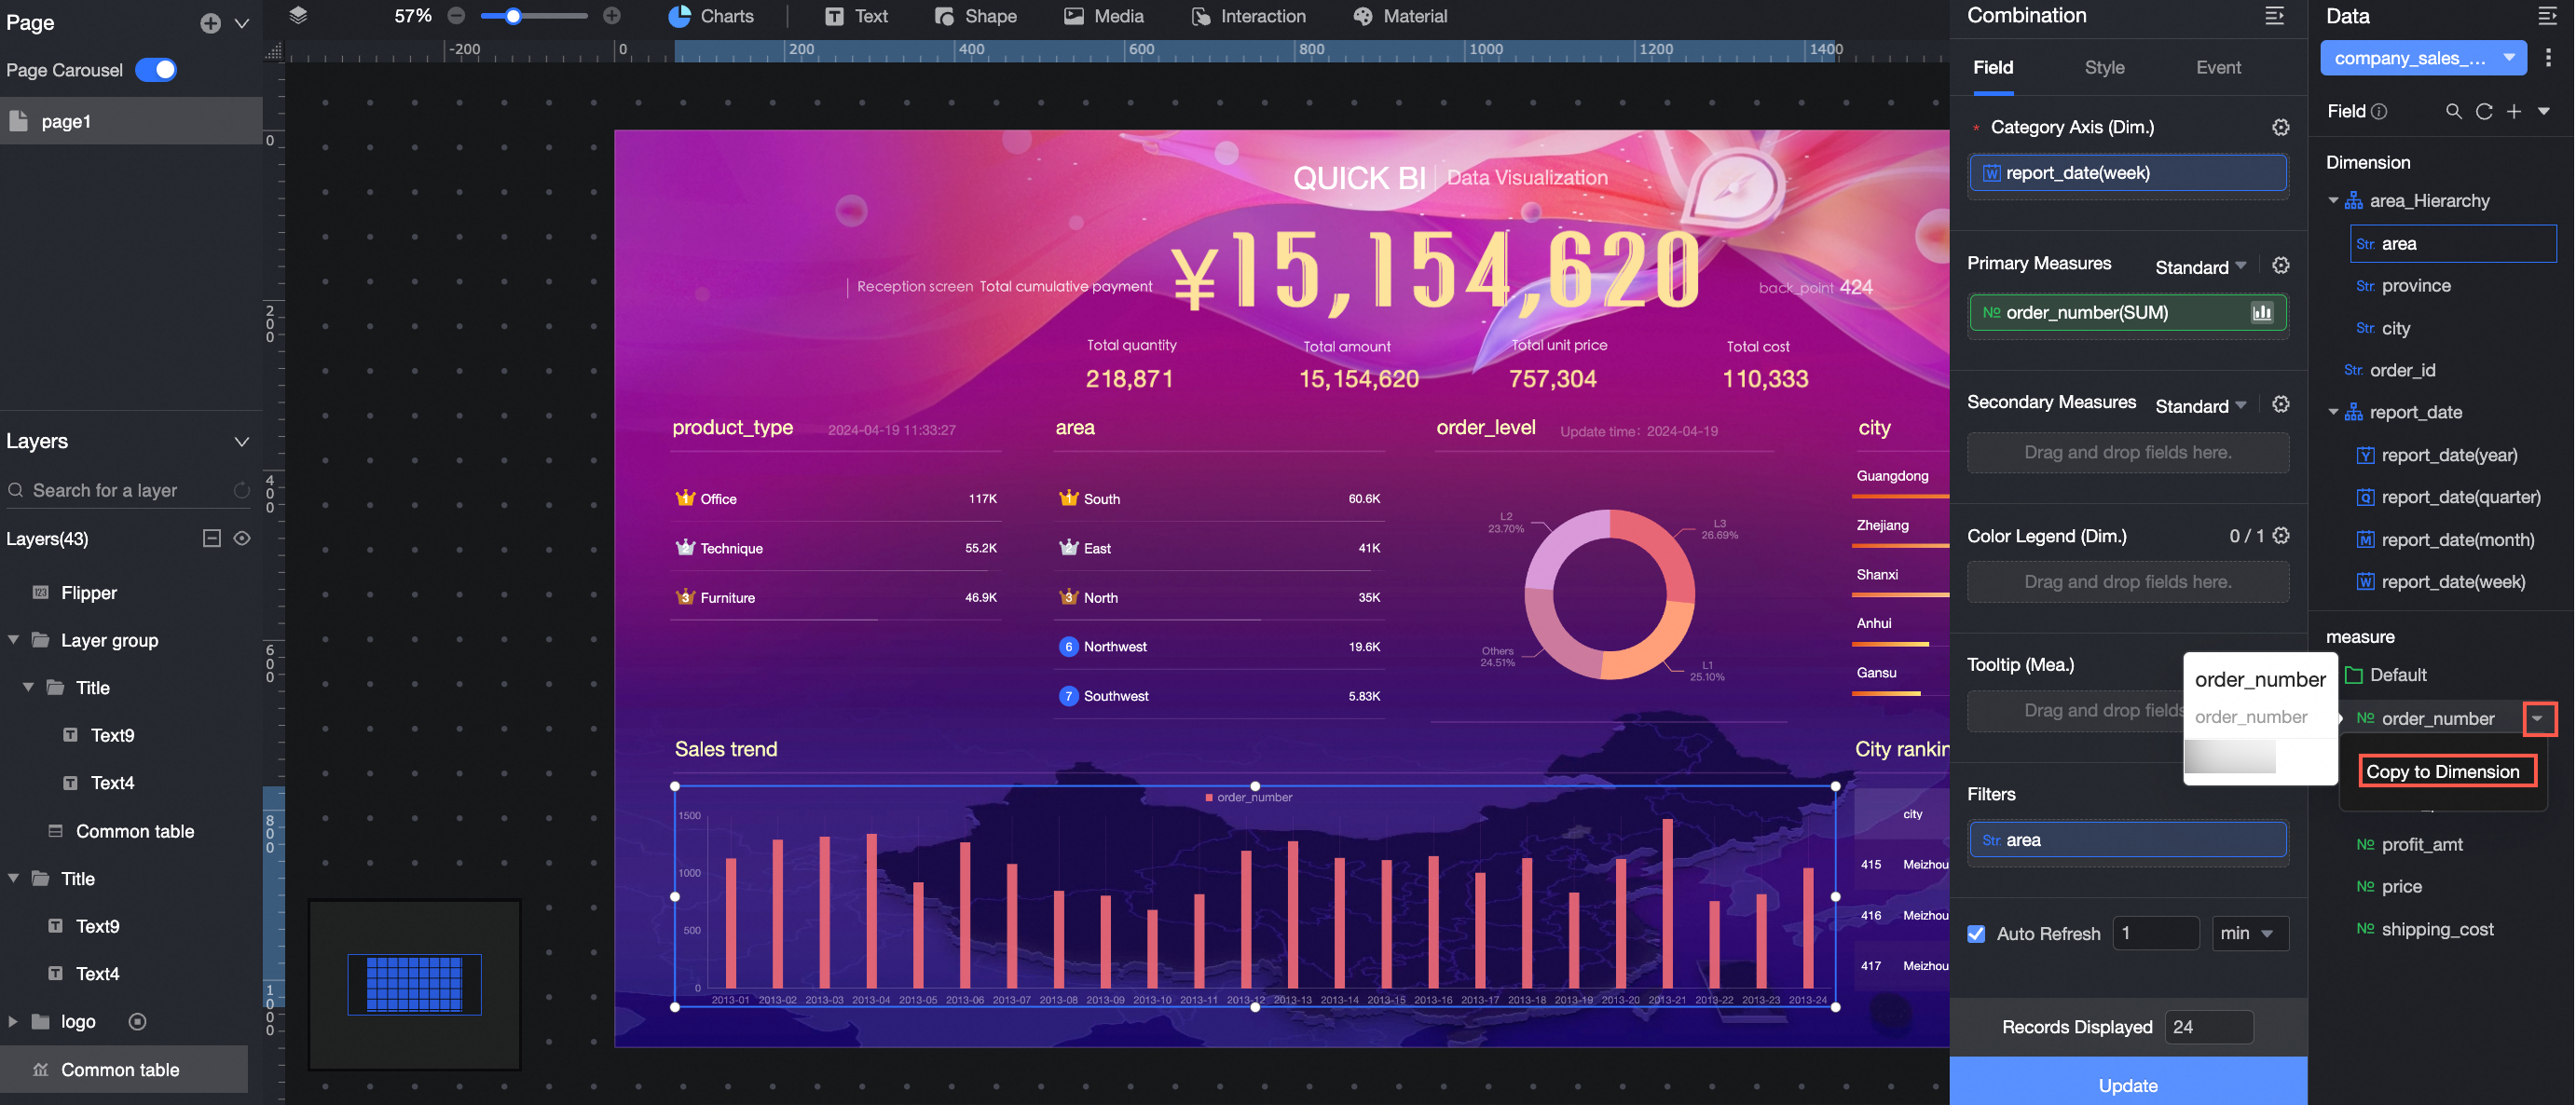
Copy to dimension
The new dimension applies only to the current chart and is not saved to the dataset.
It will not be available if you create a new chart, even one that uses the same dataset.
However, if you duplicate a chart, the new dimension is also copied to the new chart.
Edit a dataset
Click the ![]() icon to open the dataset menu, which includes options such as Preview Data, Edit Dataset, and Replace Current Dataset.
icon to open the dataset menu, which includes options such as Preview Data, Edit Dataset, and Replace Current Dataset.
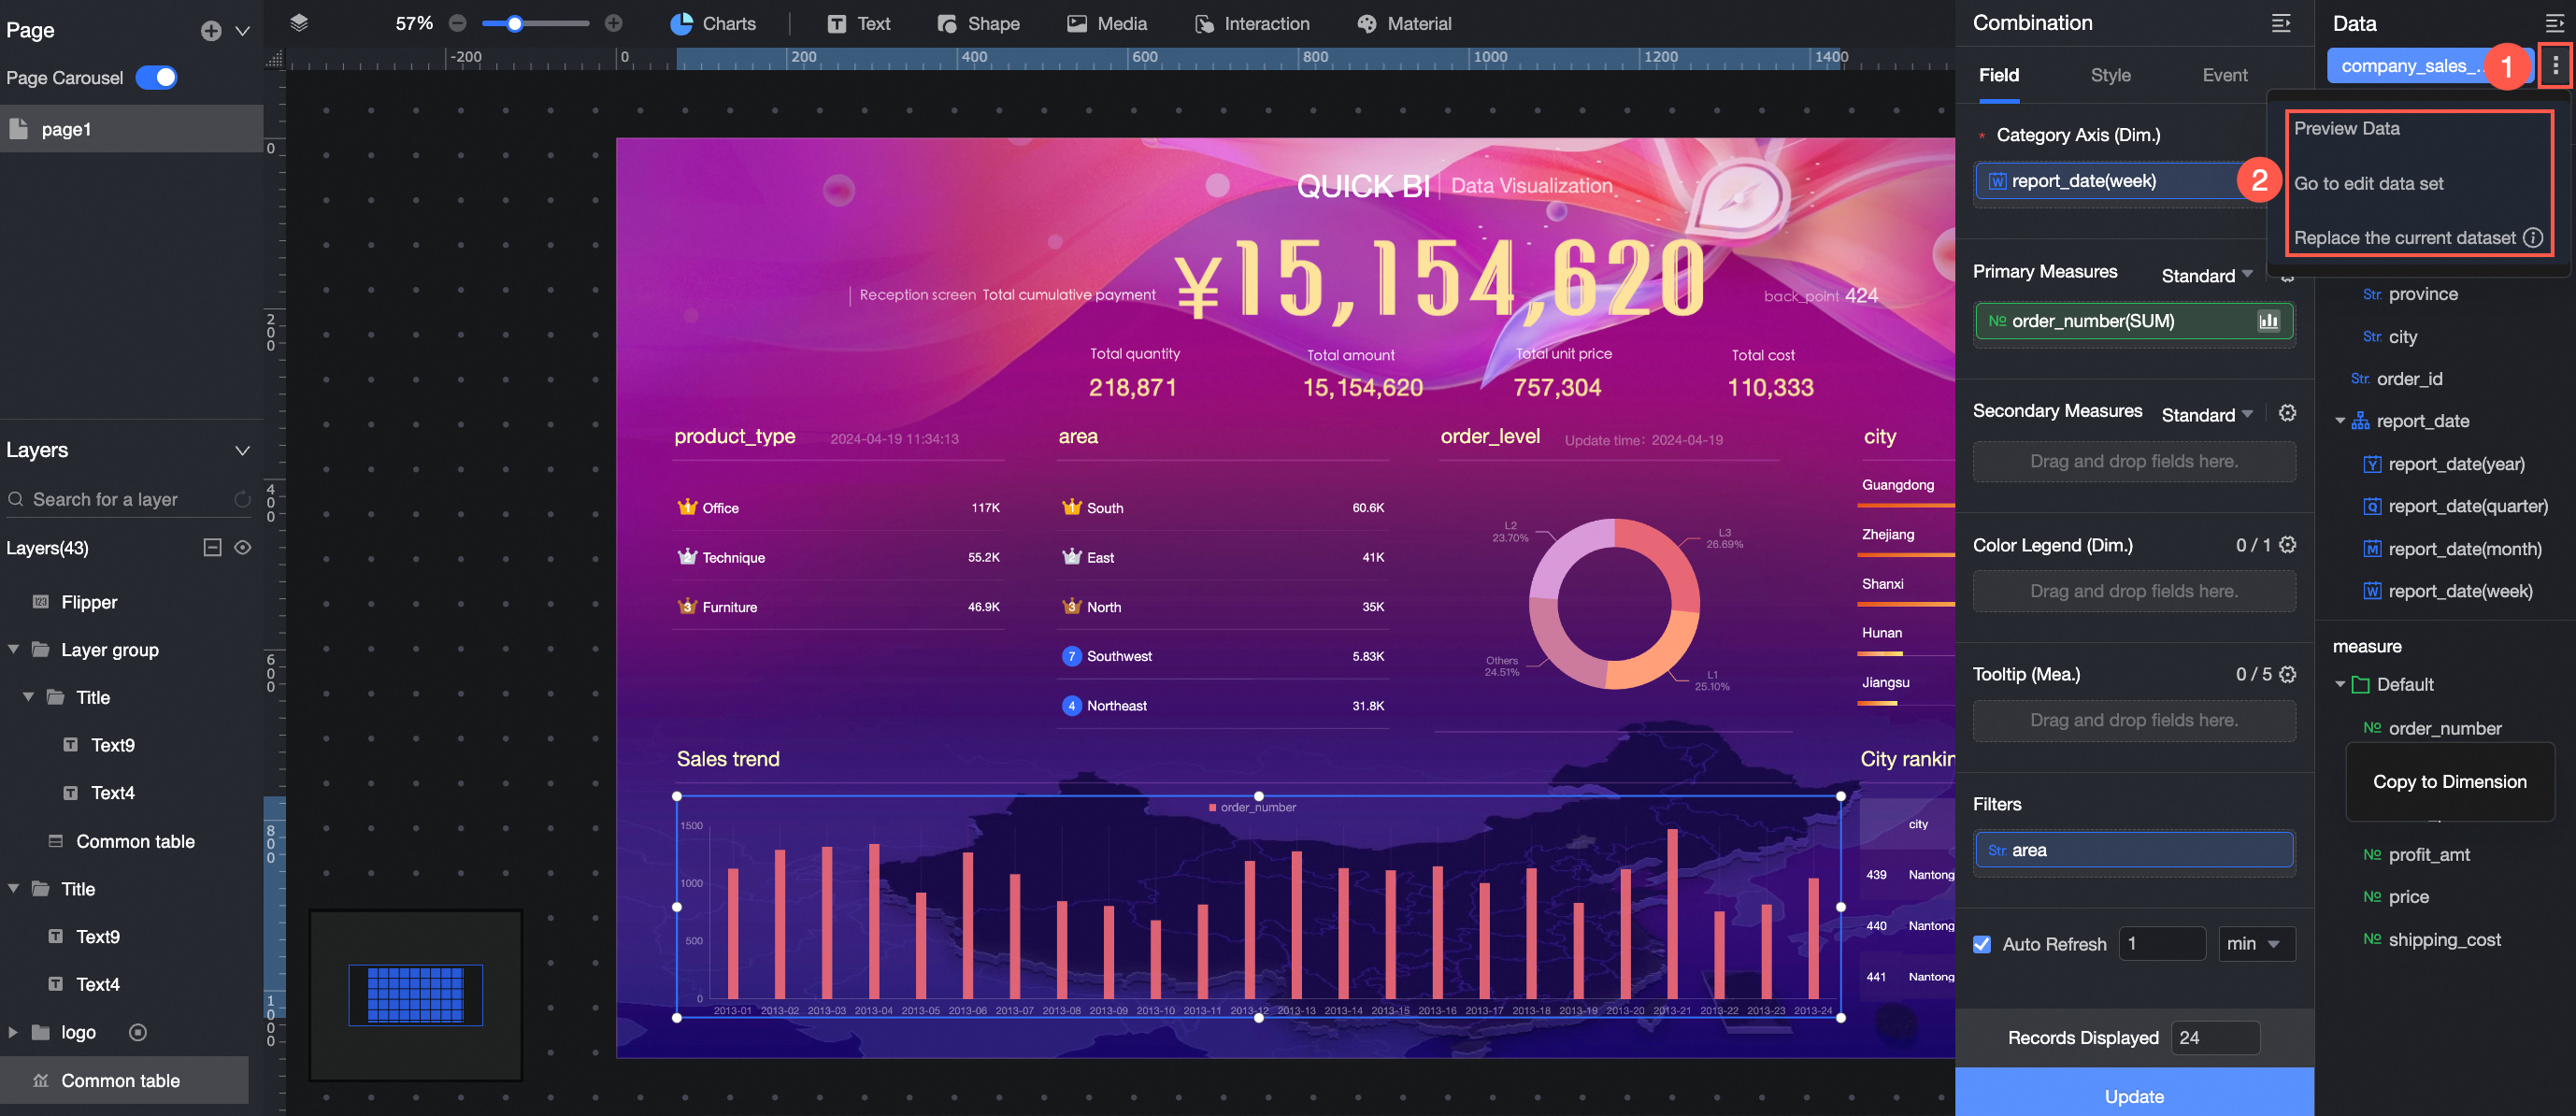
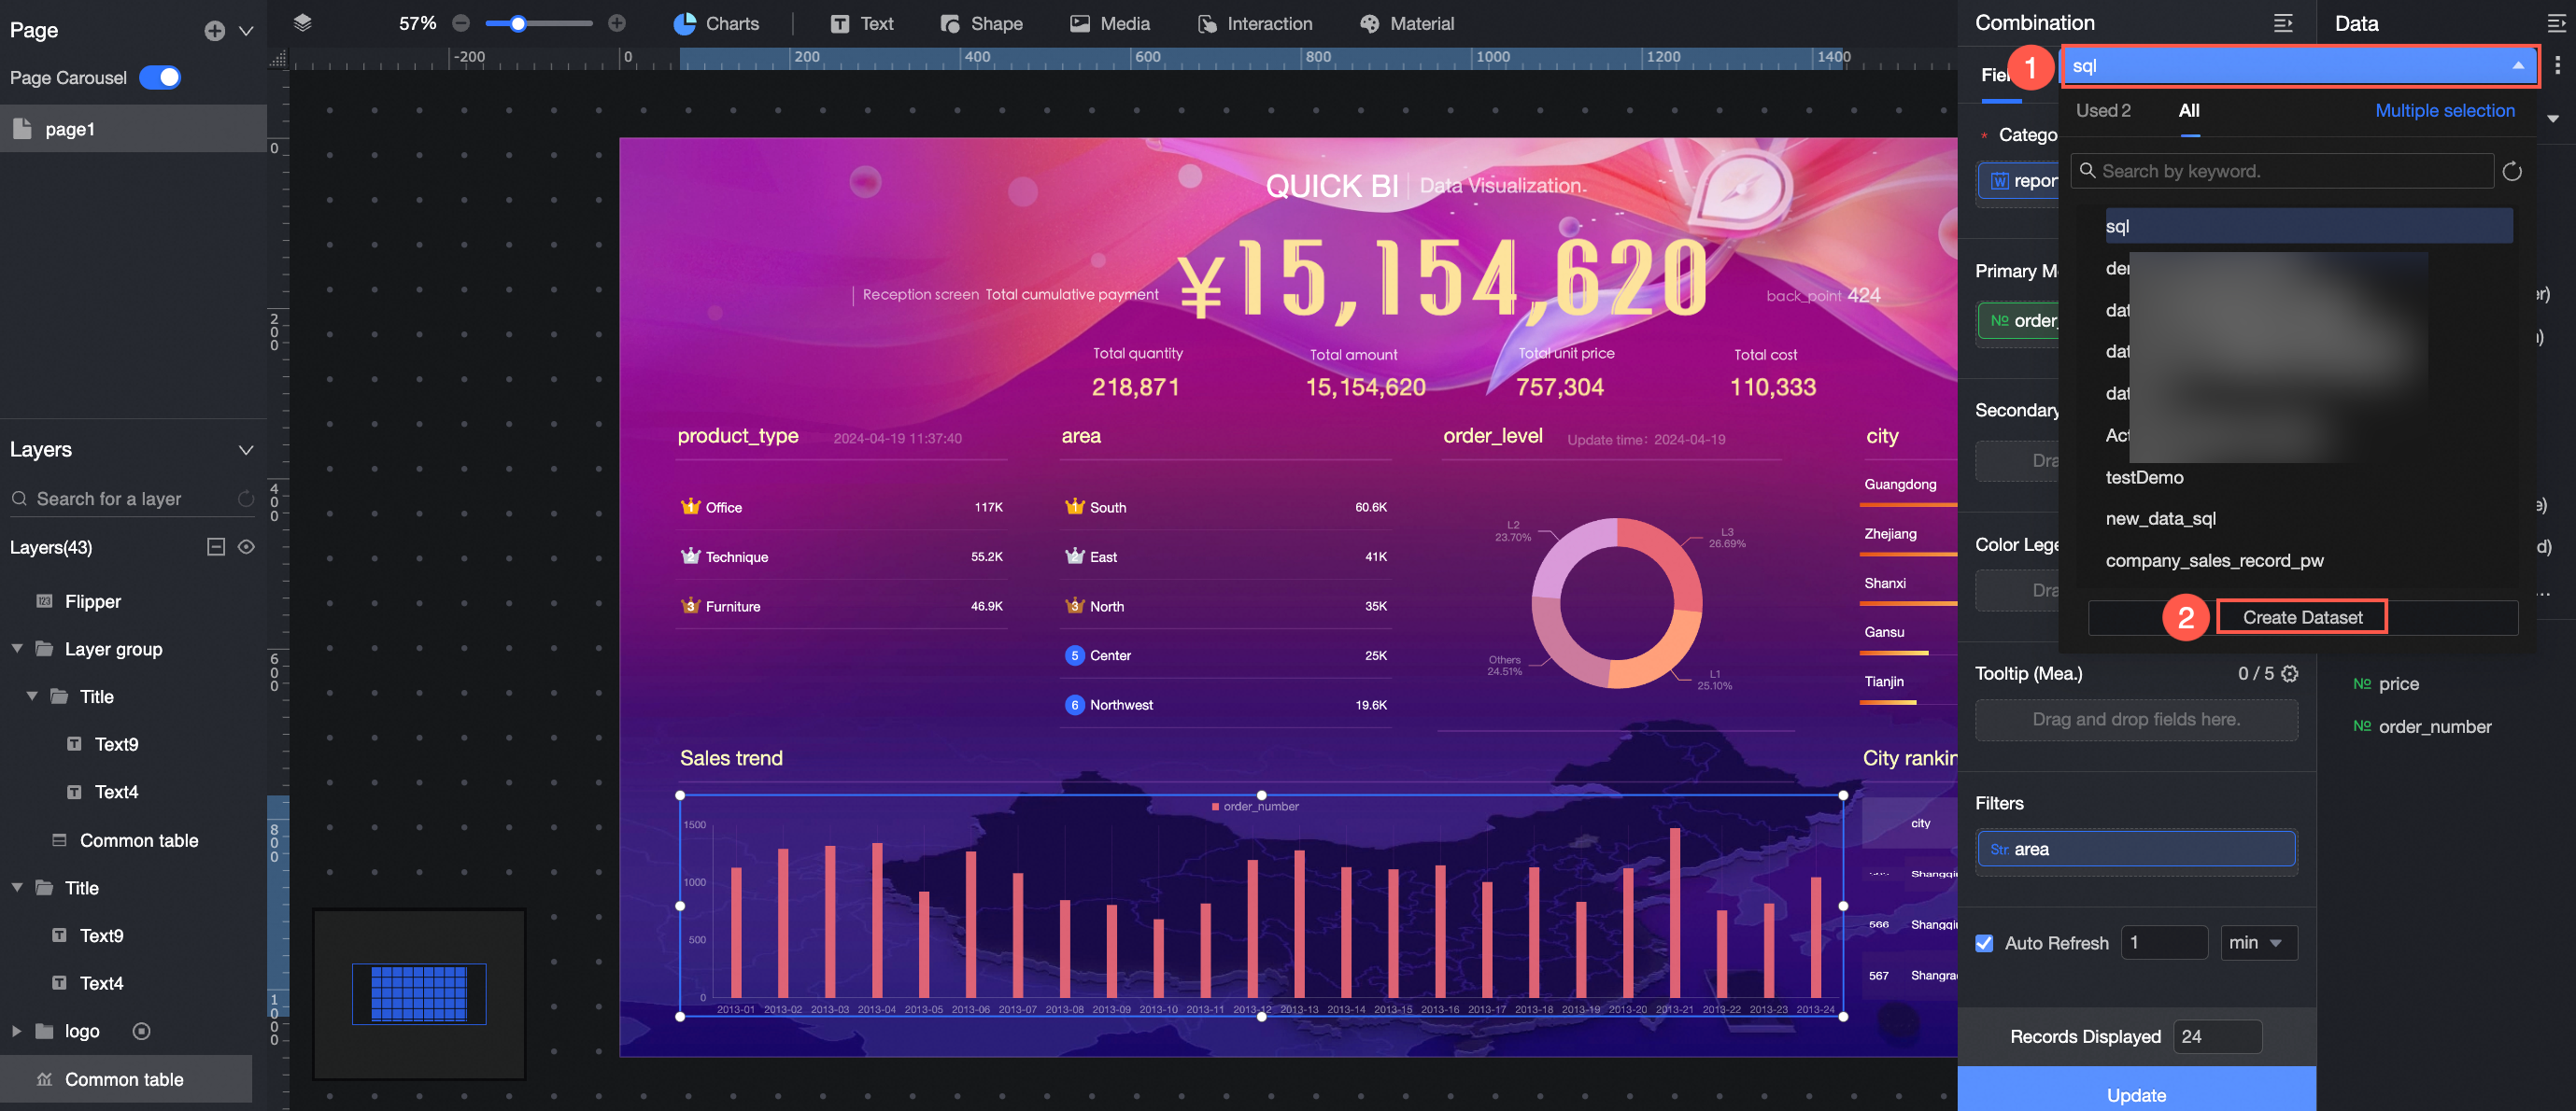
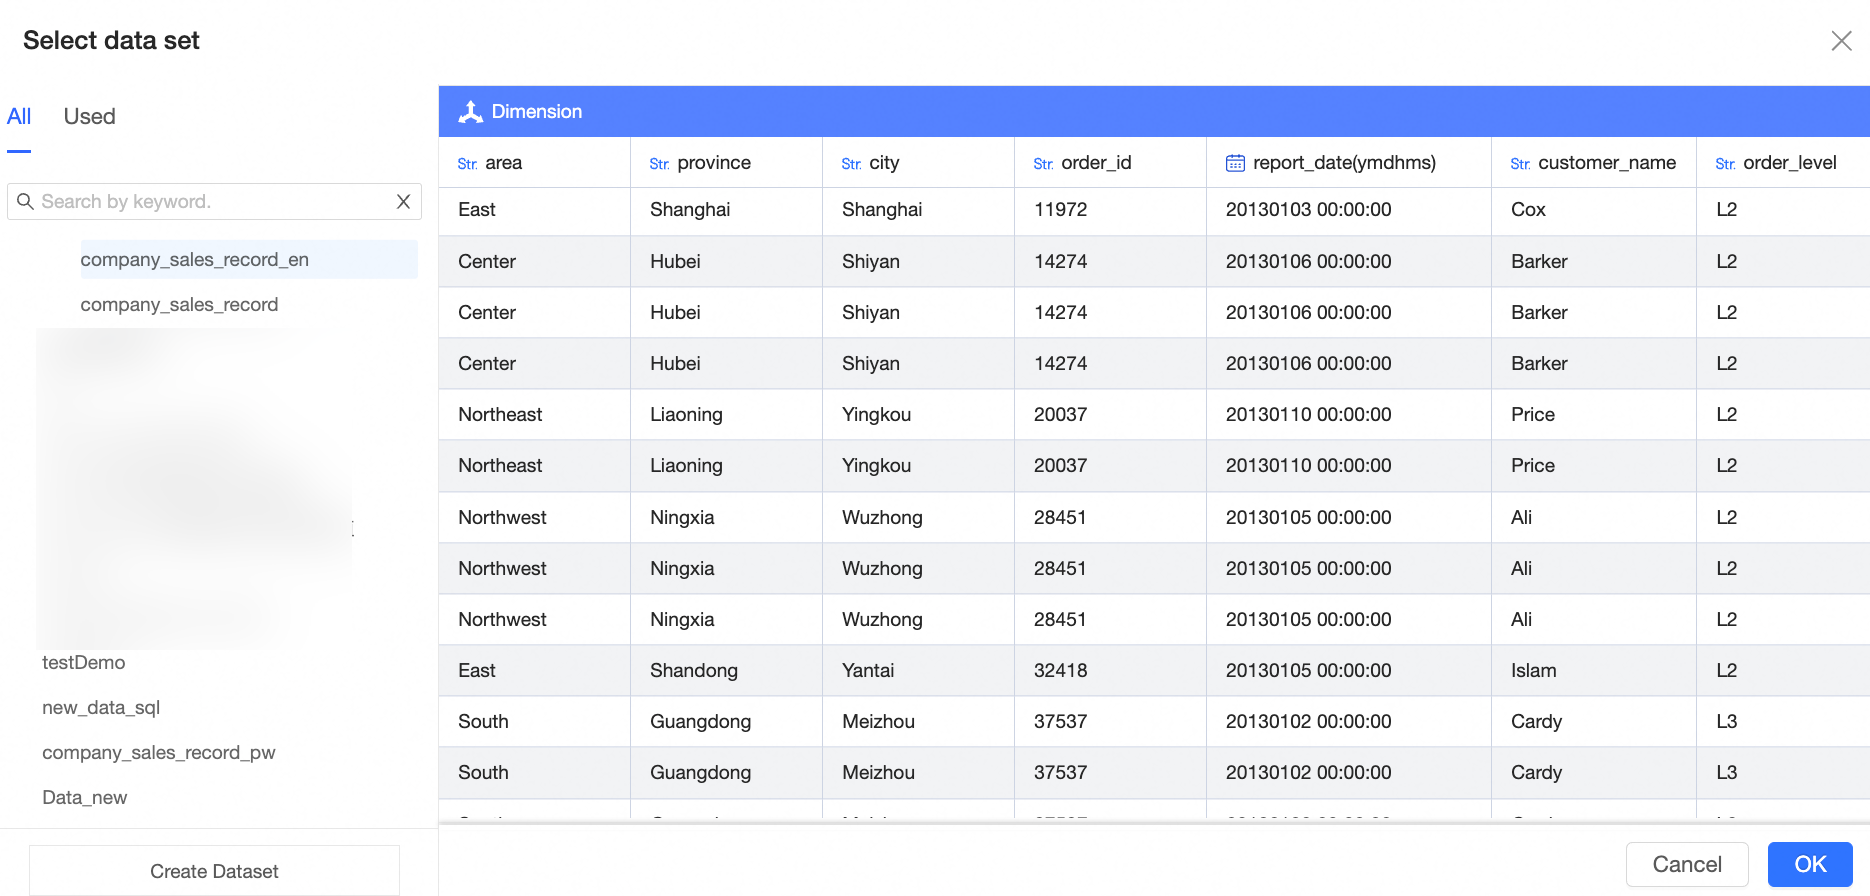
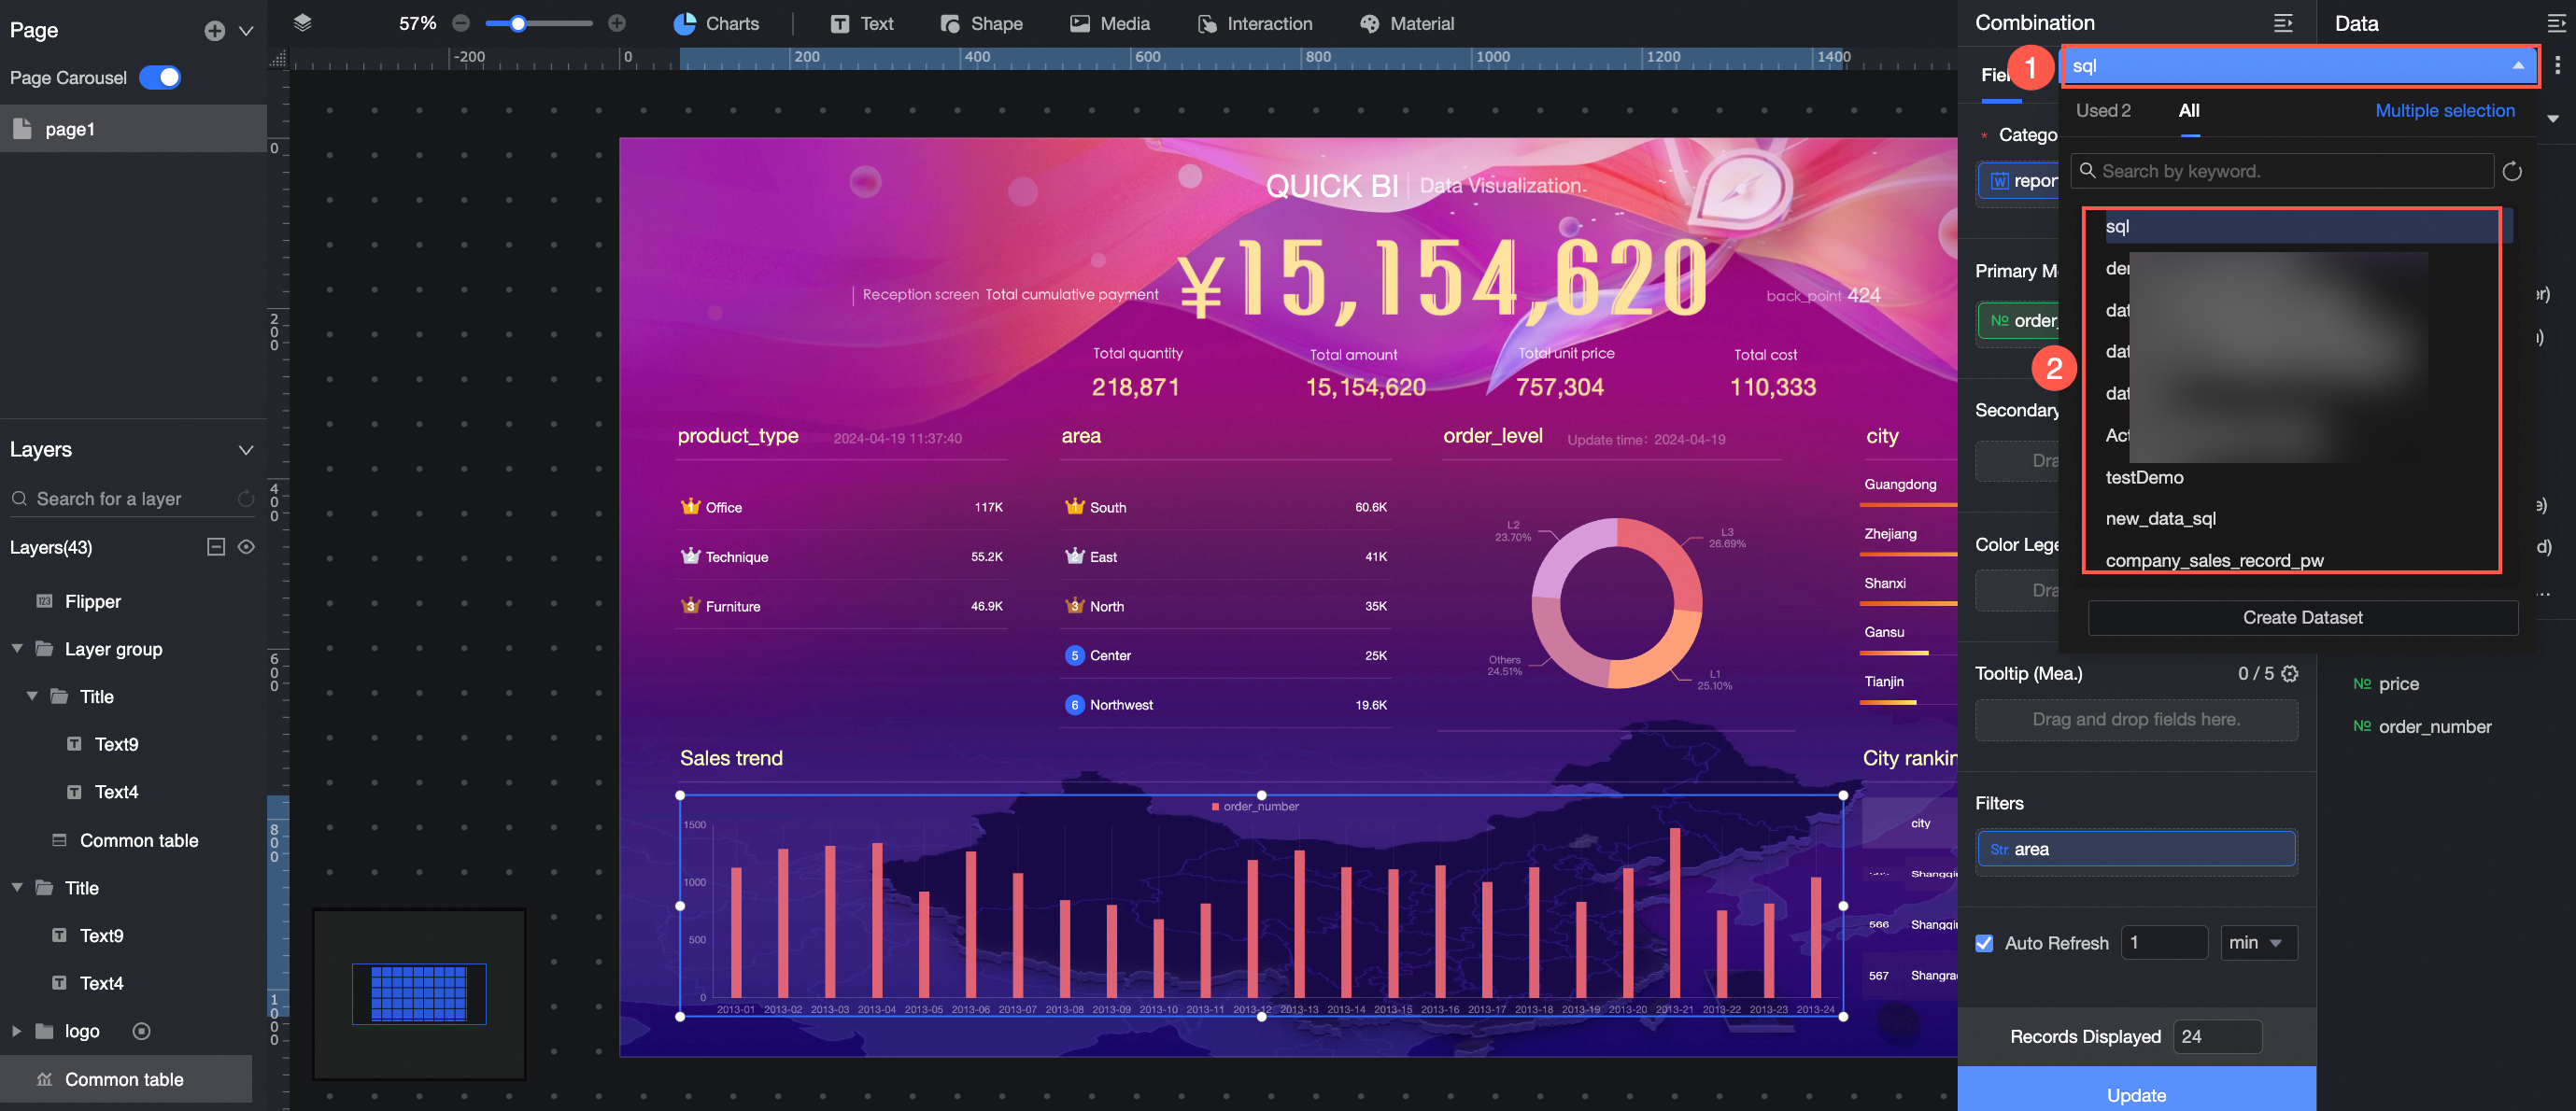
Preview data
After you click Preview Data, you can preview All Datasets or Used Datasets. You can also click Create Dataset to go to the dataset creation page.
Edit dataset
For more information, see Edit a dataset.
Replace current dataset
If you want to replace a dataset and keep the field configuration, click the ![]() icon and select Replace Current Dataset.
icon and select Replace Current Dataset.
Switch a dataset
Click the dataset selector to switch between used datasets and all datasets. Note that this action clears the current field configuration.
Upload a local file
Create a chart by uploading a local file to use as a source table.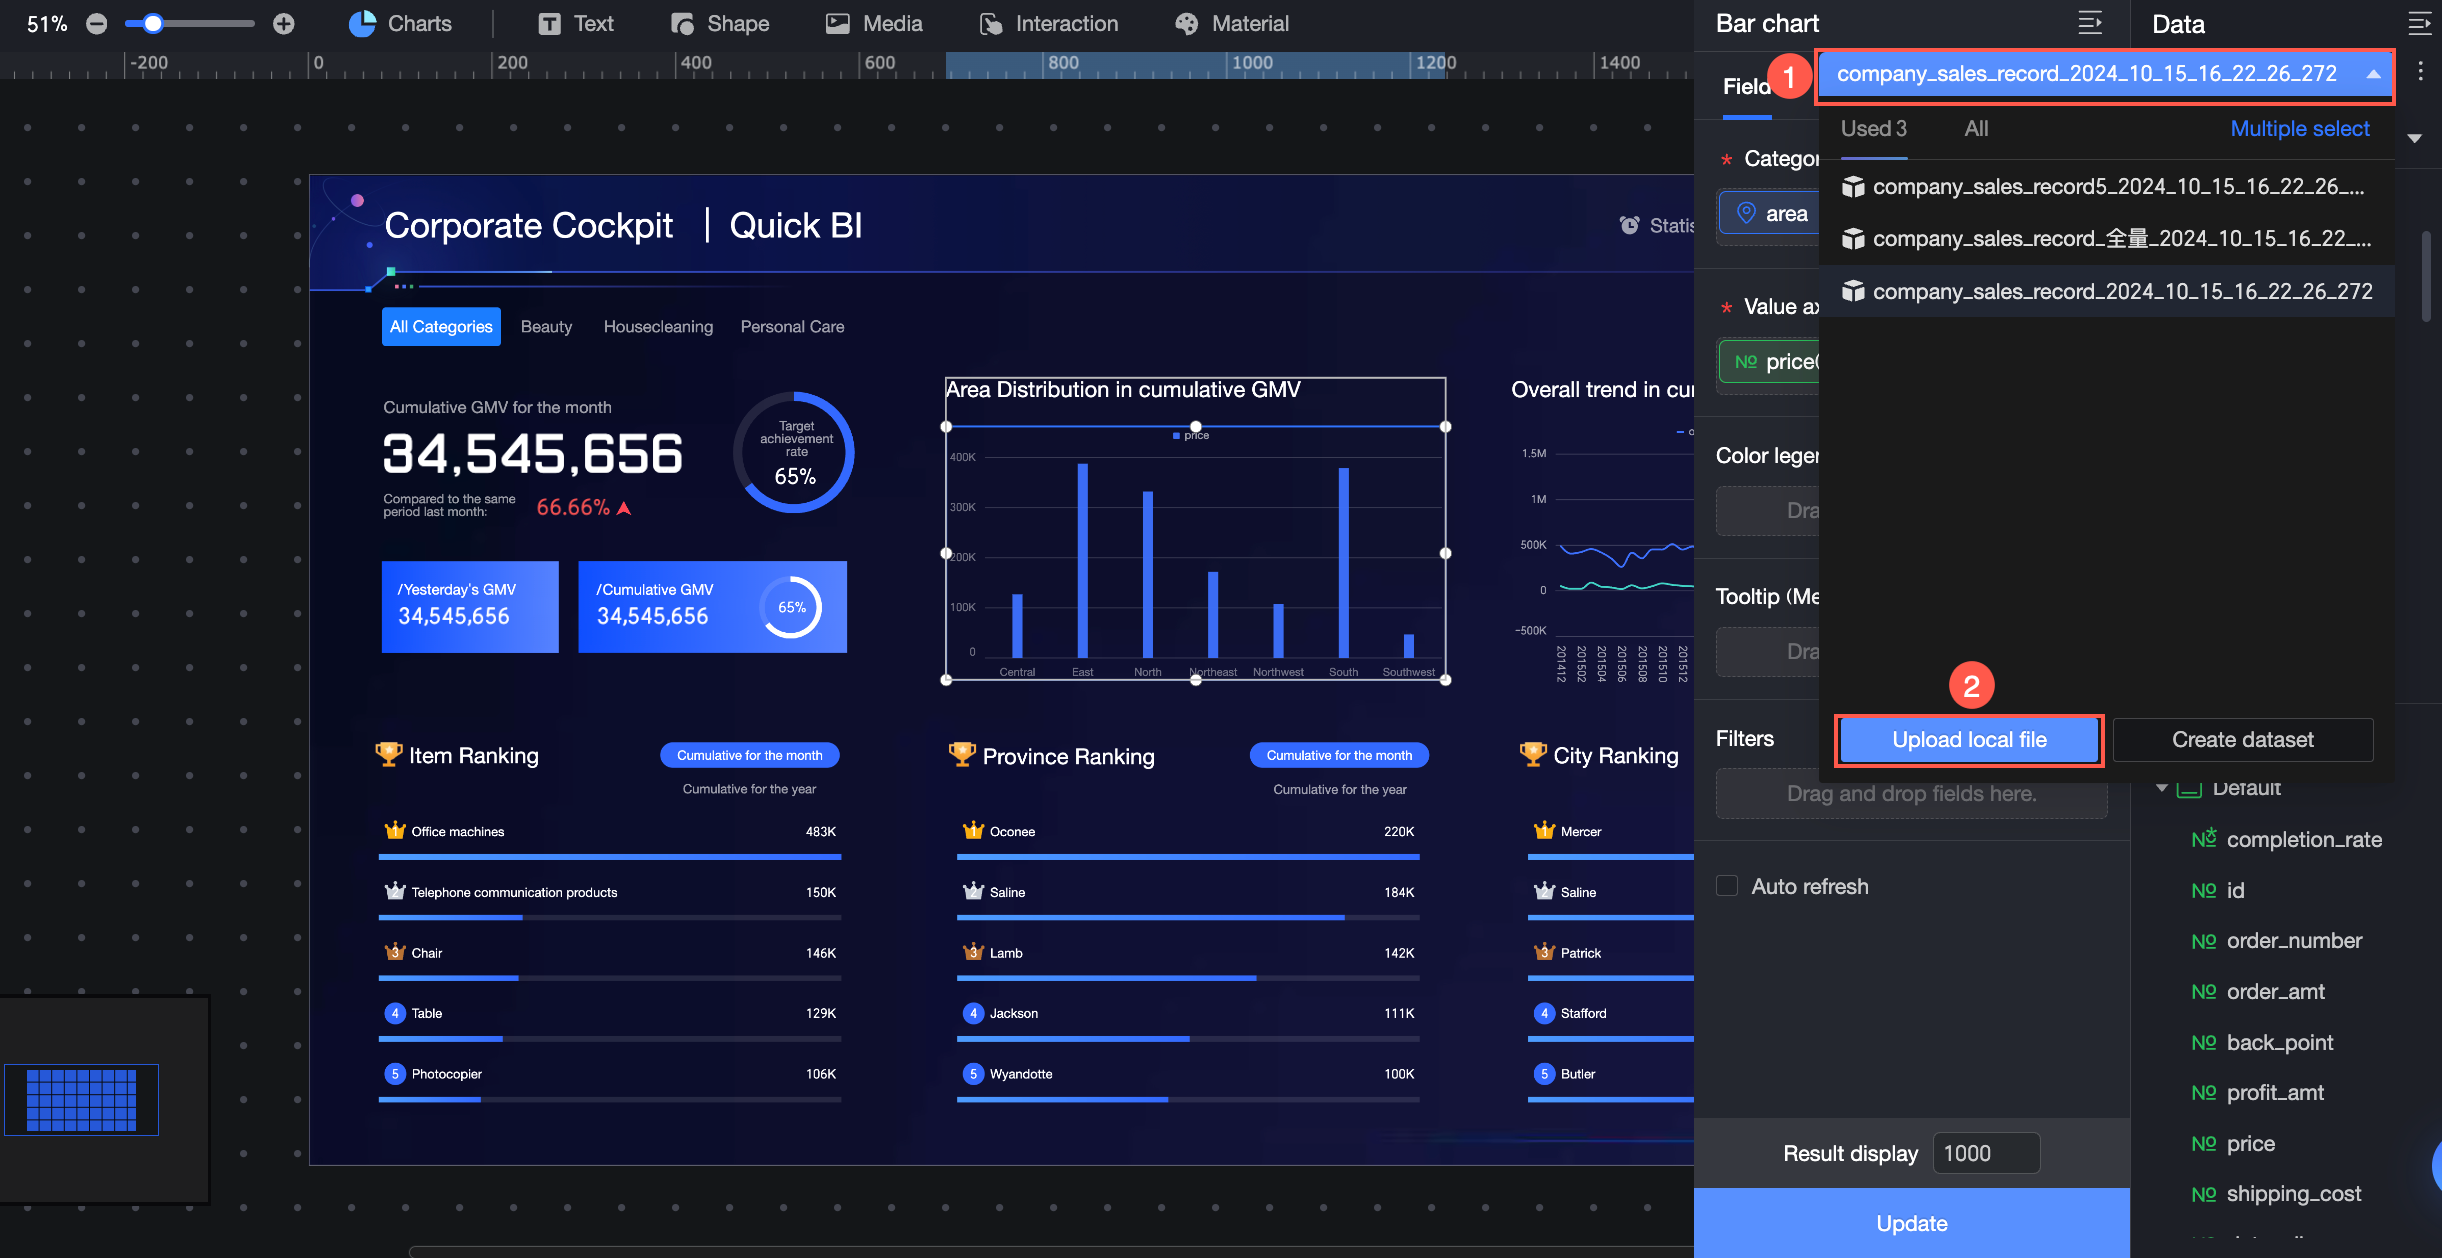
Create a dataset
Click Create Dataset to open the creation page. For more information, see Create a dataset.