Comparisons
A period-over-period comparison compares the value of a metric between two time periods. This topic explains how to configure period-over-period comparisons for a measure.
Prerequisites
You have created a dashboard. For more information, see Create a dashboard.
You have selected a dataset and configured its chart fields. For more information, see Configure a chart.
If a period-over-period comparison depends on dynamic date filtering, ensure you have added and configured the Query Control. For more information, see Create a Query Control.
For period-over-period settings, a date filter is required for the date field. Date placeholders are not supported.
Background information
A period-over-period comparison compares a metric against the prior statistical period. For example, comparing data from January 2021 to data from December 2020.
A year-over-year comparison compares a metric against the same period in the prior year. For example, comparing data from January 2021 to data from January 2020.
Supported date field comparisons
Date granularity | Example | Description |
Year-granularity field | Order Date (year) |
|
Quarter-granularity field | Order Date (quarter) |
|
Month-granularity field | Order Date (month) |
|
Week-granularity field | Order Date (week) |
|
Day-granularity field | Order Date (day) |
|
Configuration
In a crosstab, hover over a measure, click the  icon on the right, and select Advanced Calculation > Period-over-period Comparison. You can then choose a Custom or Quick period-over-period comparison based on your business scenario.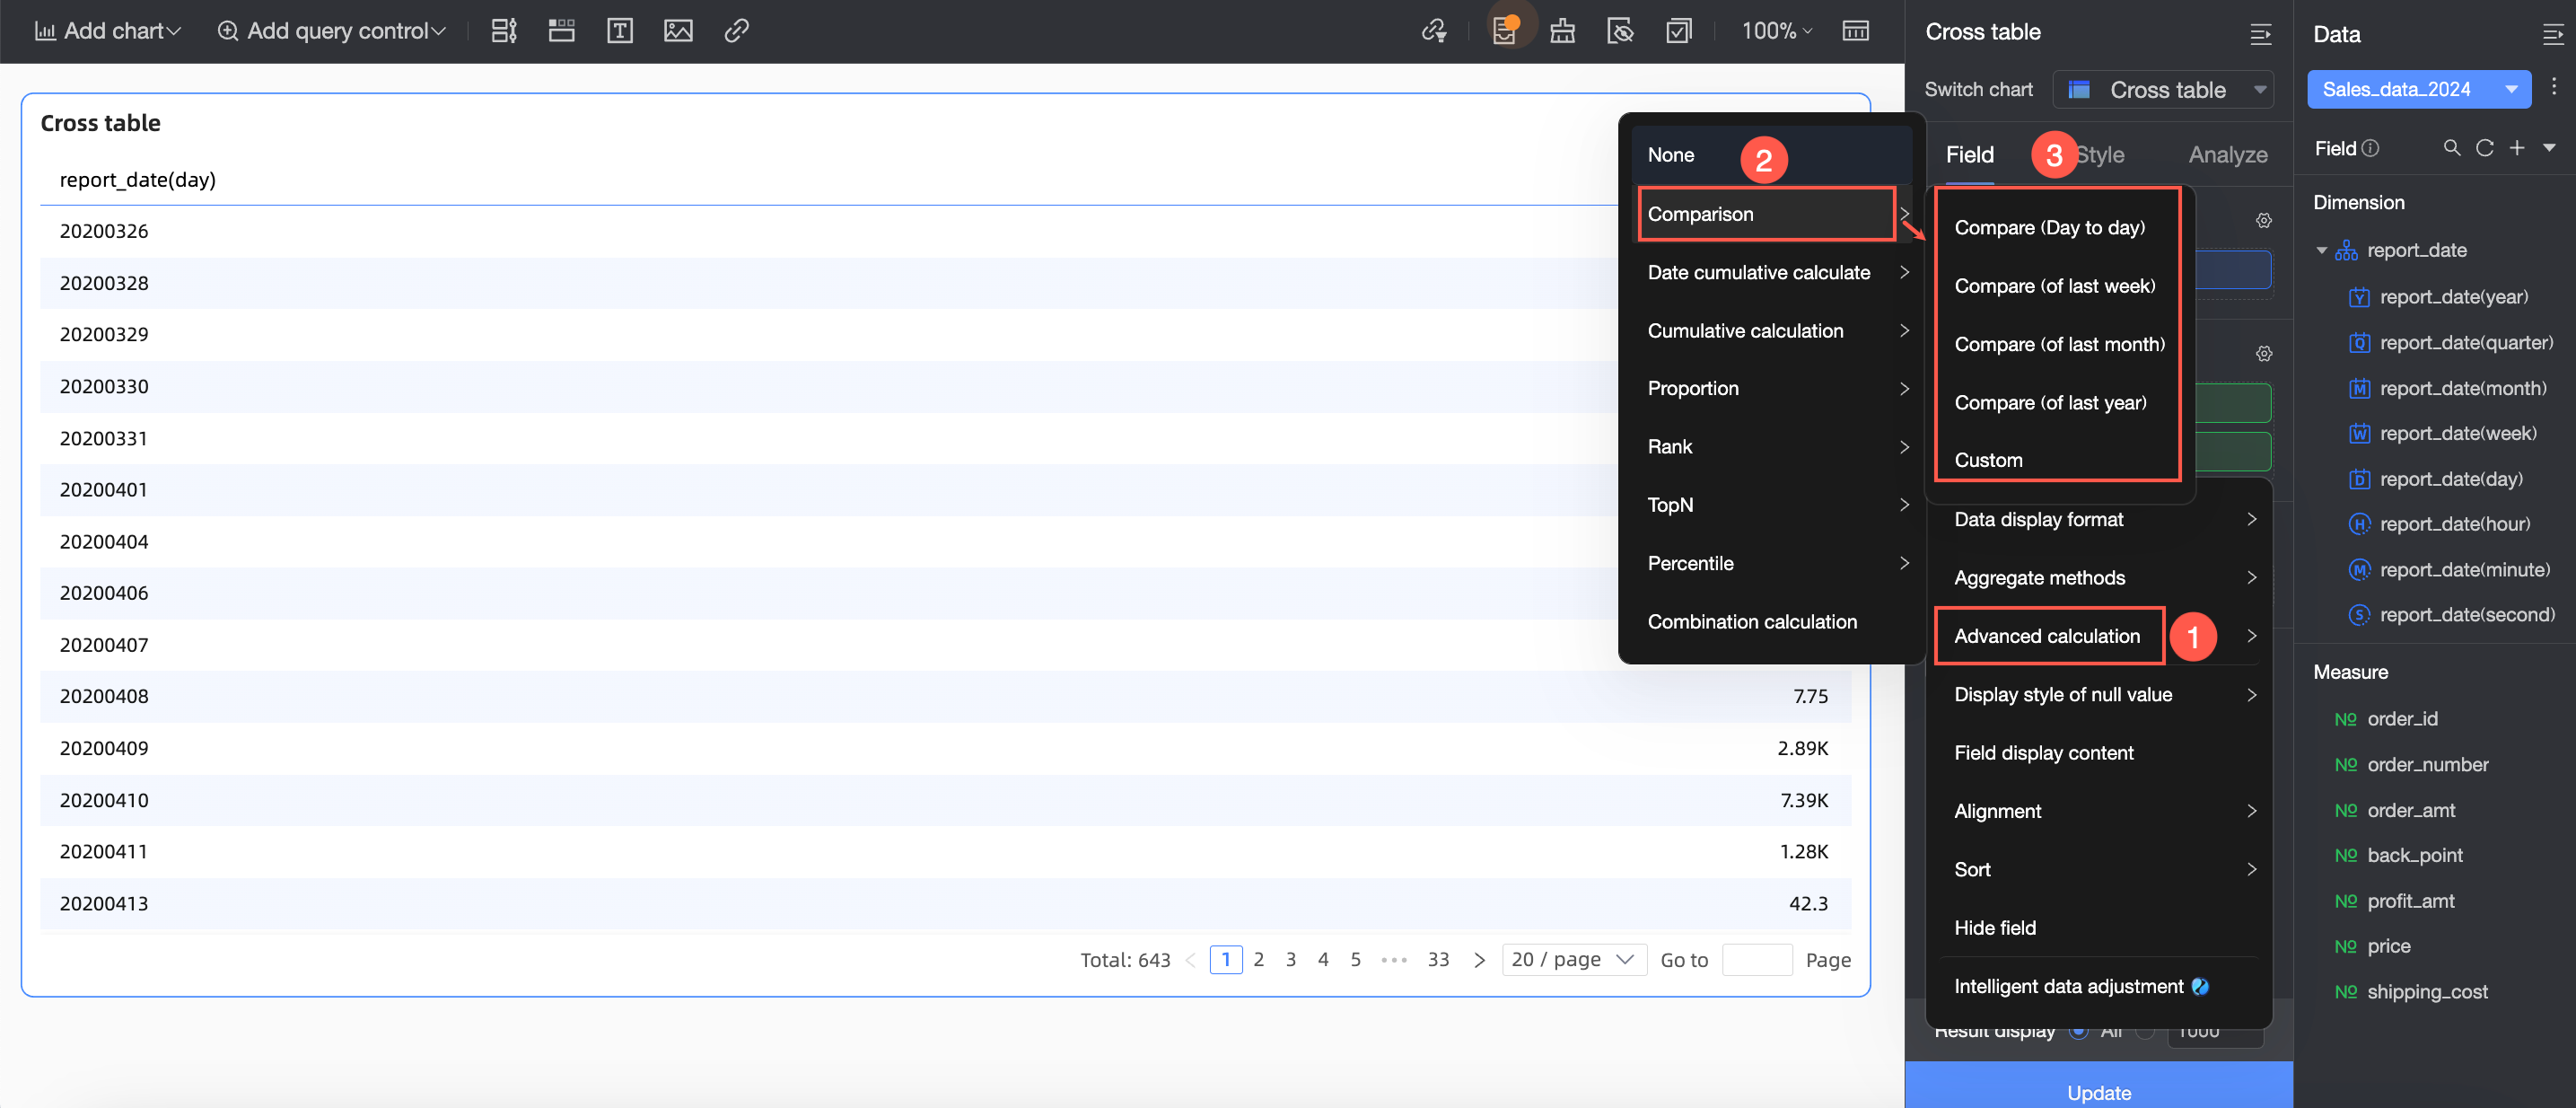
Features
Procedure
Hover over a measure field, click the
icon on the right, and then select advanced calculation > YoY and MoM comparison > Custom.
On the YoY and MoM comparison settings page, configure the following parameters.

Parameter
Description
Date field
The date field provides the basis for the comparison.
If the dimension contains multiple date fields, the comparison is based on the date field with the finest granularity.
If the dimension contains no date field, you can select one from the dataset or use a pre-configured date placeholder. The calculation is then based on the filter condition of the selected date field.
The date field supports the following granularities: day, week, month, quarter, and year.
Comparison type
The available options for comparison type depend on the selected date field. See YoY and MoM comparison support by date field for a complete list. Examples include:
Day-over-Day (DoD) comparison: Compares the current day with the previous day. For example, December 5, 2024 is compared with December 4, 2024.
Week-over-Week (WoW) comparison: Compares the current day with the same day of the previous week. For example, Thursday, December 5, 2024 is compared with Thursday, November 28, 2024.
Month-over-Month (MoM) comparison: Compares the current day with the same day of the previous month. For example, December 5, 2024 is compared with November 5, 2024.
Year-over-Year (YoY) comparison: Compares the current day with the same day of the previous year. For example, December 5, 2024 is compared with December 5, 2023.
dynamic period-over-period comparison: Configure this option if the chart's dimension does not include a date field. The comparison value is dynamically calculated based on the date range selected in the date filter control. For example, if the date filter is set to 2020-01-01 to 2020-01-10, the comparison period is 2019-12-22 to 2019-12-31.
Custom: Define a custom comparison period based on your business requirements.
NoteThe number entered for the lookback period must be a positive integer. The default is 1, and the maximum is 10,000.
Available granularities depend on the selected date field:
Day granularity: Day, Week, Month, Year.
Week granularity: Week, Year.
Month granularity: Month, Year.
Quarter granularity: Quarter, Year.
Year granularity: Year.
The calculation logic for custom comparisons is as follows:
If the chart uses a single date, the lookback is calculated from that date.
If the chart uses a date range, the lookback applies to the entire range.
For more information about the lookback logic for custom comparison dates, see filter period lookback logic.
Advanced settings: This option is available only when the date field uses day granularity. Use this option to set the comparison period to "Start of current month", "End of last month", "Start of current quarter", "End of last quarter", "Start of current year", or "End of last year".
Data settings
Data settings include actual value, difference, percentage difference, and ratio percentage:
actual value: The value from the previous period.
difference = Current period value - Previous period value
percentage difference = (Current period value - Previous period value) / Previous period value * 100%
If the percentage difference is negative, you can choose one of the following calculation formulas:
(Current period data / Previous period data - 1) * 100%: (Default)
1 - (Current period data / Previous period data) * 100%
Display as -
ratio percentage = (Current period value / Previous period value) * 100%
Example 1:
If today's GMV is 100, yesterday's GMV was 80, and you select Day-over-Day (DoD) comparison, the results are as follows:
GMV_DoD (actual value) = 80
GMV_DoD (difference) = 100 - 80 = 20
GMV_DoD (percentage difference) = (100 - 80) / 80 * 100% = 25%
GMV_DoD (ratio percentage) = (100 / 80) * 100% = 125%
Example 2:
If today's GMV is 100, yesterday's GMV was 120, and you select Day-over-Day (DoD) comparison, the results are as follows:
GMV_DoD (actual value) = 120
GMV_DoD (difference) = 100 - 120 = -20
GMV_DoD (percentage difference) = (100 - 120) / 120 * 100% = -16.67%
GMV_DoD (ratio percentage) = (100 / 120) * 100% = 83.33%
Same-period comparison
When you apply a filter condition to the date field, the resulting data defines the current period. The system then determines the comparison period by applying the lookback logic and retrieves data for that period.
For example, if the filter condition is 2022-01-02 and you perform a YoY comparison, the comparison period is 2021-01-02.
The same-period comparison option applies only when the filter condition uses a date field with day granularity.
When this option is selected, the comparison period is shifted back, and the day-granularity filter condition also shifts back accordingly. For example, with a day-level filter, selecting this option allows you to compare a period with the equivalent period in the previous month, such as comparing April 1–30, 2024 with March 1–30, 2024.
NoteIf the chart uses a day-granularity date field, same-period comparison is enabled by default.
A non-same-period comparison is performed if you do not select this option, or if the filter's granularity is not
day.In a non-same-period comparison, if both the filter and comparison granularities are
dayand the chart lacks a date field, the lookback compares full months. For example, the period September 1–30 is compared with August 1–31.For more details, see Day granularity - MoM comparison.
For details on the filter period lookback logic, see filter period lookback logic.
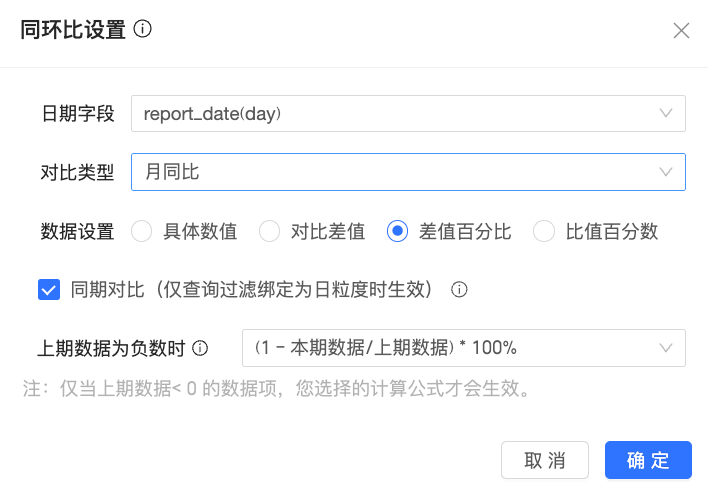


Quick configuration
Use the quick configuration option when a chart contains only one date field. The default settings are percentage difference and same-period comparison.
Hover over a measure field, click the icon, select advanced calculation > YoY and MoM comparison, and then choose a pre-defined comparison type.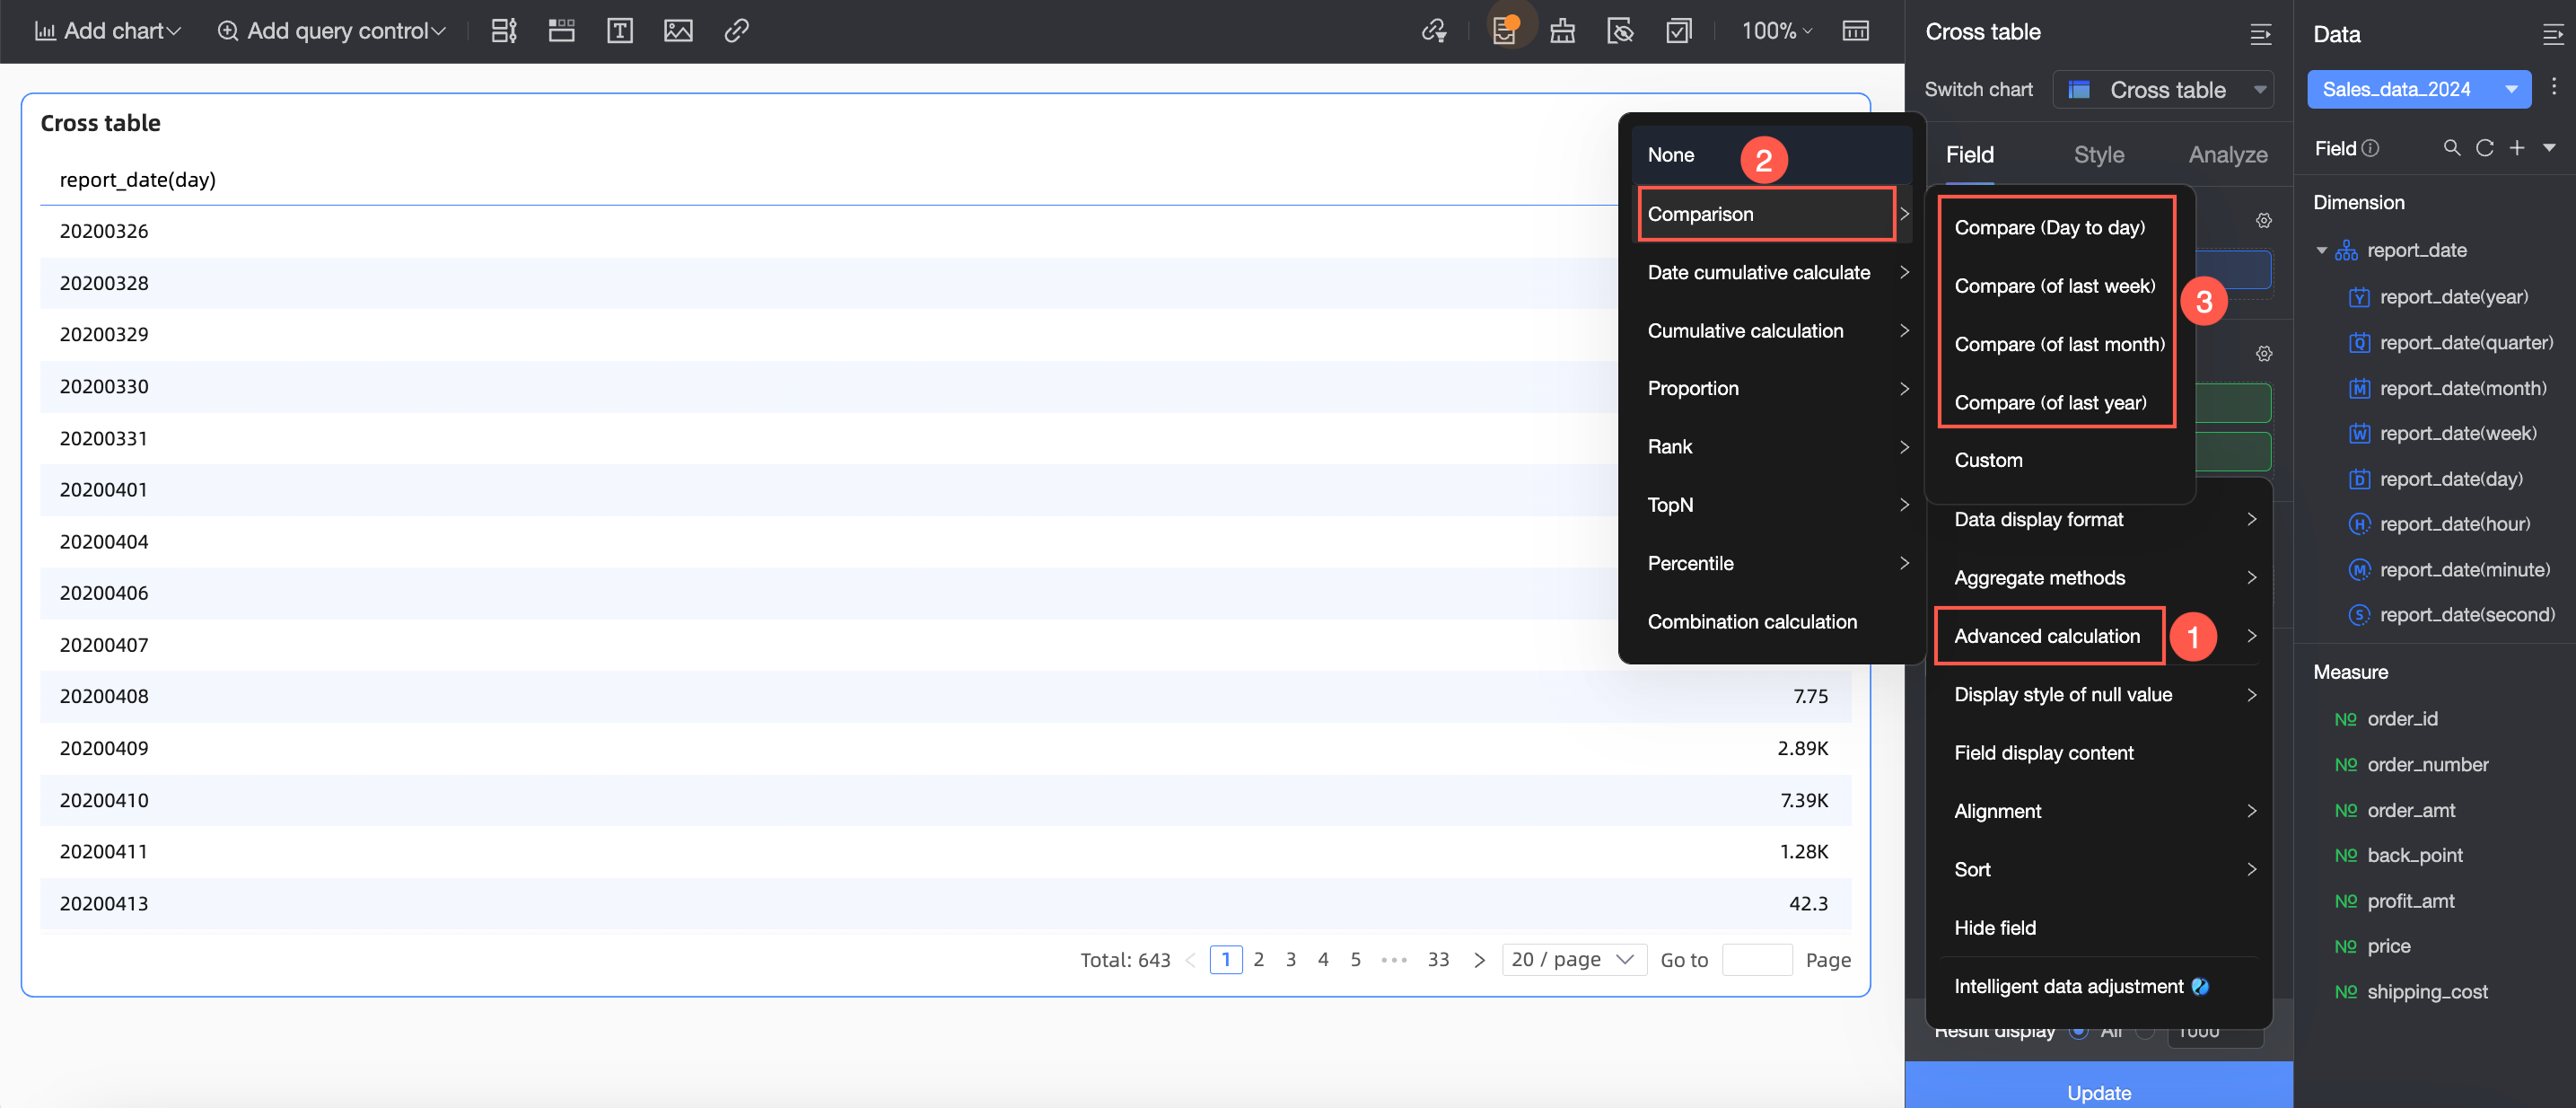
The available quick configuration types vary depending on the date granularity. For more information, see YoY and MoM comparison support by date field.
Filter period lookback logic
If the filter condition granularity differs from the comparison date granularity, the comparison period is not shifted back.
If the filter condition granularity matches the comparison date granularity, the period is shifted back by default (a full-period lookback).
A weekly filter condition is flattened to day granularity before the lookback is applied.
A full-period comparison is performed when the filter condition granularity is greater than or equal to the comparison granularity (except for week granularity). The logic is described below. You can verify this logic with Scenario 1 in Week granularity - YoY comparison.
When you configure a Custom comparison, the number of lookback periods changes to the specified value, but the rest of the calculation logic remains the same.
Comparison date granularity | Comparison type | Lookback logic | Filter condition granularity | Current period | Comparison period | ||
Year | YoY comparison | Look back 1 year | Year | 2020–2024 | 2019–2023 | 2019-01-01 to 2023-12-31 | |
Quarter | QoQ comparison | Look back 1 quarter | Year | 2020–2024 | 2019 Q4–2024 Q3 | 2019-10-01 to 2024-09-30 | |
Quarter | 2020 Q1–2024 Q2 | 2019 Q4–2024 Q1 | 2019-10-01 to 2024-03-31 | ||||
YoY comparison | Look back 1 year | Year | 2020–2024 | 2019–2023 | 2019-01-01 to 2023-12-31 | ||
Quarter | 2020 Q1–2024 Q2 | 2019 Q1–2023 Q2 | 2019-01-01 to 2023-06-30 | ||||
Month | MoM comparison | Look back 1 month | Year | 2020–2024 | 2019-12 to 2024-11 | 2019-12-01 to 2024-11-30 | |
Quarter | 2020 Q1–2024 Q3 | 2019-12 to 2024-05 | 2019-12-01 to 2024-05-31 | ||||
Month | 2020-01 to 2020-03 | 2019-12 to 2020-02 | 2019-12-01 to 2020-02-29 | ||||
YoY comparison | Look back 1 year | Year | 2020–2024 | 2019–2023 | 2019-01-01 to 2023-12-31 | ||
Quarter | 2020 Q1–2024 Q2 | 2019 Q1–2023 Q2 | 2019-01-01 to 2023-06-30 | ||||
Month | 2020-01 to 2020-03 | 2019-01 to 2019-03 | 2019-01-01 to 2019-03-31 | ||||
Week | WoW comparison | Look back 1 week | Year | 2020–2024 | 2019-12-25 to 2024-12-24 | ||
Quarter | 2020 Q1–2024 Q4 | 2019-12-25 to 2024-12-24 | |||||
Month | 2020-01 to 2020-03 | 2019-12-25 to 2020-03-24 | |||||
Week | Week 11, 2020–Week 35, 2020 | Week 10, 2020–Week 34, 2020 | 2020-03-02 to 2020-08-23 | ||||
YoY comparison | Look back 1 year based on the current week number and day of the week | Year | 2020–2024 | Wed, Week 1, 2020–Tue, Week 1, 2025 | Wed, Week 1, 2019–Tue, Week 1, 2024 | 2019-01-02 to 2024-01-02 | |
Quarter | 2020 Q1–2024 Q4 | Wed, Week 1, 2020–Tue, Week 1, 2025 | Wed, Week 1, 2019–Tue, Week 1, 2024 | 2019-01-02 to 2024-01-02 | |||
Month | 2020-01 to 2020-03 | Wed, Week 1, 2020–Tue, Week 14, 2020 | Wed, Week 1, 2019–Tue, Week 14, 2019 | 2019-01-02 to 2019-04-02 | |||
Week | Week 11, 2020–Week 35, 2020 | Week 11, 2019–Week 35, 2019 | 2019-03-11 to 2019-09-01 | ||||
Day | DoD comparison | Look back 1 day | Year | 2020–2024 | 2019-12-31 to 2024-12-30 | ||
Quarter | 2020 Q1–2024 Q2 | 2019-12-31 to 2024-06-29 | |||||
Month | 2020-01 to 2020-03 | 2019-12-31 to 2020-03-30 | |||||
Week | Week 11, 2020–Week 35, 2020 | 2020-03-09 to 2020-08-30 | 2020-03-08 to 2020-08-29 | ||||
Day | 2020-01-01 to 2020-05-22 | 2019-12-31 to 2020-05-21 | |||||
WoW comparison | Look back 1 week | Year | 2020–2024 | 2019-12-25 to 2024-12-24 | |||
Quarter | 2020 Q1–2024 Q4 | 2019-12-25 to 2024-12-24 | |||||
Month | 2020-01 to 2020-03 | 2019-12-25 to 2020-03-24 | |||||
Week | Week 11, 2020–Week 35, 2020 | Week 10, 2020–Week 34, 2020 | 2020-03-02 to 2020-08-23 | ||||
Day | 2020-01-01 to 2020-05-22 | 2019-12-25 to 2020-05-15 | |||||
MoM comparison | Look back 1 month | Year | 2020–2024 | 2019-12 to 2024-11 | 2019-12-01 to 2024-11-30 | ||
Quarter | 2020 Q1–2024 Q3 | 2019-12 to 2024-08 | 2019-12-01 to 2024-08-31 | ||||
Month | 2020-01 to 2020-03 | 2019-12 to 2020-02 | 2019-12-01 to 2020-02-29 | ||||
Week | Week 11, 2020–Week 35, 2020 | 2020-03-09 to 2020-08-30 | 2020-02-09 to 2020-07-30 | ||||
Day | 2020-01-01 to 2020-05-22 | 2019-12-01 to 2020-04-22 | |||||
YoY comparison | Look back 1 year | Year | 2020–2024 | 2019–2023 | 2019-01-01 to 2023-12-31 | ||
Quarter | 2020 Q1–2024 Q2 | 2019 Q1–2023 Q2 | 2019-01-01 to 2023-06-30 | ||||
Month | 2020-01 to 2020-03 | 2019-01 to 2019-03 | 2019-01-01 to 2019-03-31 | ||||
Week | Week 11, 2020–Week 35, 2020 | 2020-03-09 to 2020-08-30 | 2019-03-09 to 2019-08-30 | ||||
Day | 2020-01-01 to 2020-05-22 | 2019-01-01 to 2019-05-22 | |||||
A partial-period comparison is performed when the filter condition granularity is less than the comparison granularity. The logic is described below. You can verify this logic with Scenario 2 in Week granularity - YoY comparison.
When you configure a Custom comparison, the number of lookback periods changes to the specified value, but the rest of the calculation logic remains the same.
Comparison date granularity | Comparison type | Lookback logic | Filter condition granularity | Current period | Comparison period | ||
Year | YoY comparison | Look back 1 year | Quarter | 2020 Q3–2024 Q2 | 2019 Q3–2023 Q2 | 2019-07-01 to 2023-06-30 | |
Month | 2020-01 to 2020-02 | 2019-01 to 2019-02 | 2019-01-01 to 2019-02-28 | ||||
Week | Week 11, 2020–Week 35, 2020 | 2020-03-09 to 2020-08-30 | 2019-03-09 to 2019-08-30 | ||||
Day | 2020-01-01 to 2020-05-22 | 2019-01-01 to 2019-05-22 | |||||
Quarter | QoQ comparison | Look back 1 quarter | Month | 2020-02 to 2020-06 | 2019-11 to 2020-03 | 2019-11-01 to 2020-03-31 | |
Week | Week 11, 2020–Week 35, 2020 | 2020-03-09 to 2020-08-30 | 2019-12-09 to 2020-05-30 | ||||
Day | 2020-01-01 to 2020-05-22 | 2019-10-01 to 2020-02-22 | |||||
YoY comparison | Look back 1 year | Month | 2020-01 to 2020-02 | 2019-01 to 2019-02 | 2019-01-01 to 2019-02-28 | ||
Week | Week 11, 2020–Week 35, 2020 | 2020-03-09 to 2020-08-30 | 2019-03-09 to 2019-08-30 | ||||
Day | 2020-01-01 to 2020-05-22 | 2019-01-01 to 2019-05-22 | |||||
Month | MoM comparison | Look back 1 month | Week | Week 11, 2020–Week 35, 2020 | 2020-03-09 to 2020-08-30 | 2020-02-09 to 2020-07-30 | |
Day | 2020-01-01 to 2020-05-22 | 2019-12-01 to 2020-04-22 | |||||
YoY comparison | Look back 1 year | Week | Week 11, 2020–Week 35, 2020 | 2020-03-09 to 2020-08-30 | 2019-03-09 to 2019-08-30 | ||
Day | 2020-01-01 to 2020-05-22 | 2019-01-01 to 2019-05-22 | |||||
Week | WoW comparison | Look back 1 week | Day | 2020-01-01 to 2020-05-22 | 2019-12-25 to 2020-05-15 | ||
YoY comparison | Look back 1 year based on the current week number and day of the week | Day | 2020-01-01 to 2020-05-22 | Wed, Week 1, 2020–Fri, Week 21, 2020 | Wed, Week 1, 2019–Fri, Week 21, 2019 | 2019-01-02 to 2019-05-24 | |
Examples
Single date field per dimension
Daily granularity
When a dimension contains only one date field, the metric's comparison feature defaults to the granularity of that date field.
This example shows how to configure a period-over-period comparison for a measure in a crosstab.
On the Field tab of the dashboard editing page, add fields and configure comparisons.
Add fields.
In the Dimension list, find order_date(day), then double-click or drag it to the Rows area.
In the Measure list, find
order_amount, then double-click or drag it to the Columns area.NoteTo view the order amount and the Compare (Day to Day), Compare (Week to Week), Compare (Month to Month), and Compare (Year to Year) values, add five
order_amountmeasures to the Columns area.
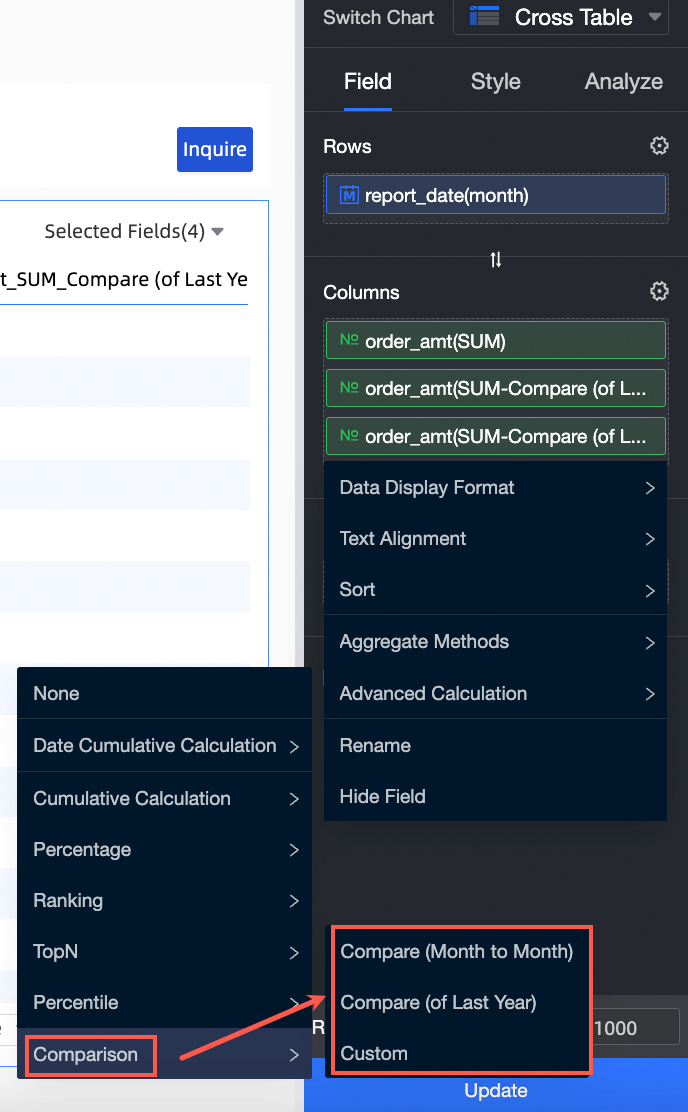
Hover over the order_amount measure, click the
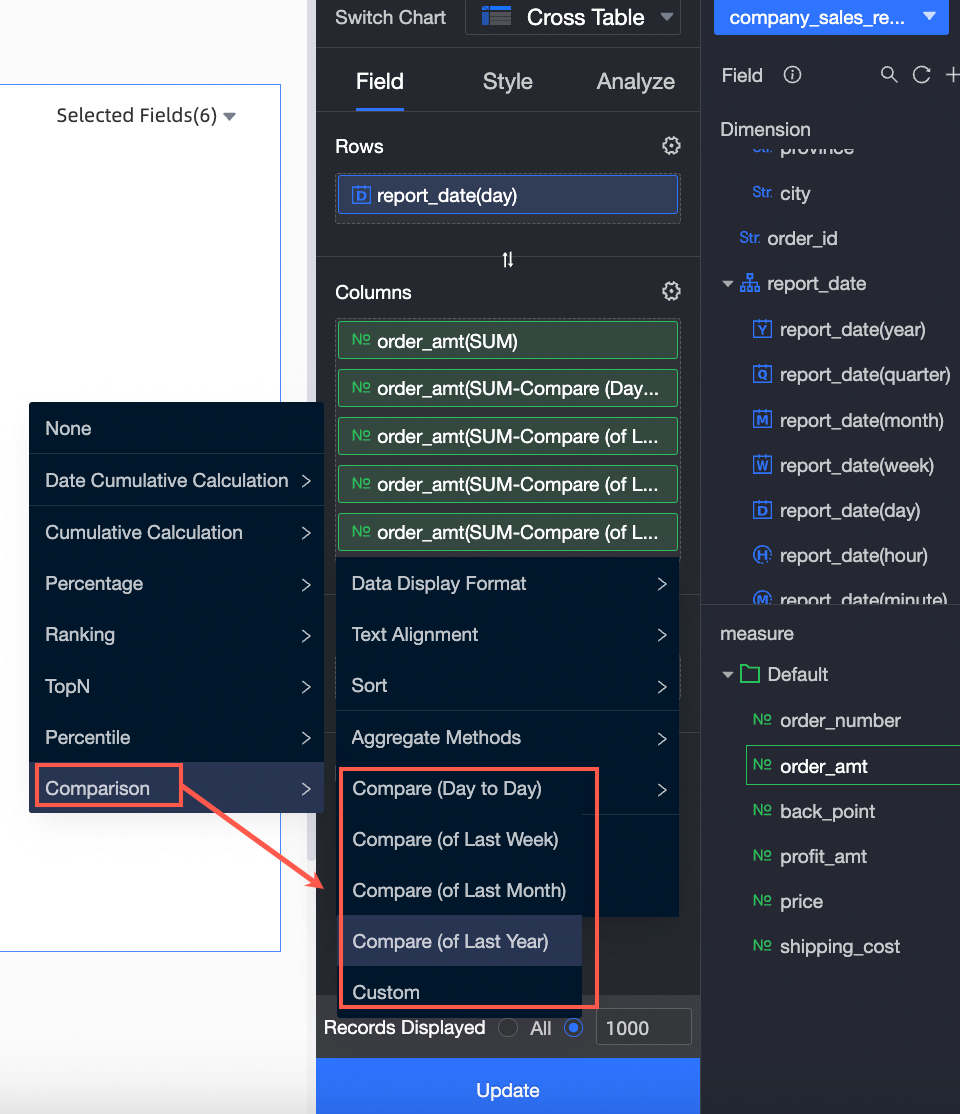
icon on the right, and select Comparison > Comparison > Compare (Day to Day).Repeat this step for the remaining
order_amountmeasures, setting their comparison types toCompare (Week to Week),Compare (Month to Month), andCompare (Year to Year), respectively.NoteBy default, the comparison is set to Percent Difference From. To change this, select Custom on the comparison settings page.
Click Update.
(Optional)
Configure filters.
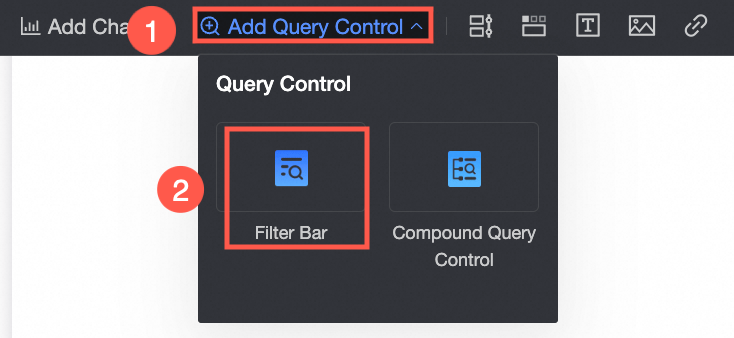
To filter data by a specific time range, follow these steps. This example shows how to add a filter bar for the
order_date(day)field.Add a filter bar.
In the controls menu, select Standard.
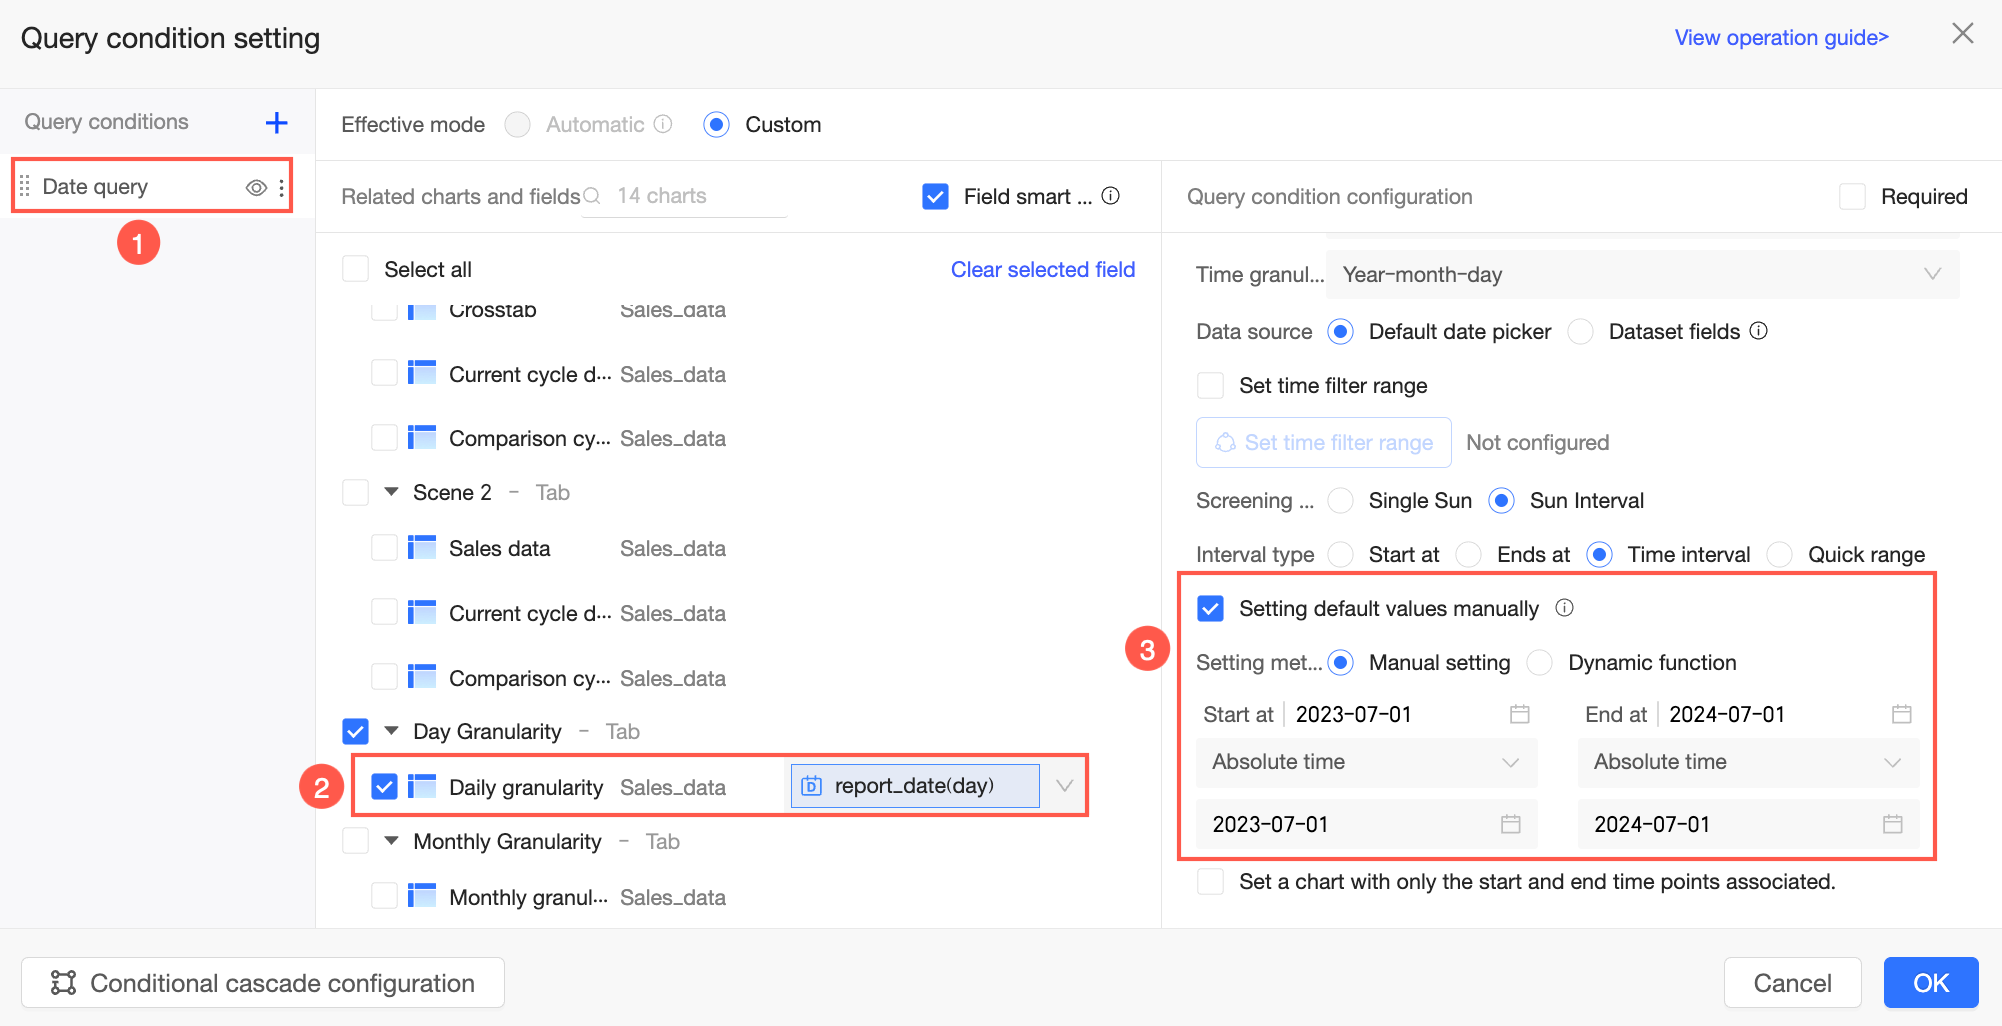
Set the filters.
NoteThe date field in the filter bar must match the date field used for the comparison.
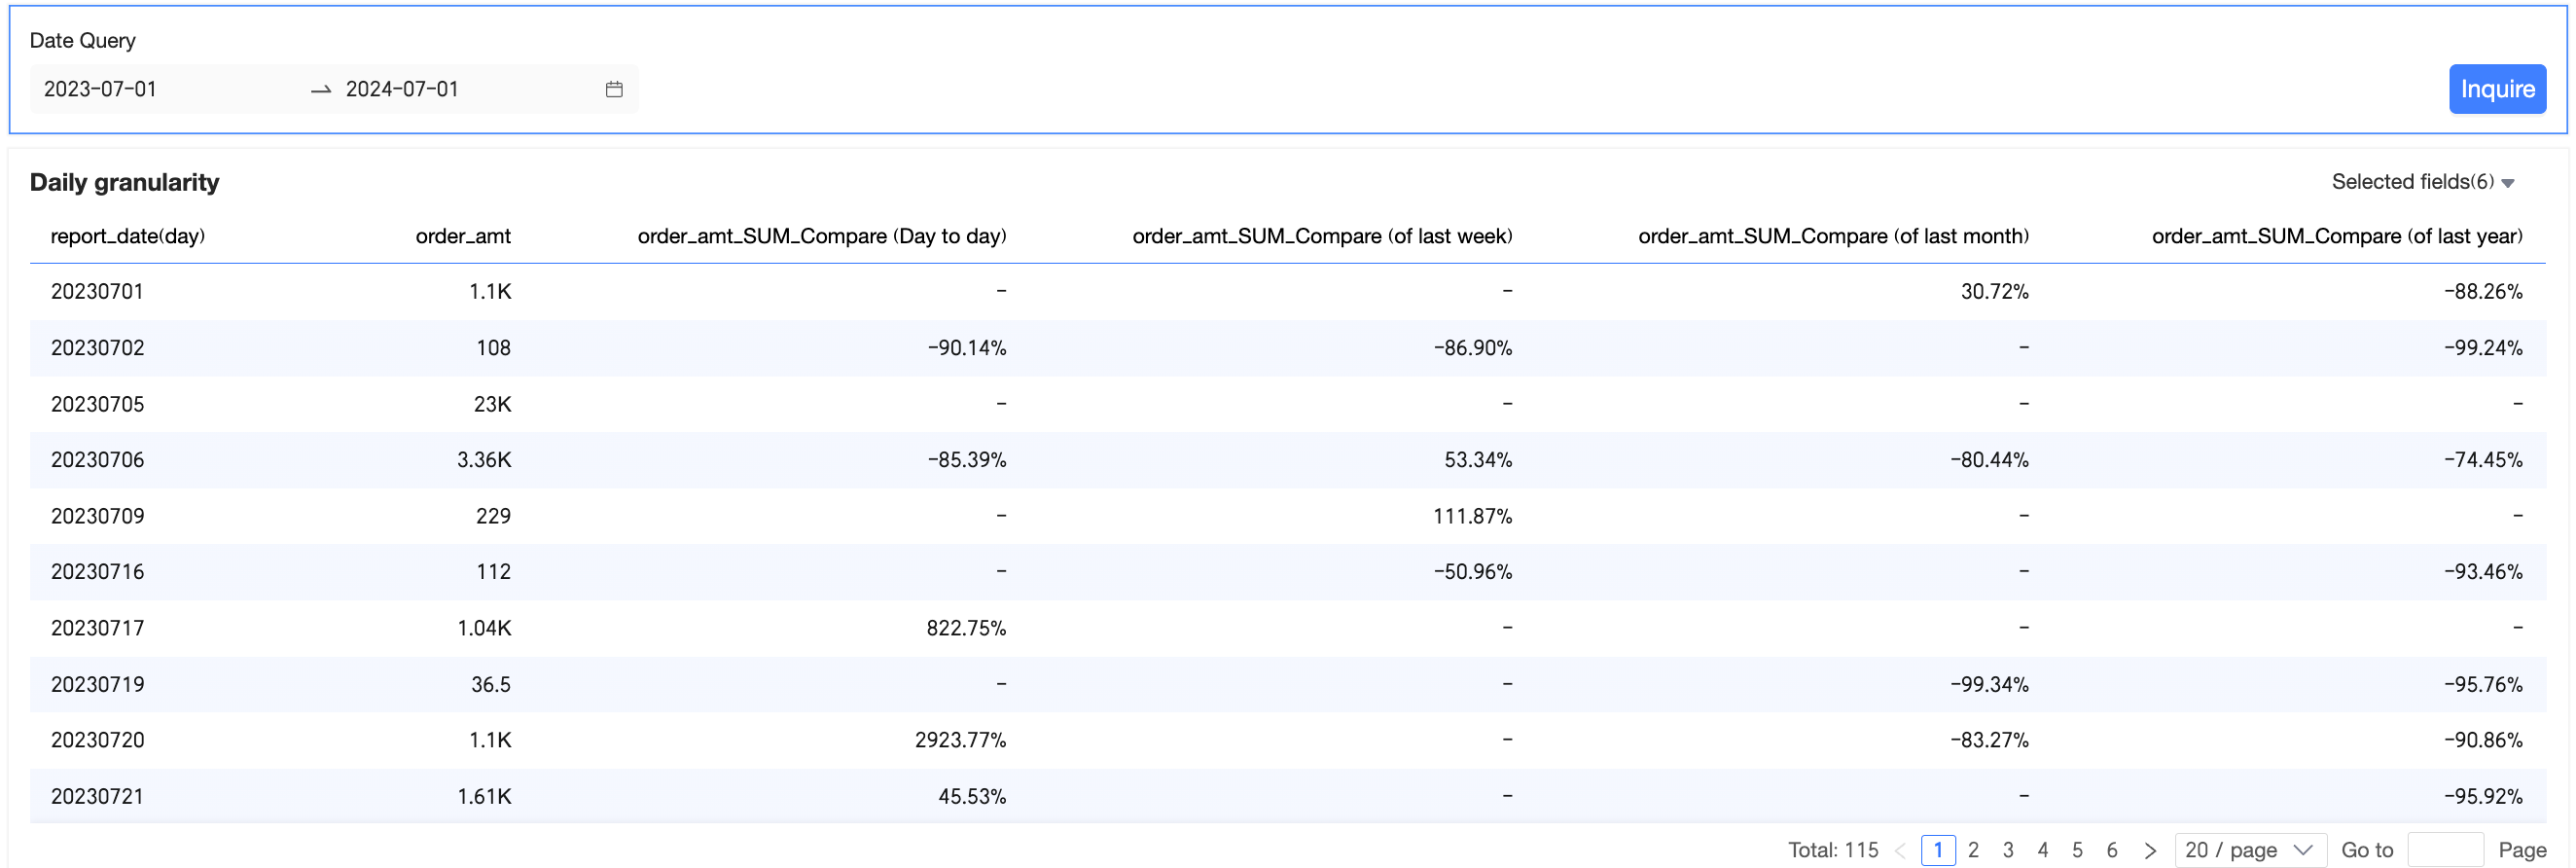
On the dashboard editing page, click Query.
You can also query different periods by modifying the date range.

Monthly granularity
If a dimension has only one date field, the comparison feature for the measure field defaults to the granularity of that date field.
In this example, you will learn how to configure the comparison feature for a measure in a cross table.
On the Field tab of the dashboard edit page, add fields and configure comparisons.
Add fields.
From the Dimension list, double-click or drag Order date (month) to the Rows area.
From the Measure list, double-click or drag Order amount to the Columns area.
NoteTo view the Order amount and its values for Compare (Month to Month) and Compare (Year-over-Year), add four Order amount measures to the Columns area.
Hover over the Order amount measure, click the
icon on the right, and select Advanced Calculation -> Comparison -> Compare (Month to Month).Repeat this step to set the comparison types for the other Order amount measures to Compare (Month to Month) and Compare (Year-over-Year).
NoteWhen you set a comparison, the data setting defaults to Percent Difference From. You can change this by selecting Custom Comparison on the comparison settings page.
Click Update.
(Optional)
Add and configure filters.
NoteThe date field in the filter bar must match the date field used for the comparison.
On the dashboard edit page, select a time range and click Query.
For example, if you filter for data from 2024-01 to 2024-12, the system automatically calculates the data for Compare (Month to Month) and Compare (Year-over-Year).


Multiple date fields in a dimension
If a dimension contains multiple date fields, the system calculates year-over-year and sequential comparisons using the field with the finest granularity. For example, if a dimension has date fields with day, week, month, quarter, and year granularities, the calculation uses only the day-granularity field, excluding coarser ones.
This example demonstrates how to configure a period-over-period comparison in a cross table.
On the Field tab of the dashboard edit page, add fields.
From the Dimension list, double-click or drag shipping_date(day) and then shipping_date(month) to the Rows area.
From the Measure list, double-click or drag order_amount to the Columns area.
Hover over the measure field, click the
icon on the right, and choose Advanced Calculation > Comparison > Custom.On the Comparison Settings page, configure the following parameters.
Click OK.
Add and configure a filter bar.
On the dashboard edit page, select a time range and click Query.

No date field in dimension
Time granularity - day-over-day
Year-over-year (YoY) and month-over-month (MoM) calculations account for hours, minutes, and seconds.
Since hour-minute-second granularity lacks date information, you cannot directly configure sequential and year-over-year comparisons. As a workaround, you can perform a day-over-day comparison to compare data with the same time on the previous day. The following example demonstrates how to apply this workaround using a crosstab.
On the dashboard edit page, add fields on the Fields tab.
From the Dimensions list, double-click or drag Date (minute) to the Rows section.
From the Measures list, double-click or drag Order Amount to the Columns section.
Hover over the measure field, click the
icon on the right, and select advanced calculation > YoY and MoM comparison > custom.On the YoY and MoM comparison settings page, configure the following parameters.
Click OK.
Configure query conditions.
On the dashboard edit page, select a query time range and click query.
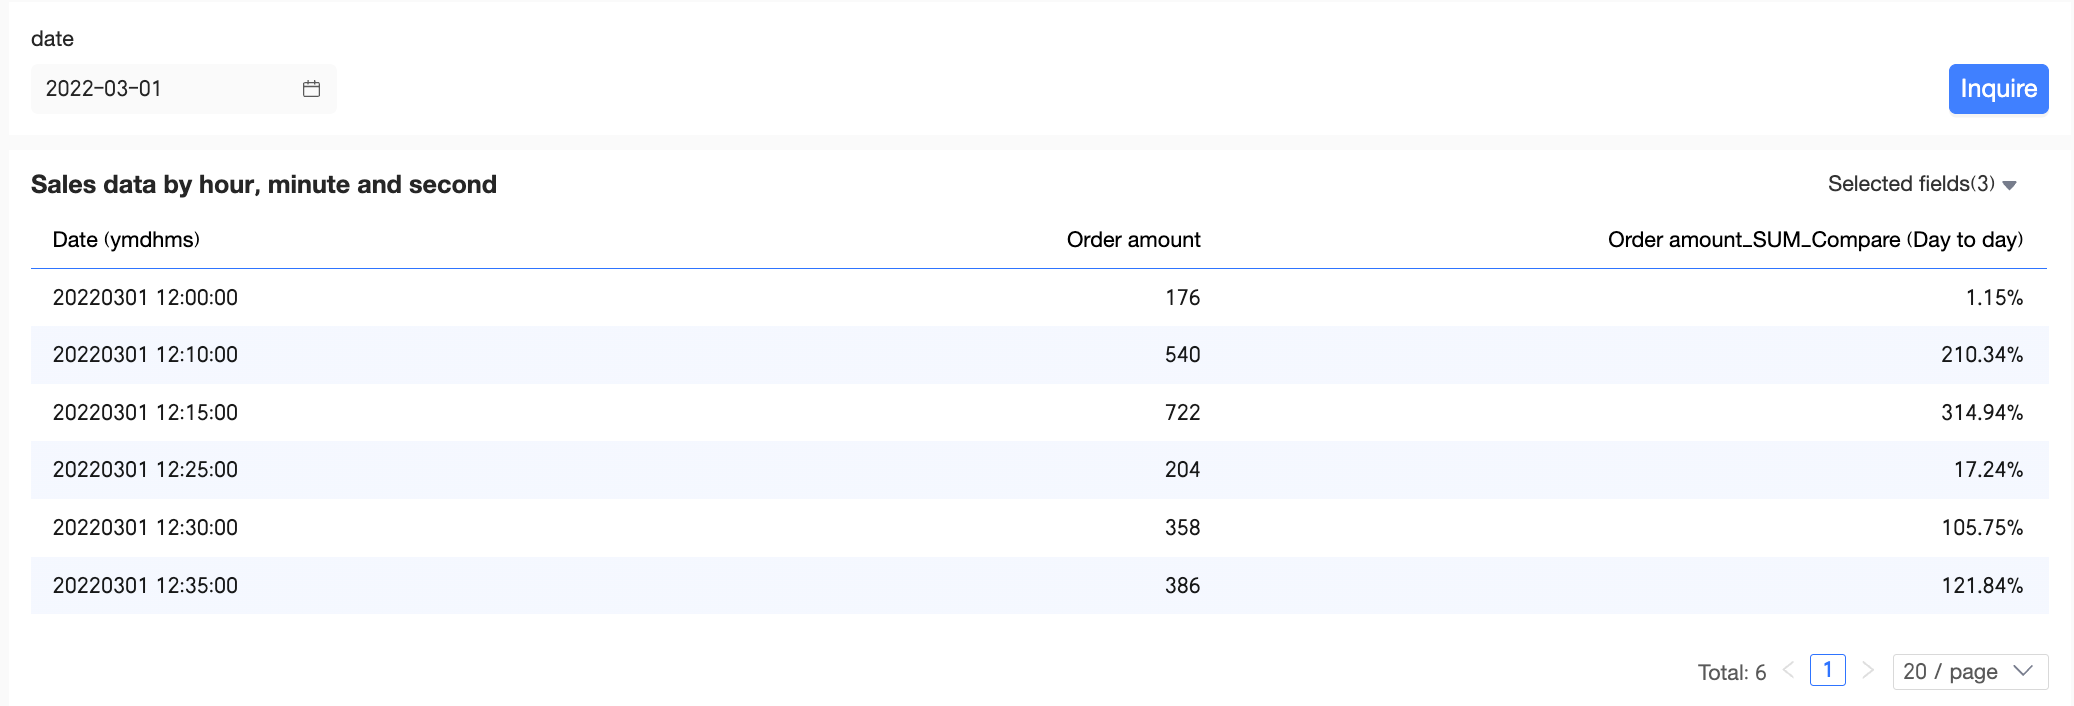
Day-over-day change
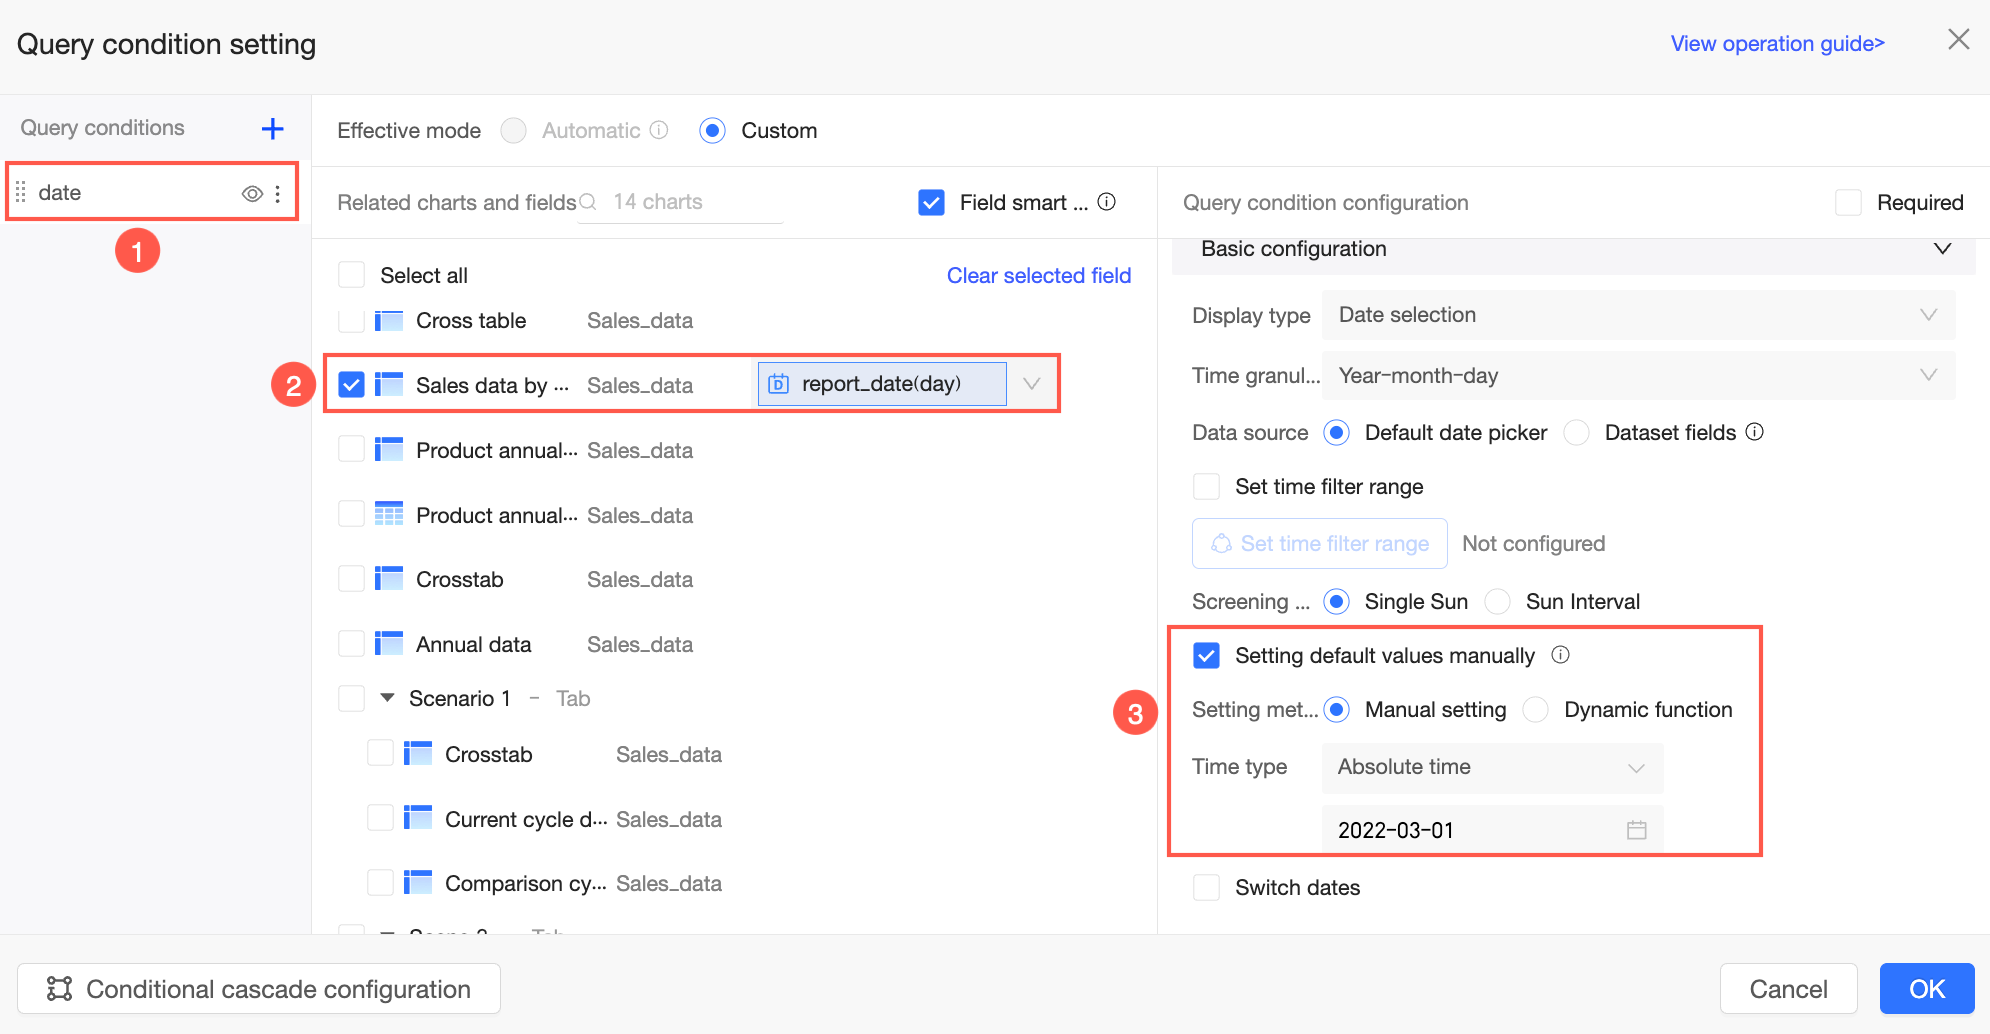
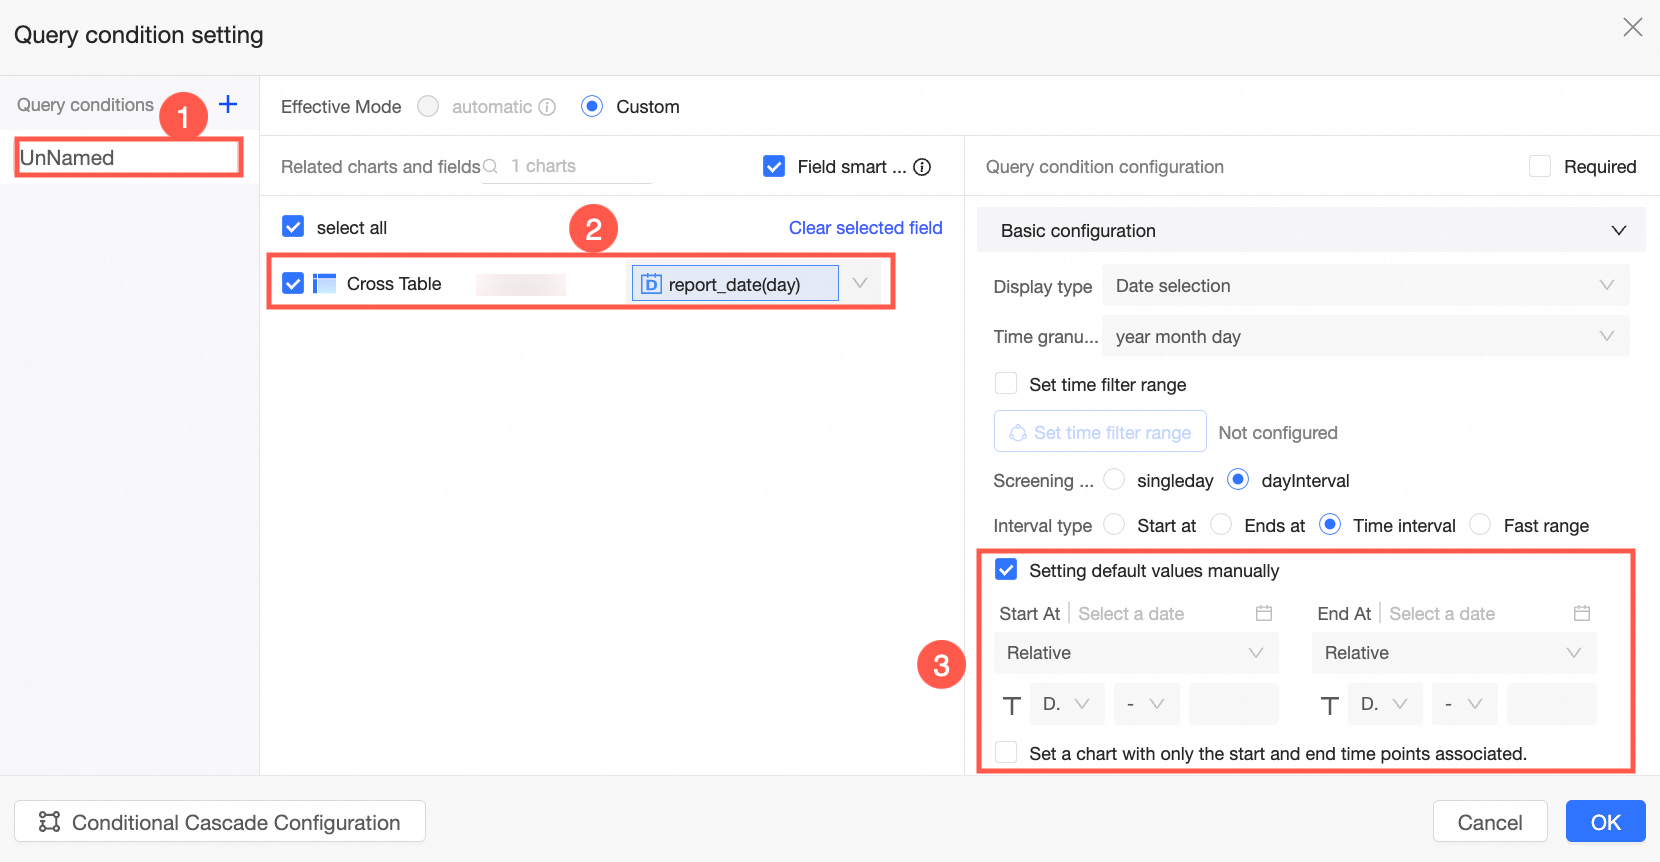
If the dimension does not contain a date field, select a date field in the associated query control. Then, on the YoY and MoM settings page, select a comparison date with the same time granularity as the date field in the query control to configure YoY and MoM.
This example shows you how to configure YoY and MoM comparisons in a crosstab.
On the Field tab of the dashboard edit page, add fields and configure the comparison.
Add fields.
In the Dimension list, find area, and double-click or drag it to the Rows section.
In the Measure list, find
order amount, and double-click or drag it to the Columns section.
Hover over the
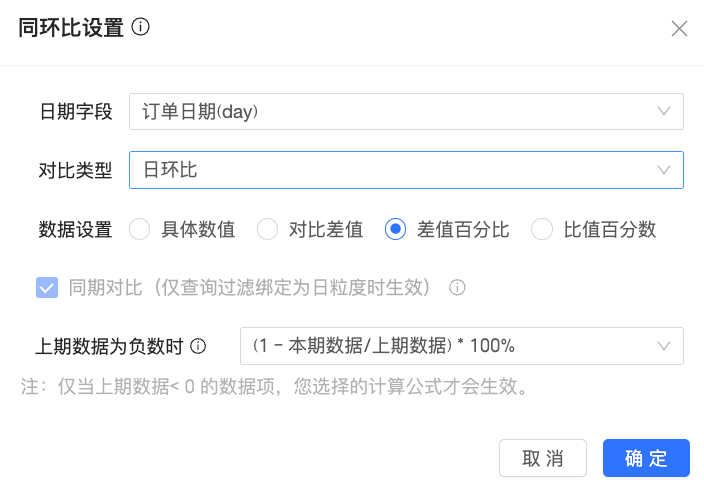
order amountmeasure, click the icon on the right, then select Advanced calculation > Comparison > Custom.On the Comparison Settings page, configure the date field, comparison type, and data settings.
In this example, set the comparison date to
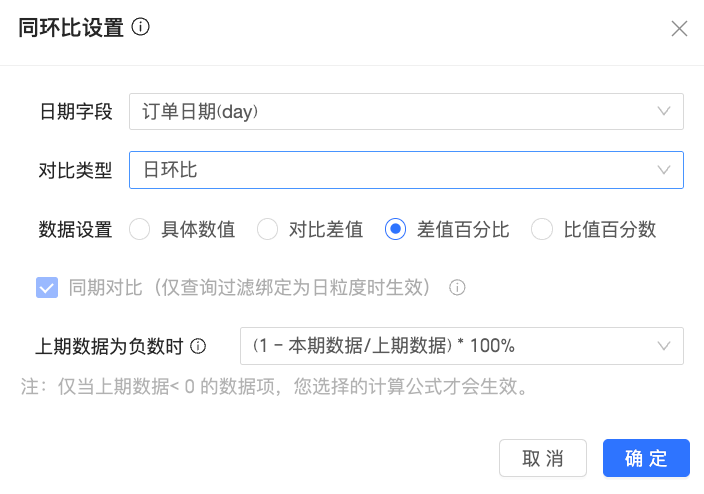
order_date(day), the comparison type to Day-over-day, and the data setting to Percent Difference From.NoteWhen you configure a comparison, the default data setting is Percent Difference From.
Click OK.
Add and configure filters.
NoteThe date field in the filter bar must match the comparison date field.
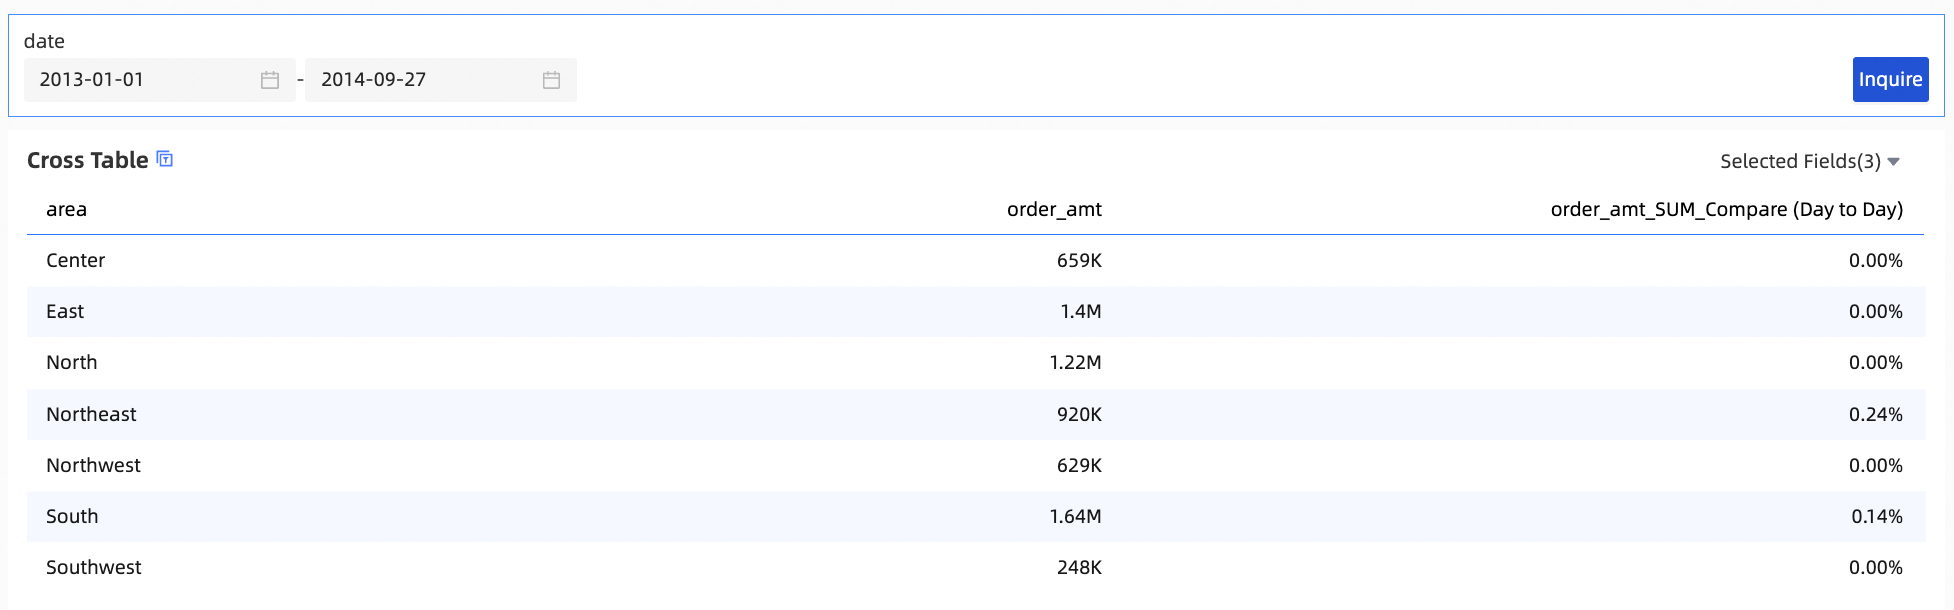
Click Query.
You can also modify the date range and run a query.
MoM by day
To set up a period-over-period comparison for a dimension without a date field, select a date field from the associated query control, and on the period-over-period settings page, select a comparison date with the same time granularity.
This example shows how to configure YoY and MoM comparisons in a crosstab.
On the Fields tab of the dashboard edit page, add fields and configure the YoY and MoM comparison.
Add fields.
From the Dimensions list, double-click or drag Region to the Rows section.
From the Measures list, double-click or drag Order Amount to the Columns section.
Hover over the Order Amount measure, click the
icon on the right, and select Advanced Calculation > YoY and MoM Comparison > Custom.On the YoY and MoM Comparison Settings page, configure the date field, comparison type, and data settings.
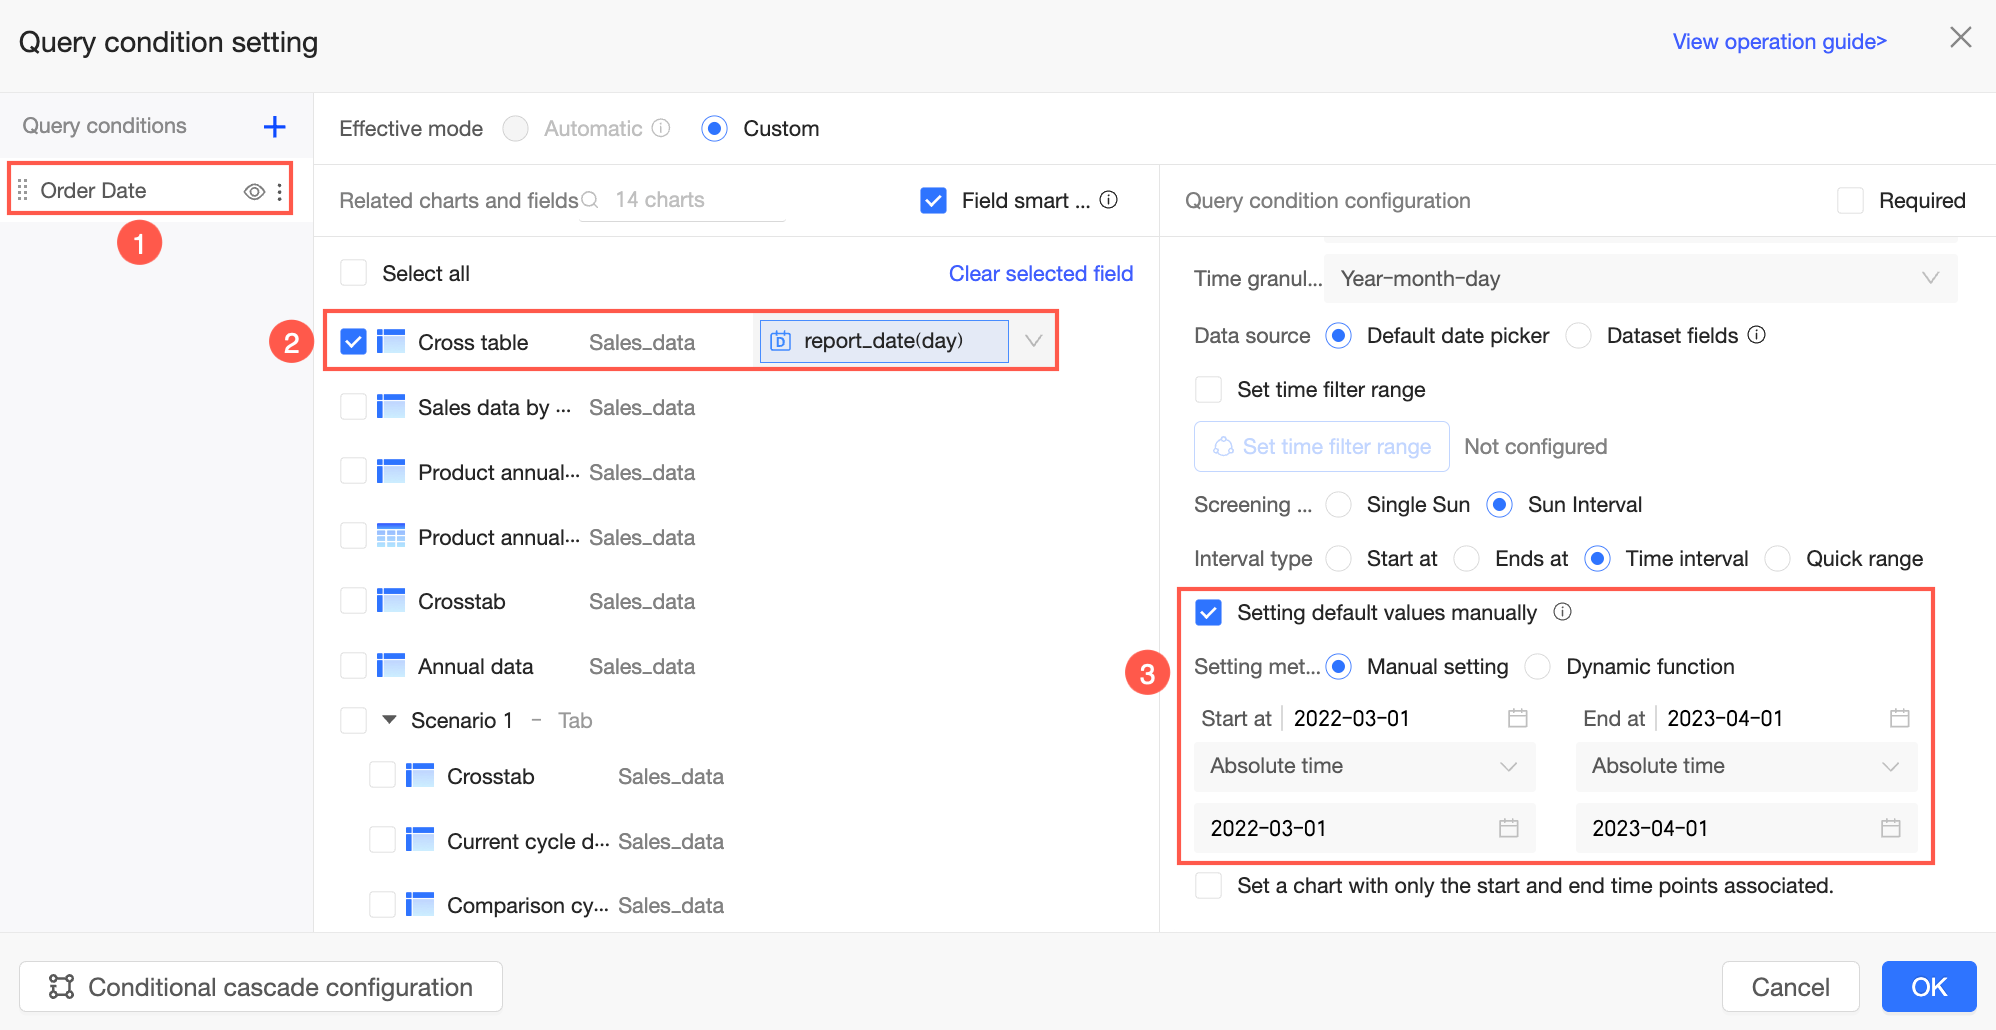
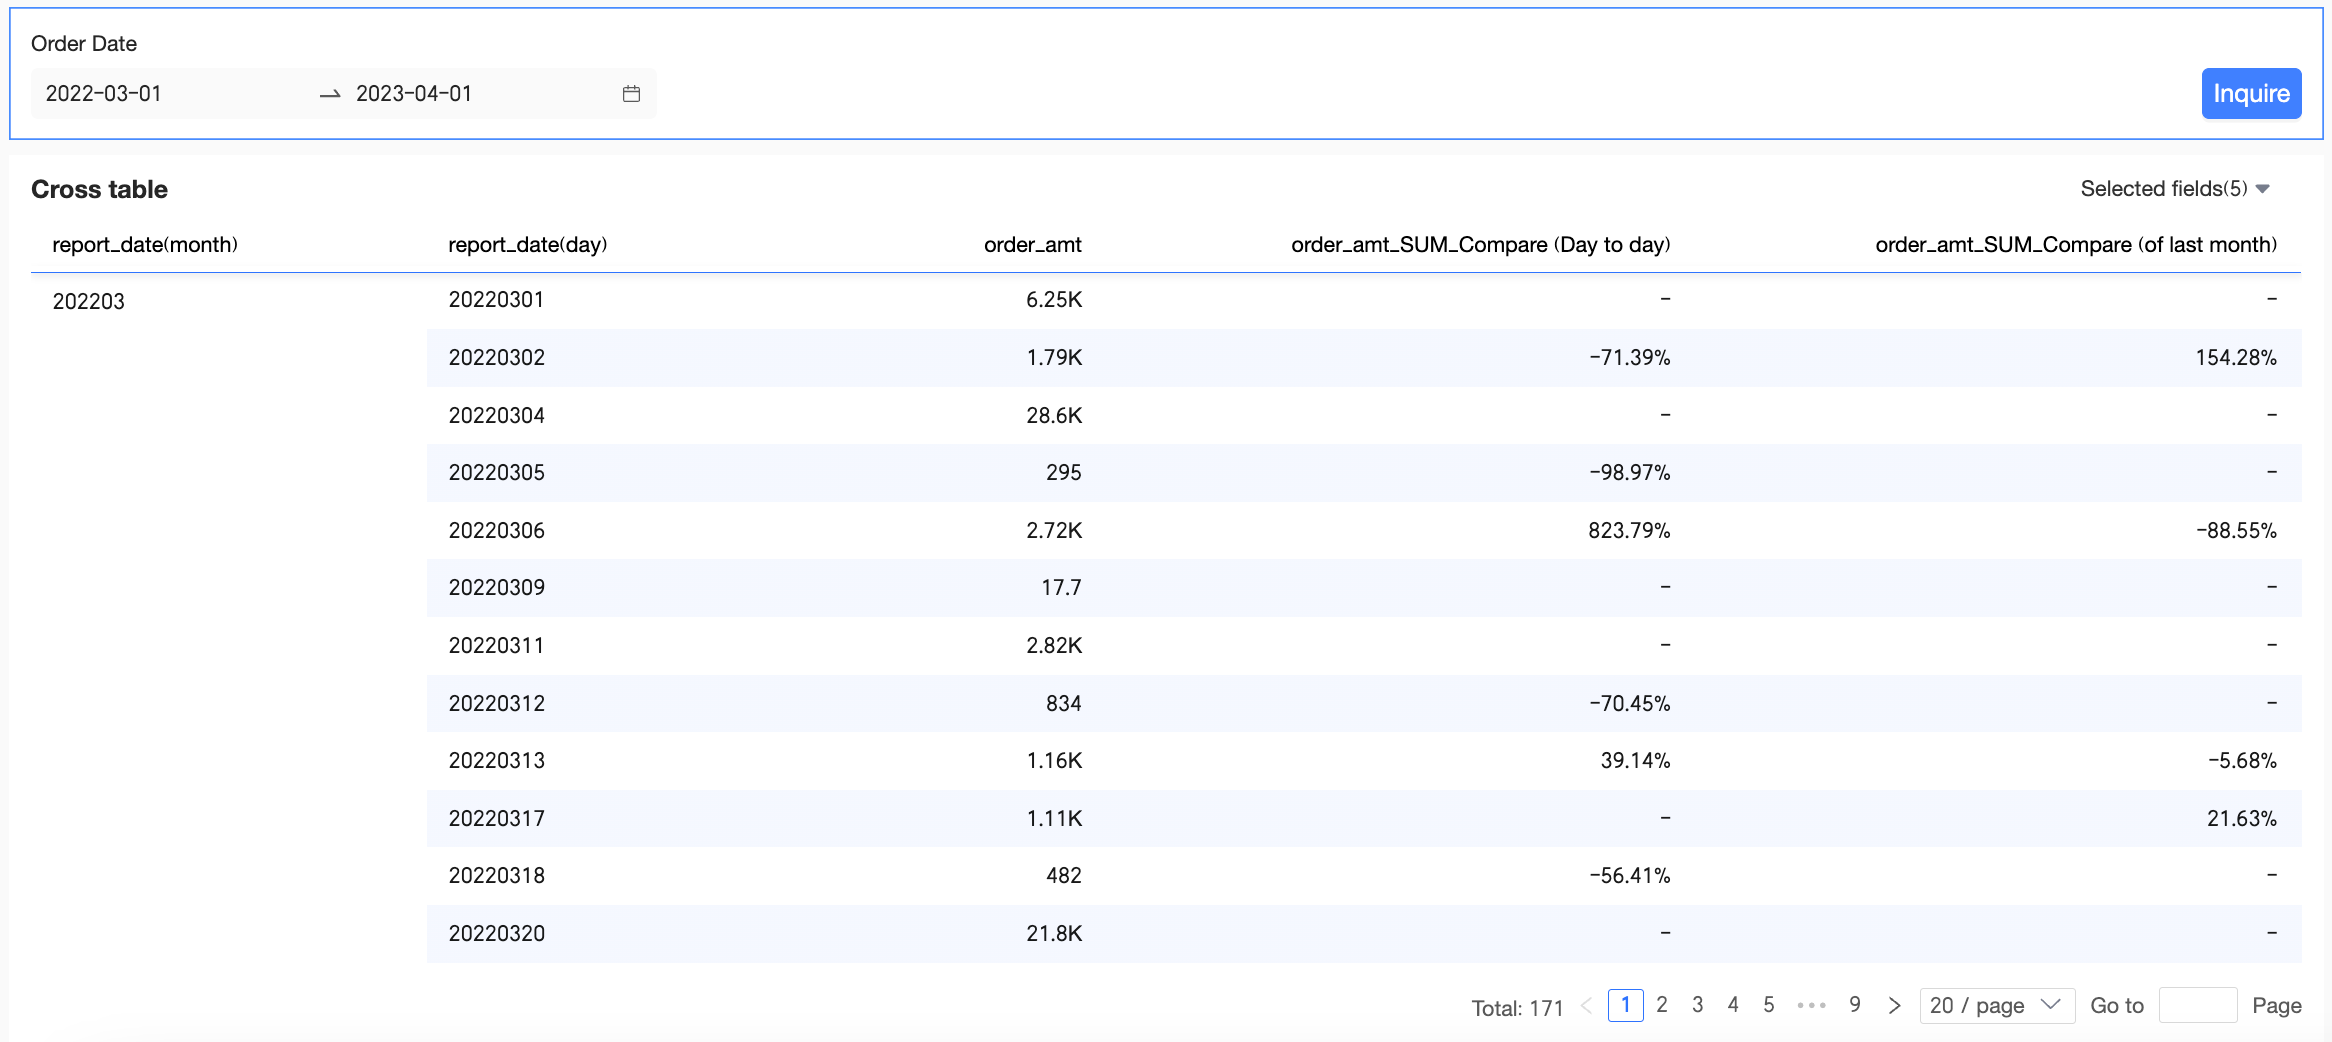
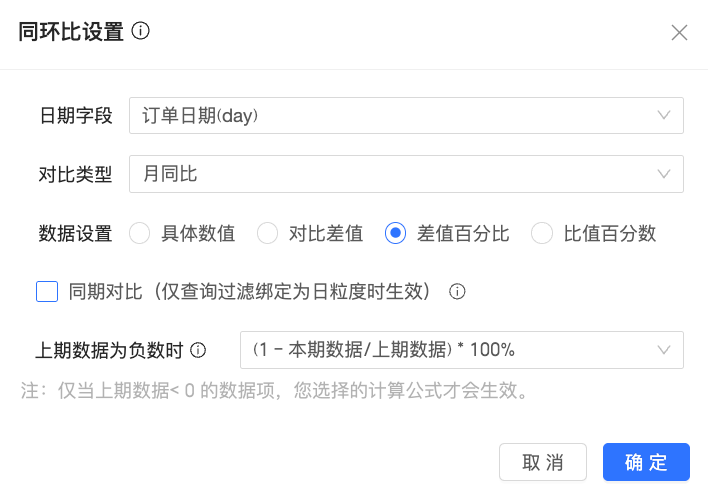
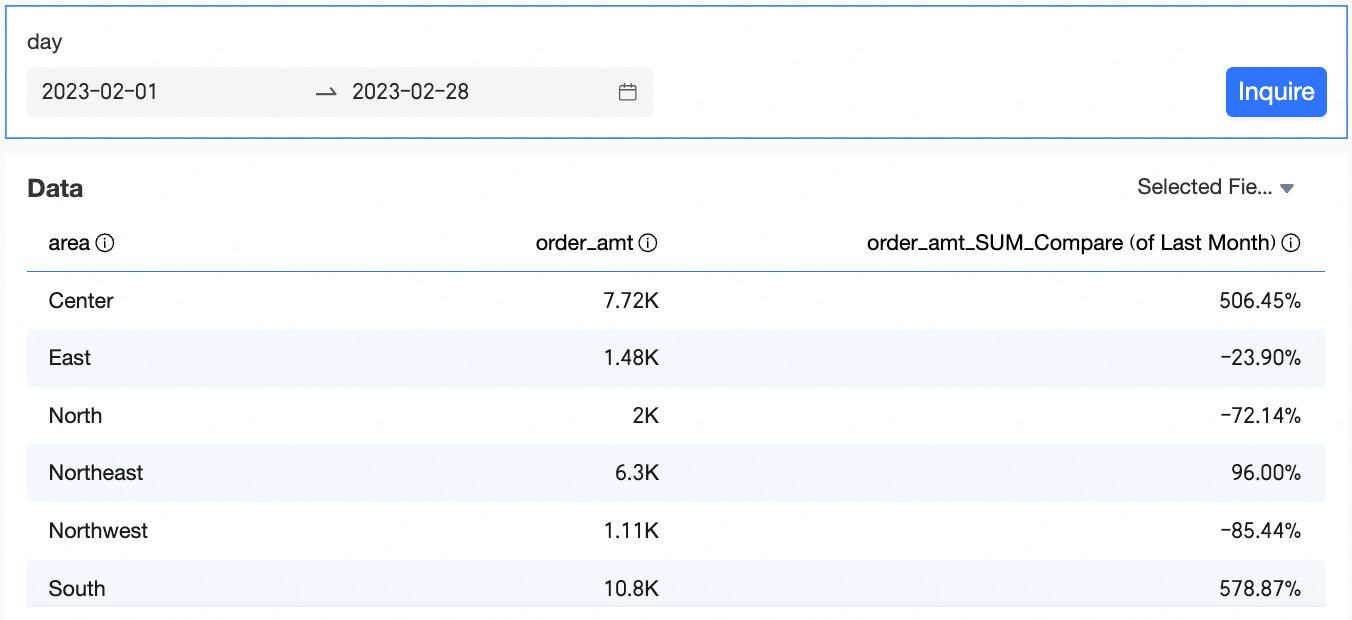
In this example, set the comparison date to Order Date (day), the comparison type to monthly year-over-year, the data setting to percentage difference, and leave align period length unselected.
NoteWhen you configure a YoY and MoM comparison, the default data setting is percentage difference.
When you calculate a monthly year-over-year comparison for months with a different number of days (for example, February 2024 has 29 days and February 2023 has 28), selecting align period length compares data from February 1–28, 2024, with data from February 1–28, 2023. If you do not select this option, the comparison is between the full periods of February 1–29, 2024, and February 1–28, 2023.
Click OK.
Add and configure filters.
NoteThe date field in the filter control must match the date field used for the YoY and MoM comparison.
On the dashboard edit page, click Query.
You can also modify the date range and run the query again.
In this case, because align period length is not selected and the dimension contains no date field, if the date filter is for a full month, the monthly year-over-year comparison uses data from the same month in the previous year. For example, data for February 1–28, 2023, is compared with data for February 1–28, 2022.

Year-over-year
If a dimension lacks a date field, select one from its associated query control. Then, on the period-over-period settings page, select a comparison date with the same time granularity to configure the period-over-period comparison.
This example shows how to configure period-over-period comparisons in a cross table.
On the dashboard edit page, on the Fields tab, add a field and configure YoY and MoM comparison.
Add fields.
In the Dimensions list, find Region, and then double-click or drag it to the Rows area.
In the Metrics list, find Order Amount, and double-click or drag it to the Column area.
Hover over the order_amt measure, click the
icon on the right, and choose Advanced Calculation -> comparison -> custom.On the YoY and MoM comparison settings page, configure the date field, comparison type, and data settings.
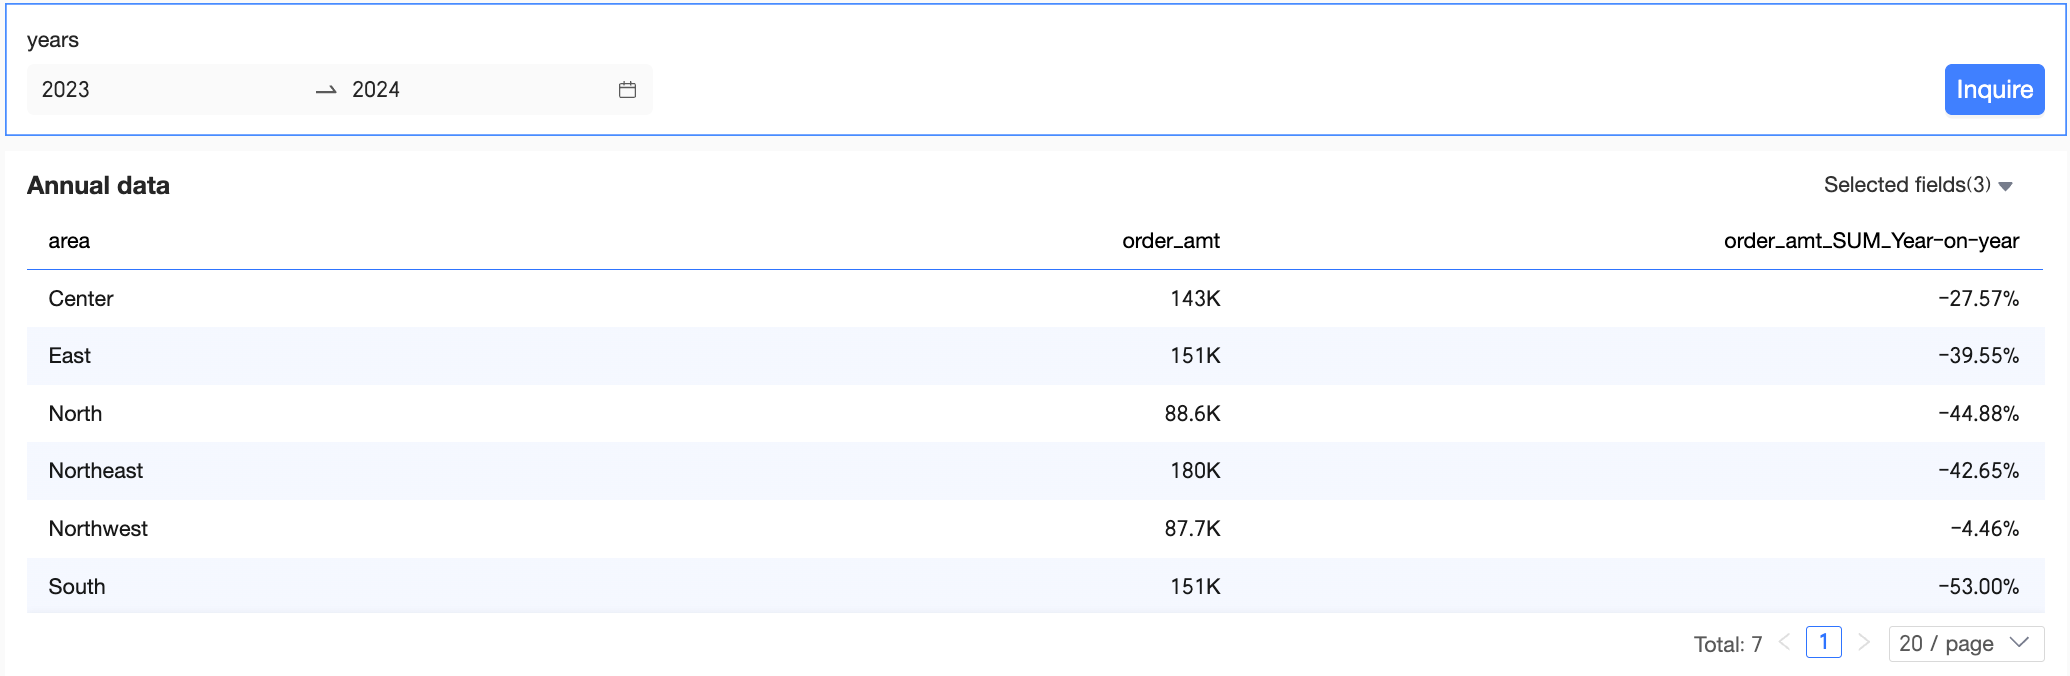
In this example, the comparison date is set to order date (year), the comparison type is Year-over-year, and the data setting is Difference.
NoteData settings supports actual value, difference, percent difference, and proportion.
Click OK.
Add and configure filters.
Set the filters.
NoteThe date field in the filter bar must match the date field used for the comparison.
On the dashboard edit page, select the query time range and click Query.
You can also modify the date range and click Query again.


Weekly granularity (YoY)
The following scenarios illustrate the pushdown logic for the filtering period.
Scenario 1
Date granularity | YoY/MoM type | Lookback logic | Filter granularity | Current period | Comparison period | ||
week | YoY | Aligns with the same week number and day of the week from the previous year. | year | 2020-01-02 to 2025-01-02 | Wednesday, Week 1, 2020 to Tuesday, Week 1, 2025 | Wednesday, Week 1, 2019 to Tuesday, Week 1, 2024 | 2019-01-02 to 2024-01-02 |
For example, consider a crosstab.
On the Fields tab of the dashboard edit page, add fields and configure period-over-period comparison.
Add fields.
In the Dimensions list, find area, then double-click or drag it to the Rows area.
In the Measures list, find
order_amount, then double-click or drag it to the Columns area.NoteTo view the order amount for the current and comparison periods and the year-over-year change, add three
order_amountmeasures to the Columns area.
Hover over an
order_amountmeasure, click the icon on the right, and select advanced calculation > period-over-period comparison > custom.On the period-over-period comparison settings page, configure the date field, comparison type, and data settings.
In this example, set the comparison date to
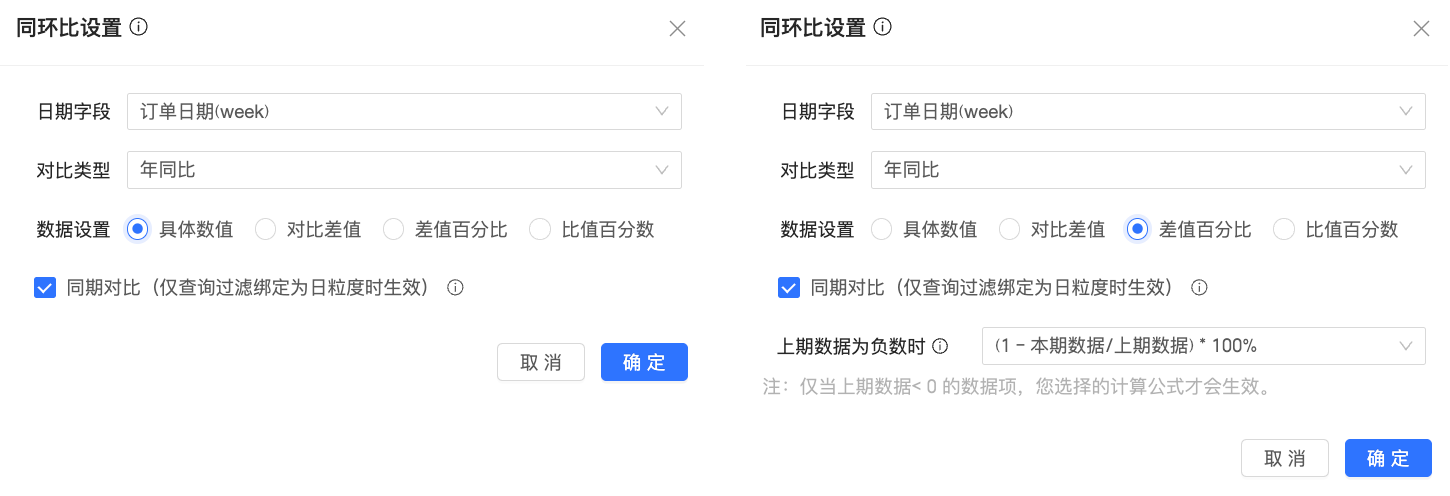
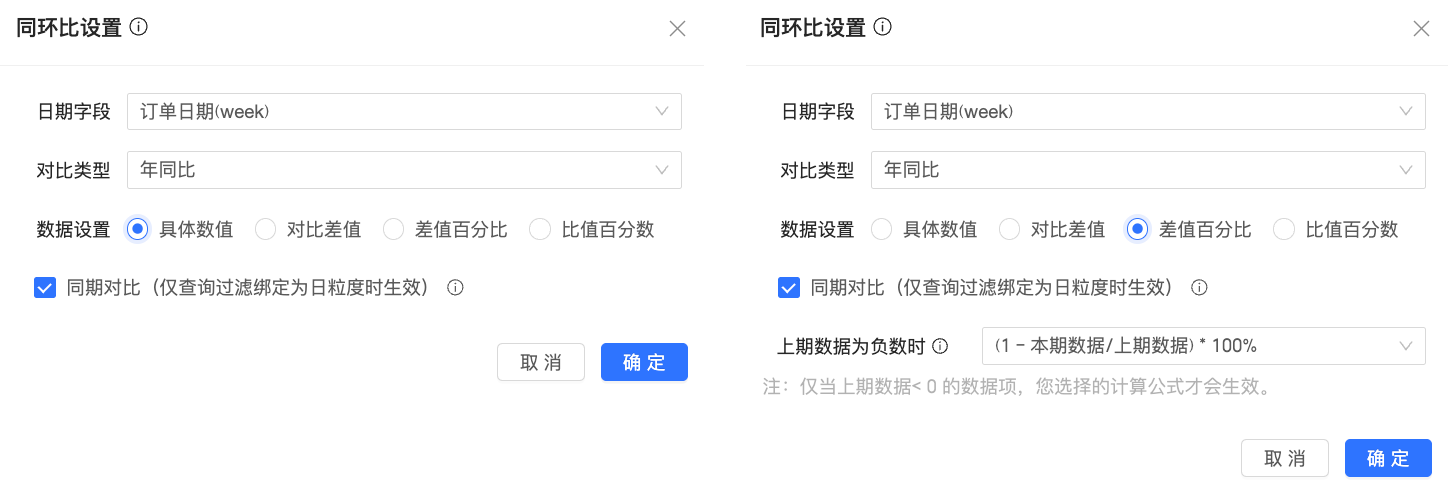
order_date(week), the comparison type to year-over-year, and the data settings to actual value and percentage difference. Select period-over-period comparison.Click OK.
Configure filter conditions.
This example adds a filter control for
order_date(day).Add a filter control.
Select advanced settings.
Set the query conditions.
On the dashboard edit page, click query.
You can also modify the date range and query again.
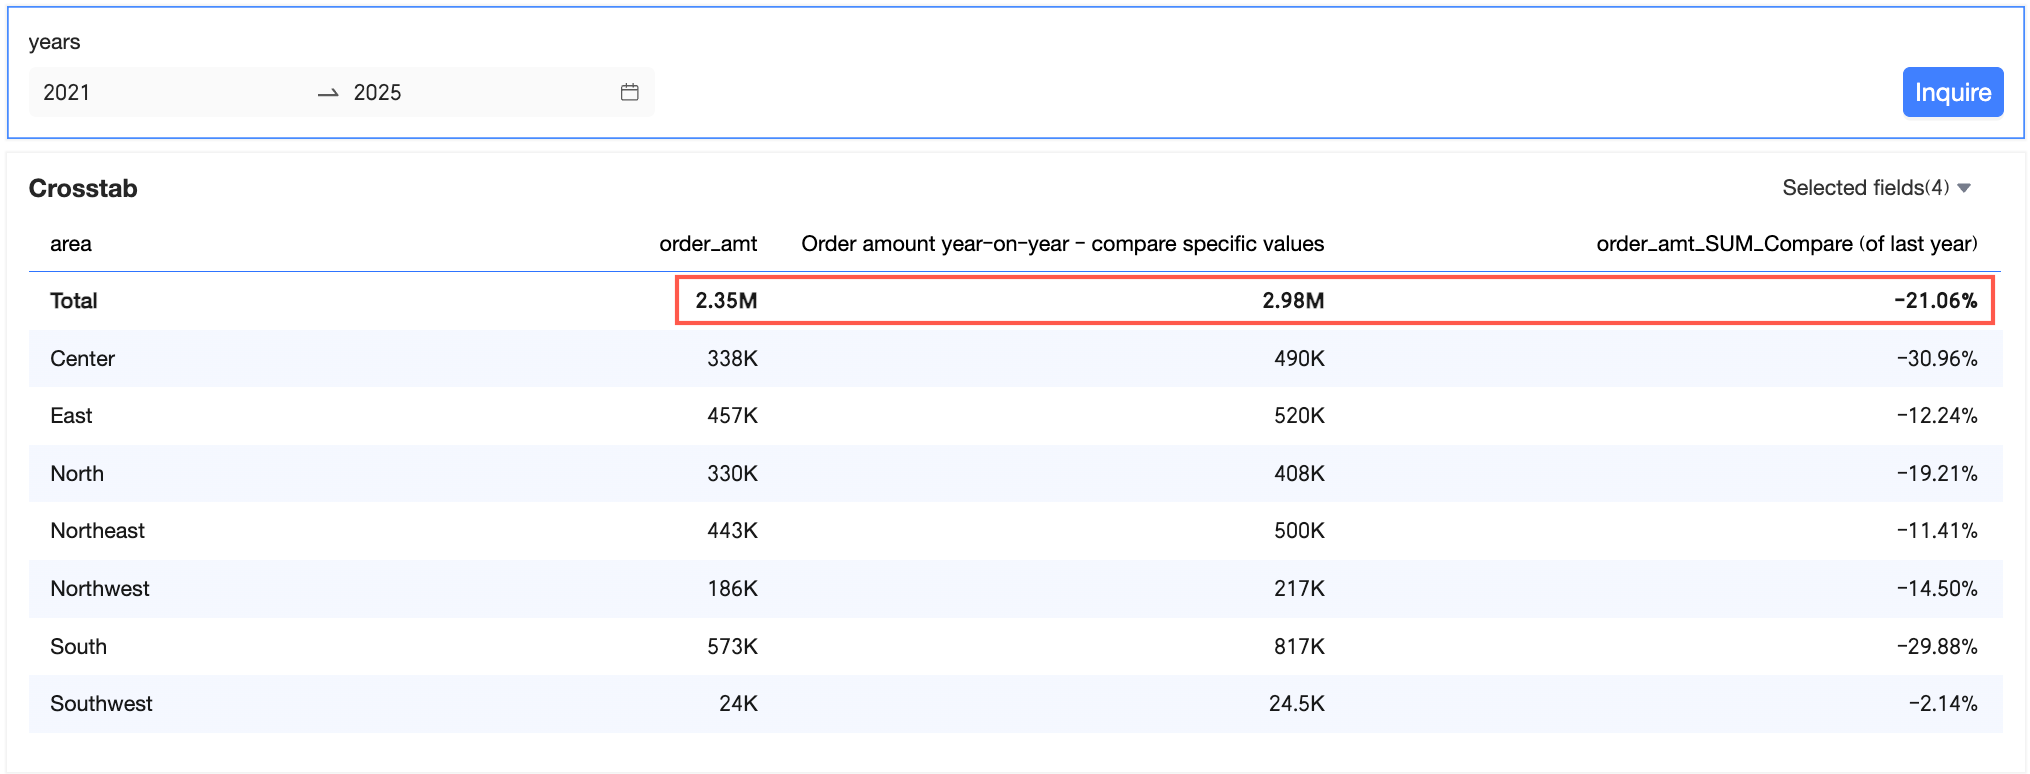
The current period, 2020 to 2024, spans from Wednesday, Week 1, 2020 (January 1, 2020) to Tuesday, Week 1, 2025 (December 31, 2024), with a total order amount of 18.31 million. The comparison period spans from Wednesday, Week 1, 2019 (January 2, 2019) to Tuesday, Week 1, 2024 (January 2, 2024), with an order amount of 17.82 million and a year-over-year change of 2.75%.


Scenario 2
Date granularity | Comparison type | Lookback logic | Filter granularity | Current period | Comparison period | ||
week | year-over-year | Shifts the period back one year, matching the week number and day of the week. | day | 2020-01-01 to 2020-05-22 | Wednesday, Week 1, 2020 to Friday, Week 21, 2020 | Wednesday, Week 1, 2019 to Friday, Week 21, 2019 | 2019-01-02 to 2019-05-24 |
Let's take a crosstab as an example.
On the dashboard's Fields tab, add fields and configure a period-over-period comparison.
Add fields.
From the Dimensions list, find area, then double-click or drag it to the Rows area.
From the Measures list, find
order_amount, then double-click or drag it to the Columns area.NoteTo view the order amount for the current and comparison periods, as well as the year-over-year (YoY) change, add three
order_amountmeasures to the Columns area.
Hover over the
order_amountmeasure, click the icon on the right, and select Advanced Calculation > Period-over-period Comparison > Custom.On the Period-over-period Comparison Settings page, configure the date field, comparison type, and data settings.
In this example, set the comparison date to
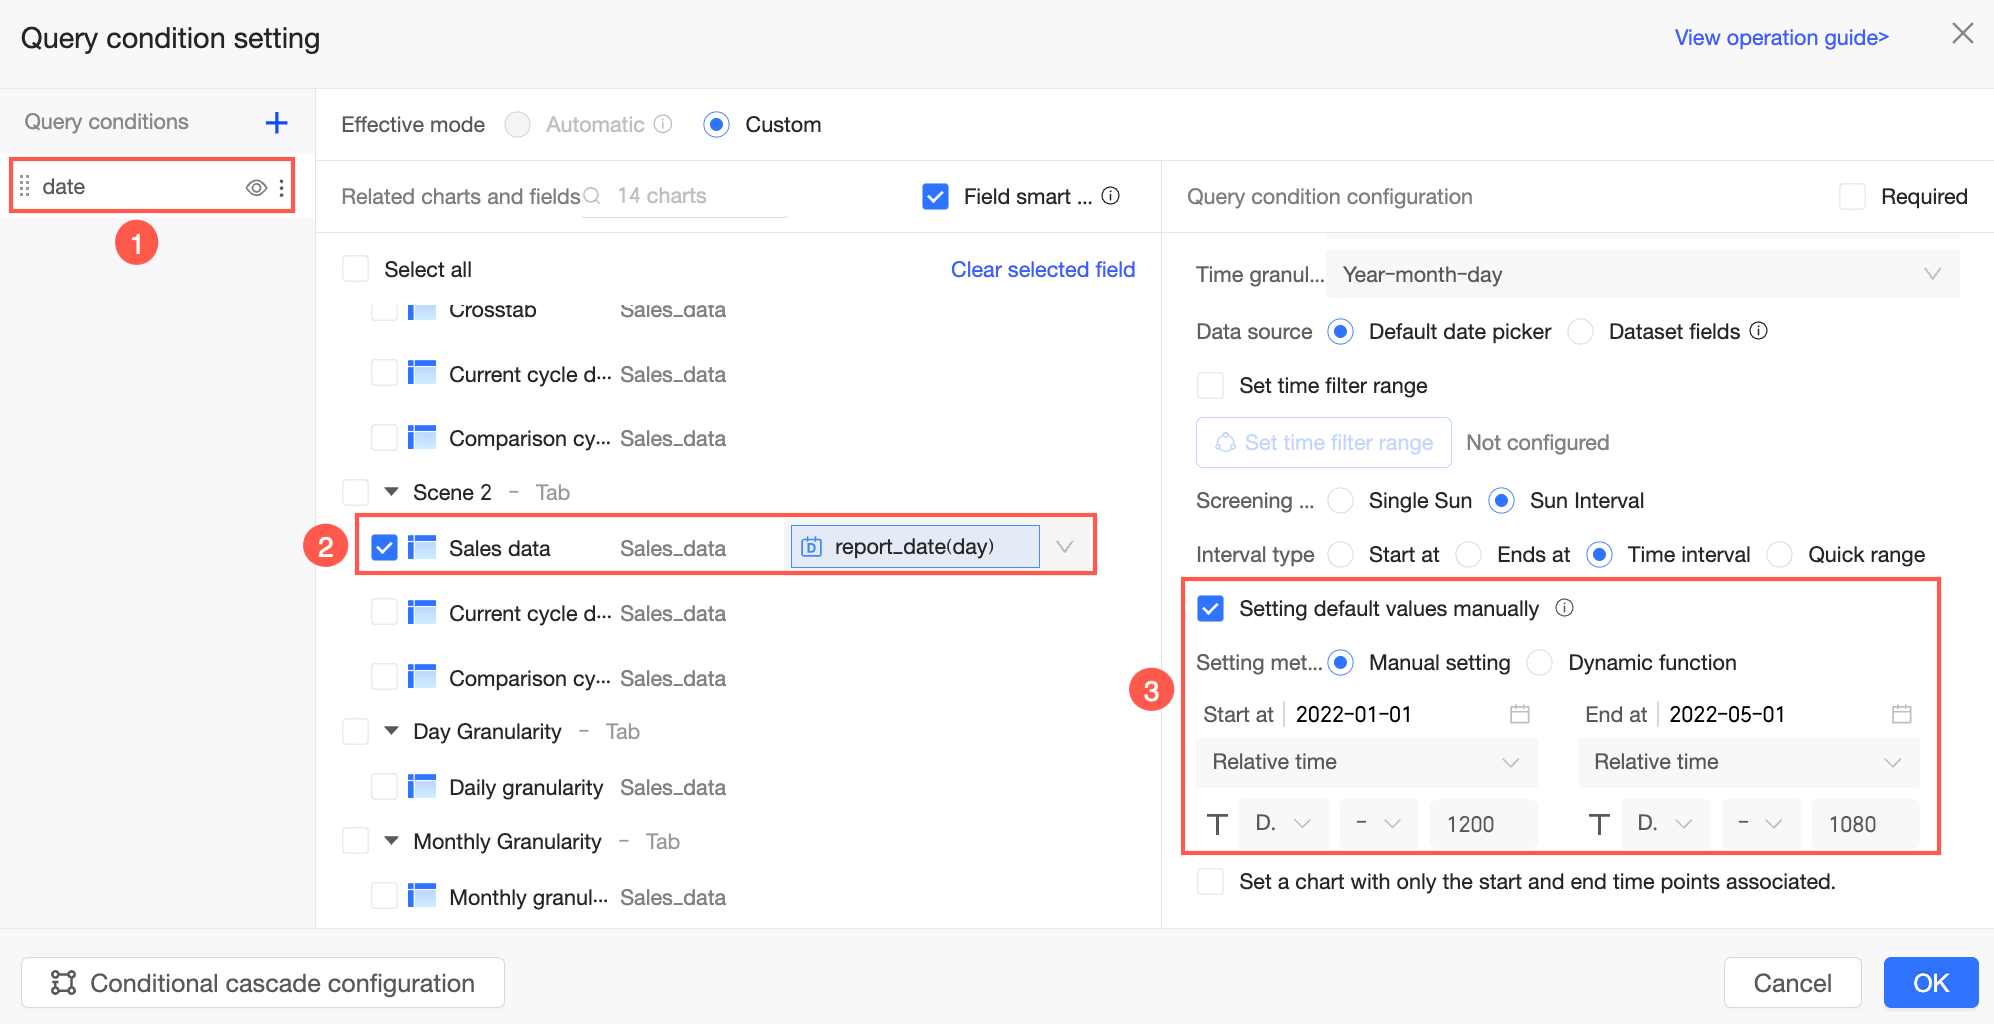
order_date(week), the comparison type to Year-over-year (YoY), and data settings to Actual Value and Percentage Difference. Select the Align Dates checkbox.Click OK.
Add and configure query criteria.
On the dashboard editor, click Query.
You can also change the date range and rerun the query.
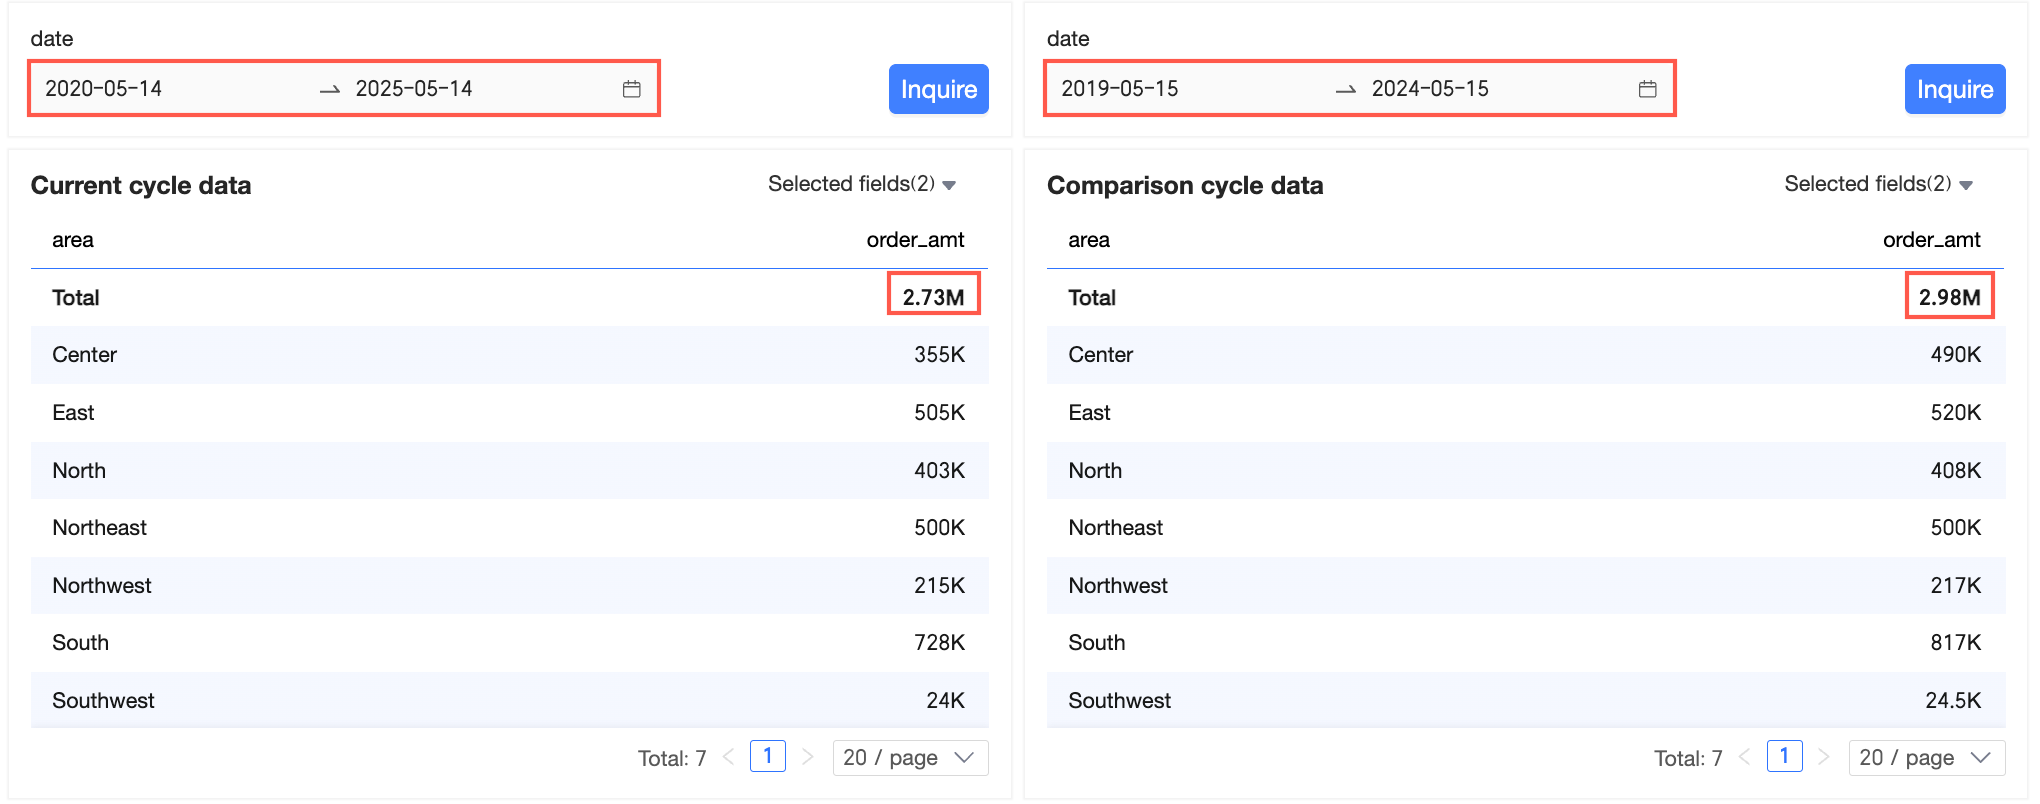
The current period, from January 1, 2020, to May 22, 2020, spans from Wednesday, Week 1, 2020 to Friday, Week 21, 2020, with a total order amount of 1.792 million. The comparison period, from Wednesday, Week 1, 2019 to Friday, Week 21, 2019, has an order amount of 511,300, resulting in a year-over-year (YoY) change of 250.44%.
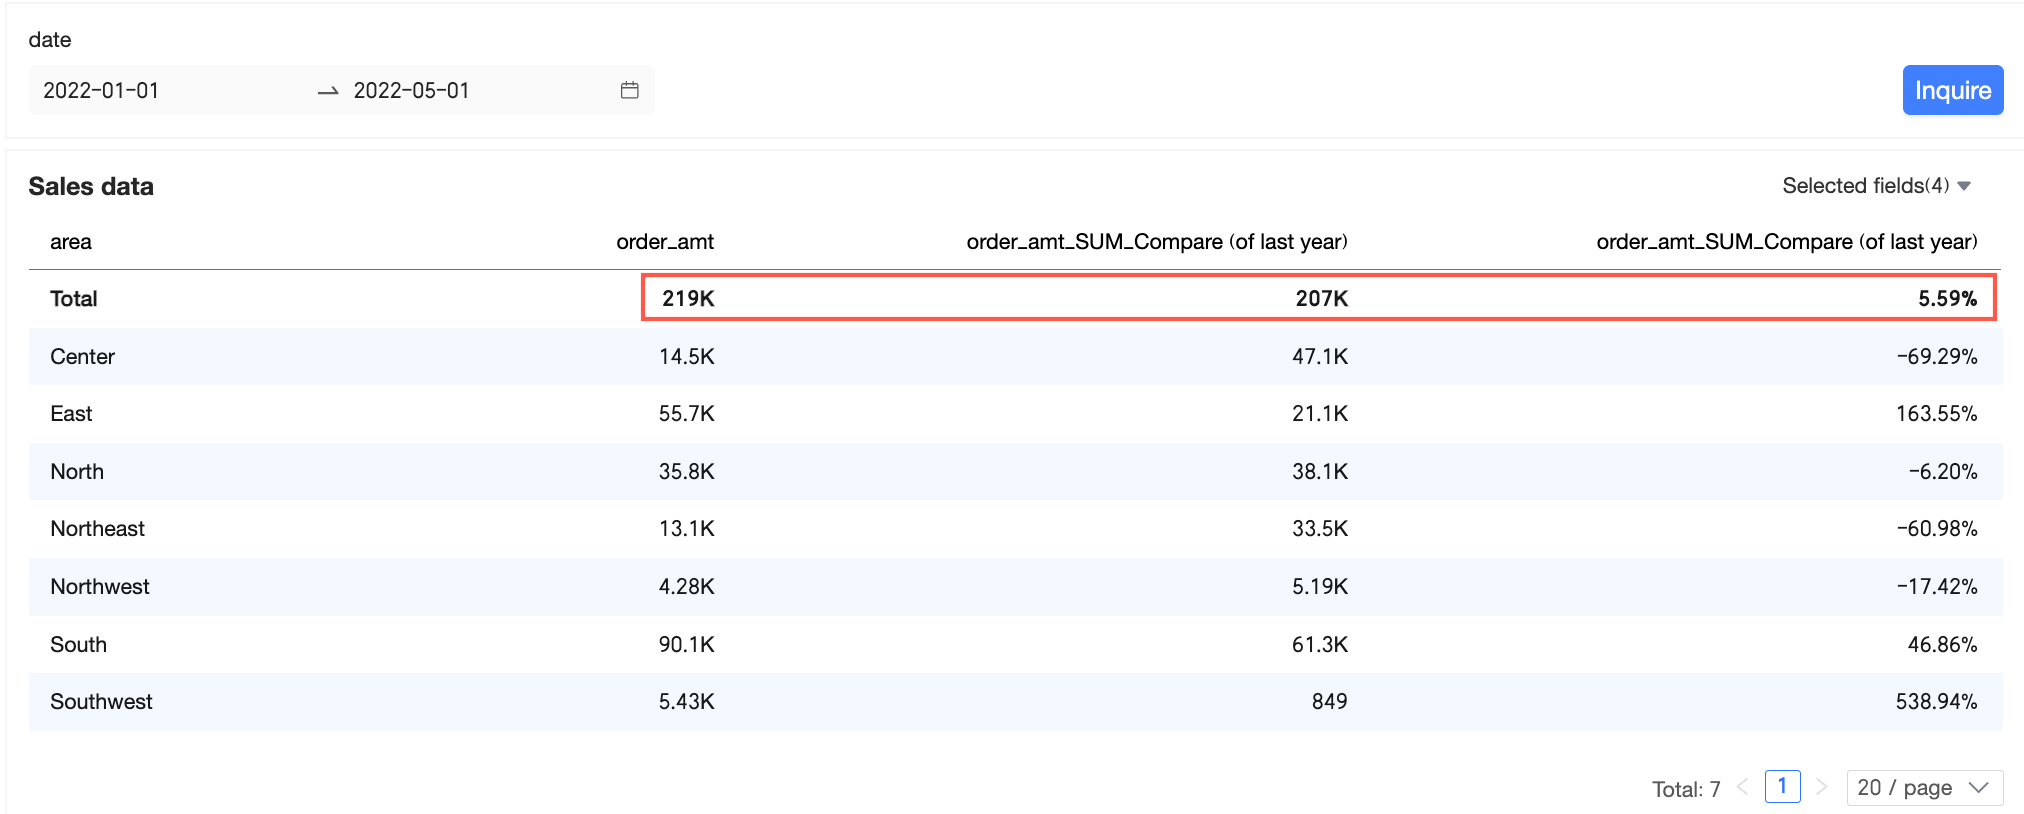
Dynamic period-over-period
If a dimension does not contain a date field, use the YoY and MoM settings page to select a date field and configure YoY and MoM.
For a dynamic period-over-period comparison, the comparison date granularity and the filter condition granularity must be identical. Otherwise, the comparison will fail.
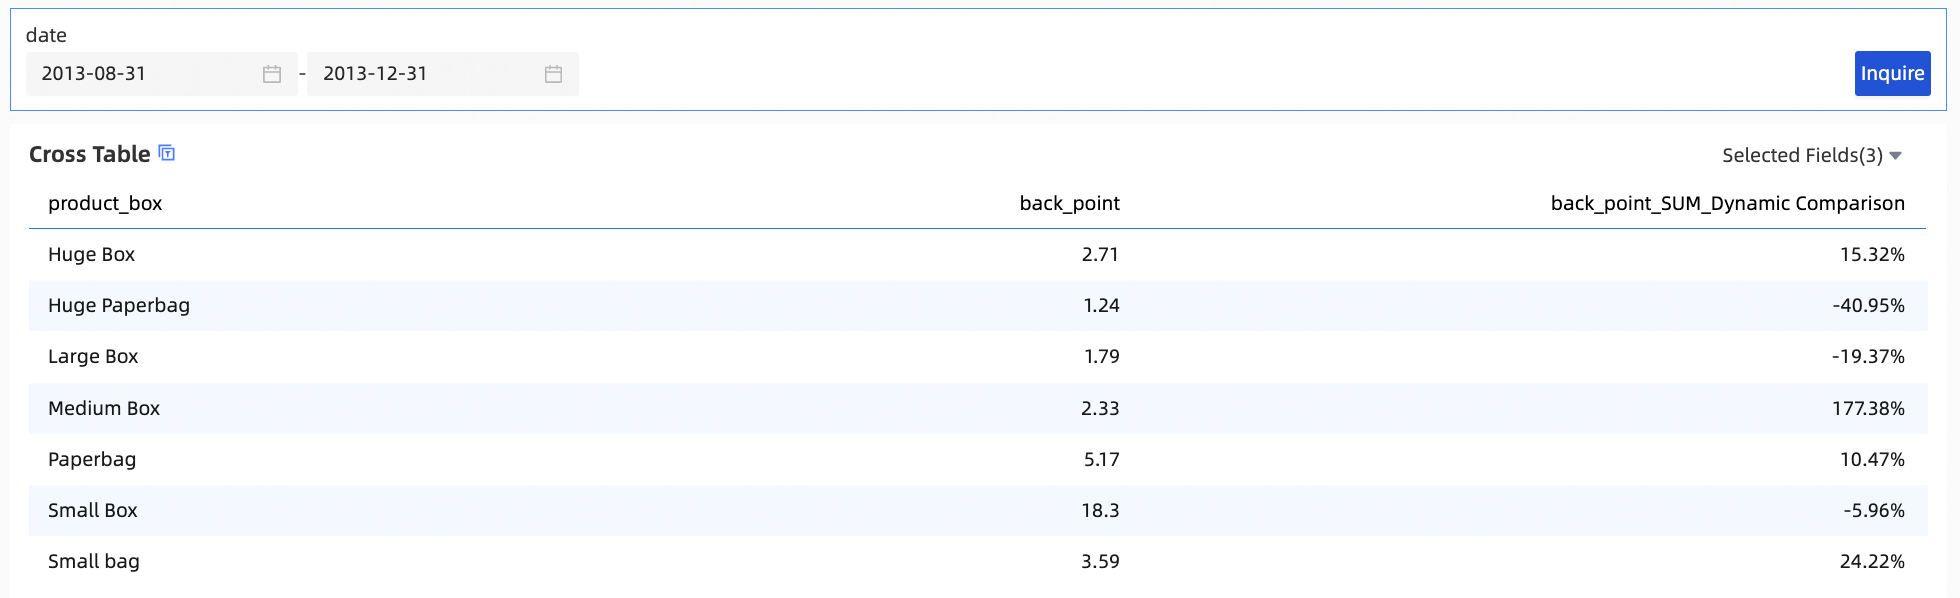
You can configure dynamic comparison for a dimension without a date field, just as you can when a dimension contains multiple date fields. The following example shows how to configure dynamic comparison using a cross table.
On the Field tab of the dashboard edit page, add fields and configure a comparison.
Add fields.
From the Dimension list, double-click or drag product_box to the Rows area.
From the Measure list, double-click or drag profit_amt to the Columns area.
Hover over the profit_amt measure, click the
icon on the right, then select Advanced Calculation > Comparison > Custom.On the comparison settings page, configure the date field, comparison type, and data settings.
In this example, set the comparison date to order_date(day), the comparison type to dynamic comparison, and the data settings to percent difference from.
NoteFor data settings, you can select specific value, difference from, percent difference from, or proportion.
Click OK.
Add and configure filters.
NoteThe date field in the filter must match the date field used for the comparison.
On the dashboard edit page, select a date range and click Query.
You can also modify the date range and run the query again.
View the SQL query.
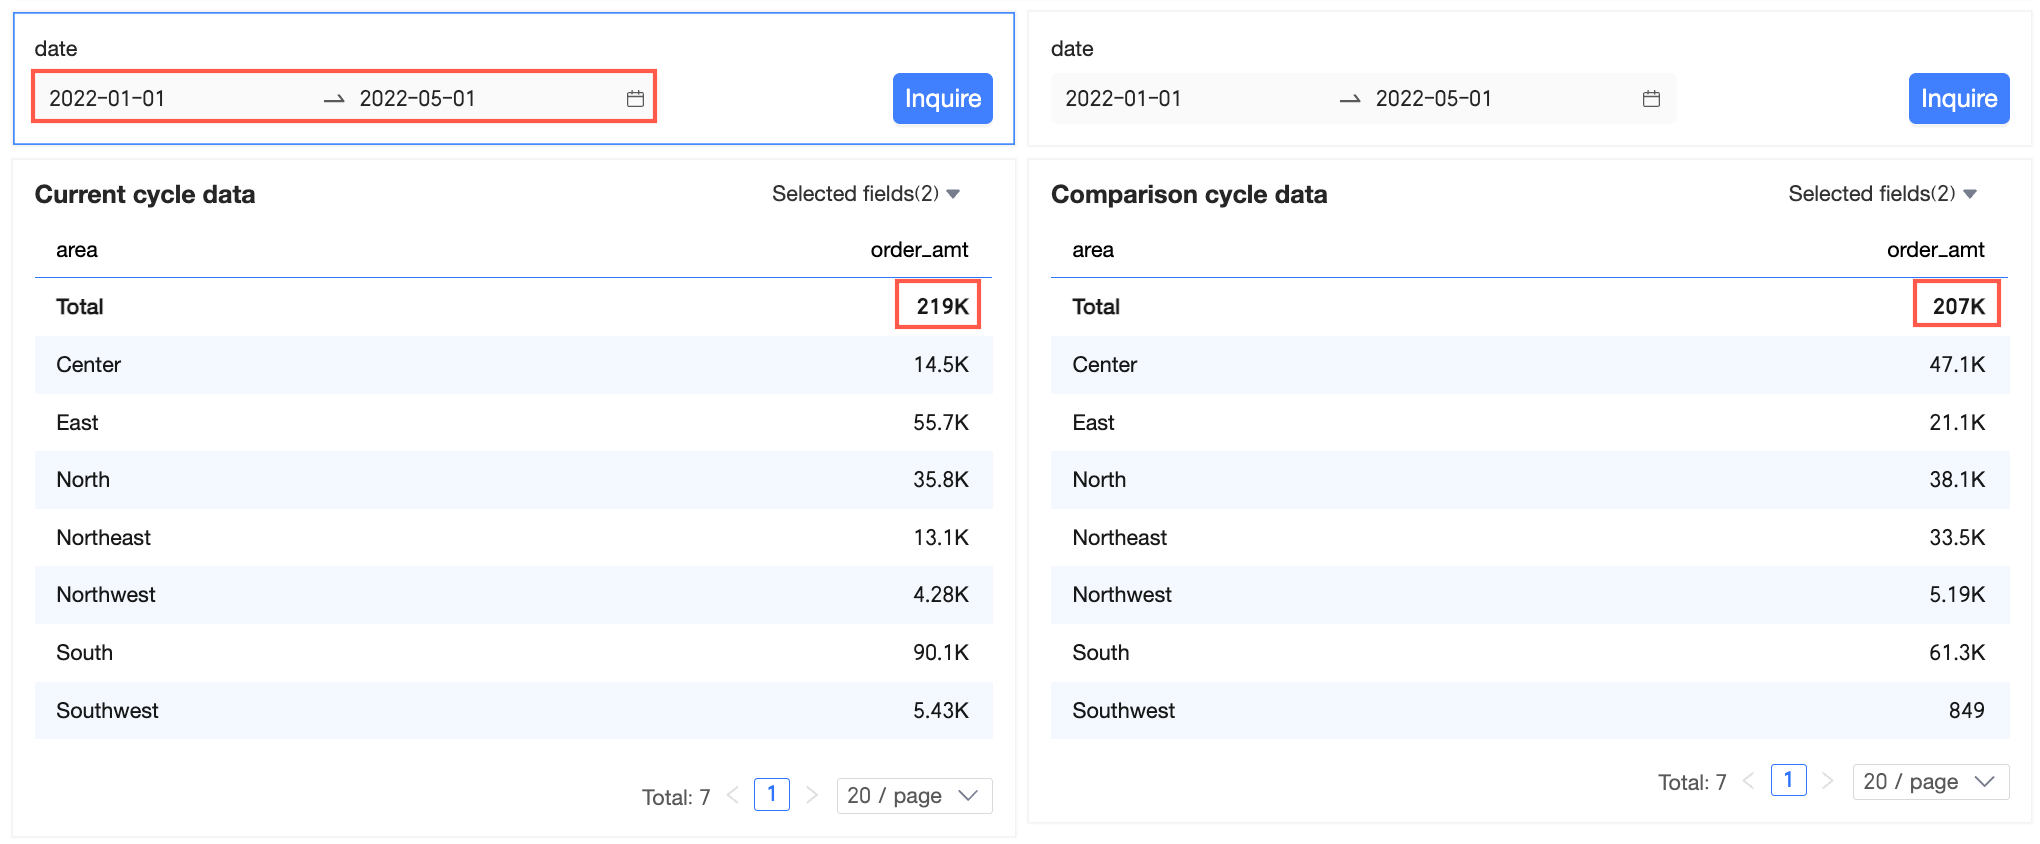
When you set the comparison type to dynamic comparison, the system calculates comparison values based on the date range you select in the filter. The comparison period has the same duration as your selected range and immediately precedes it.
If the filter is set to January 10, 2020, the comparison date is January 9, 2020.
If the filter range is from January 1, 2020, to January 10, 2020, the comparison range is from December 22, 2019, to December 31, 2019.
Hover over the top-right corner of the cross table and click the
icon.Select View SQL Statements.
You can see the dynamic comparison range.
 icon.
icon.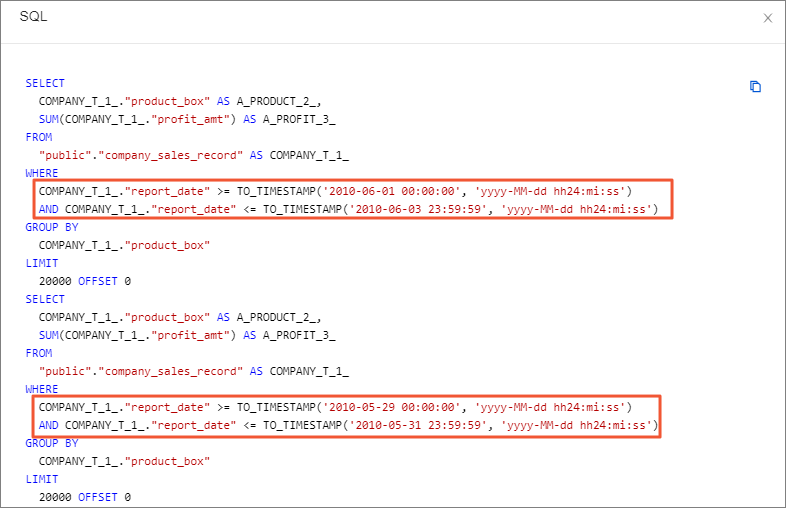
Placeholder binding
If a chart's dimension lacks a date field, use a date placeholder for period-over-period calculations. Once configured, the date value provided to the placeholder in the query control is used as the base time for the calculation.
This example shows how to view the order amount by product type in a crosstab and calculate its year-over-year change based on the date range from the query control.
Placeholder configuration: Create a dataset and configure a date placeholder for it.
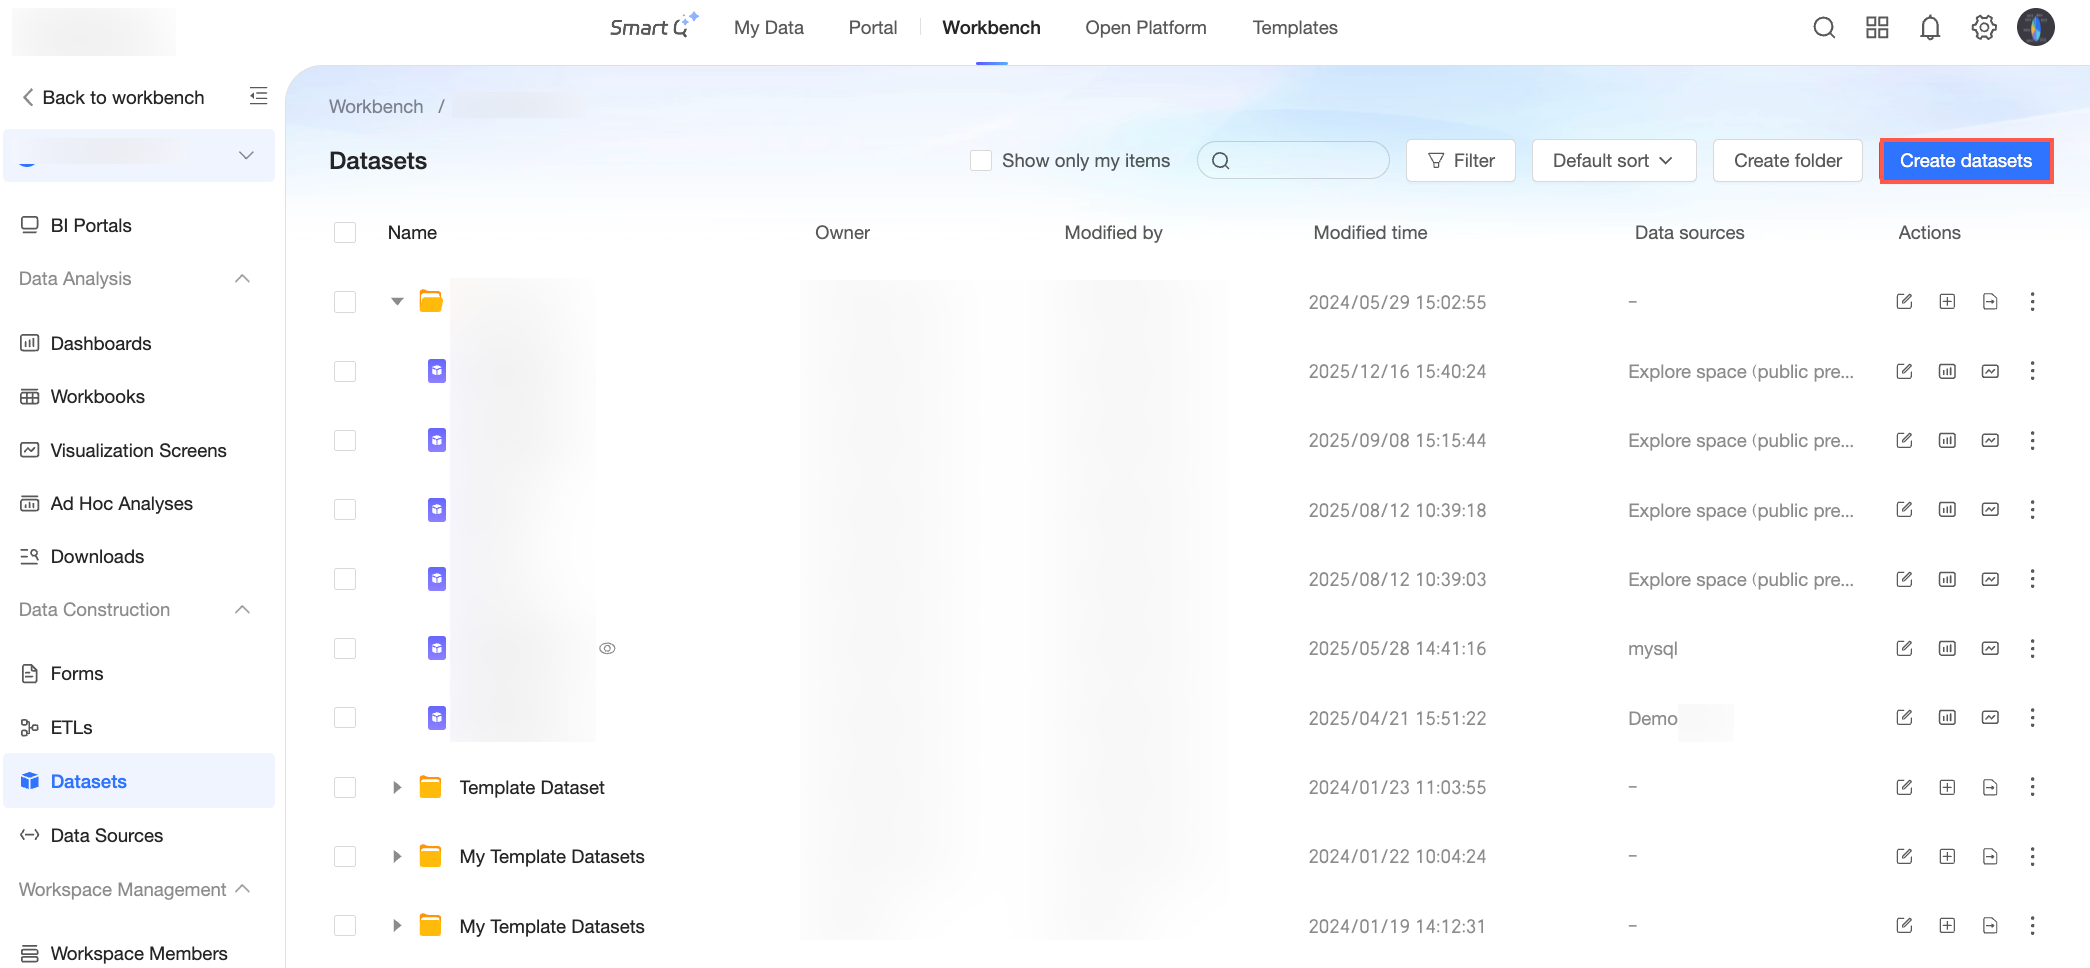
Log on to the Quick BI console. On the Dataset page, click Create dataset.
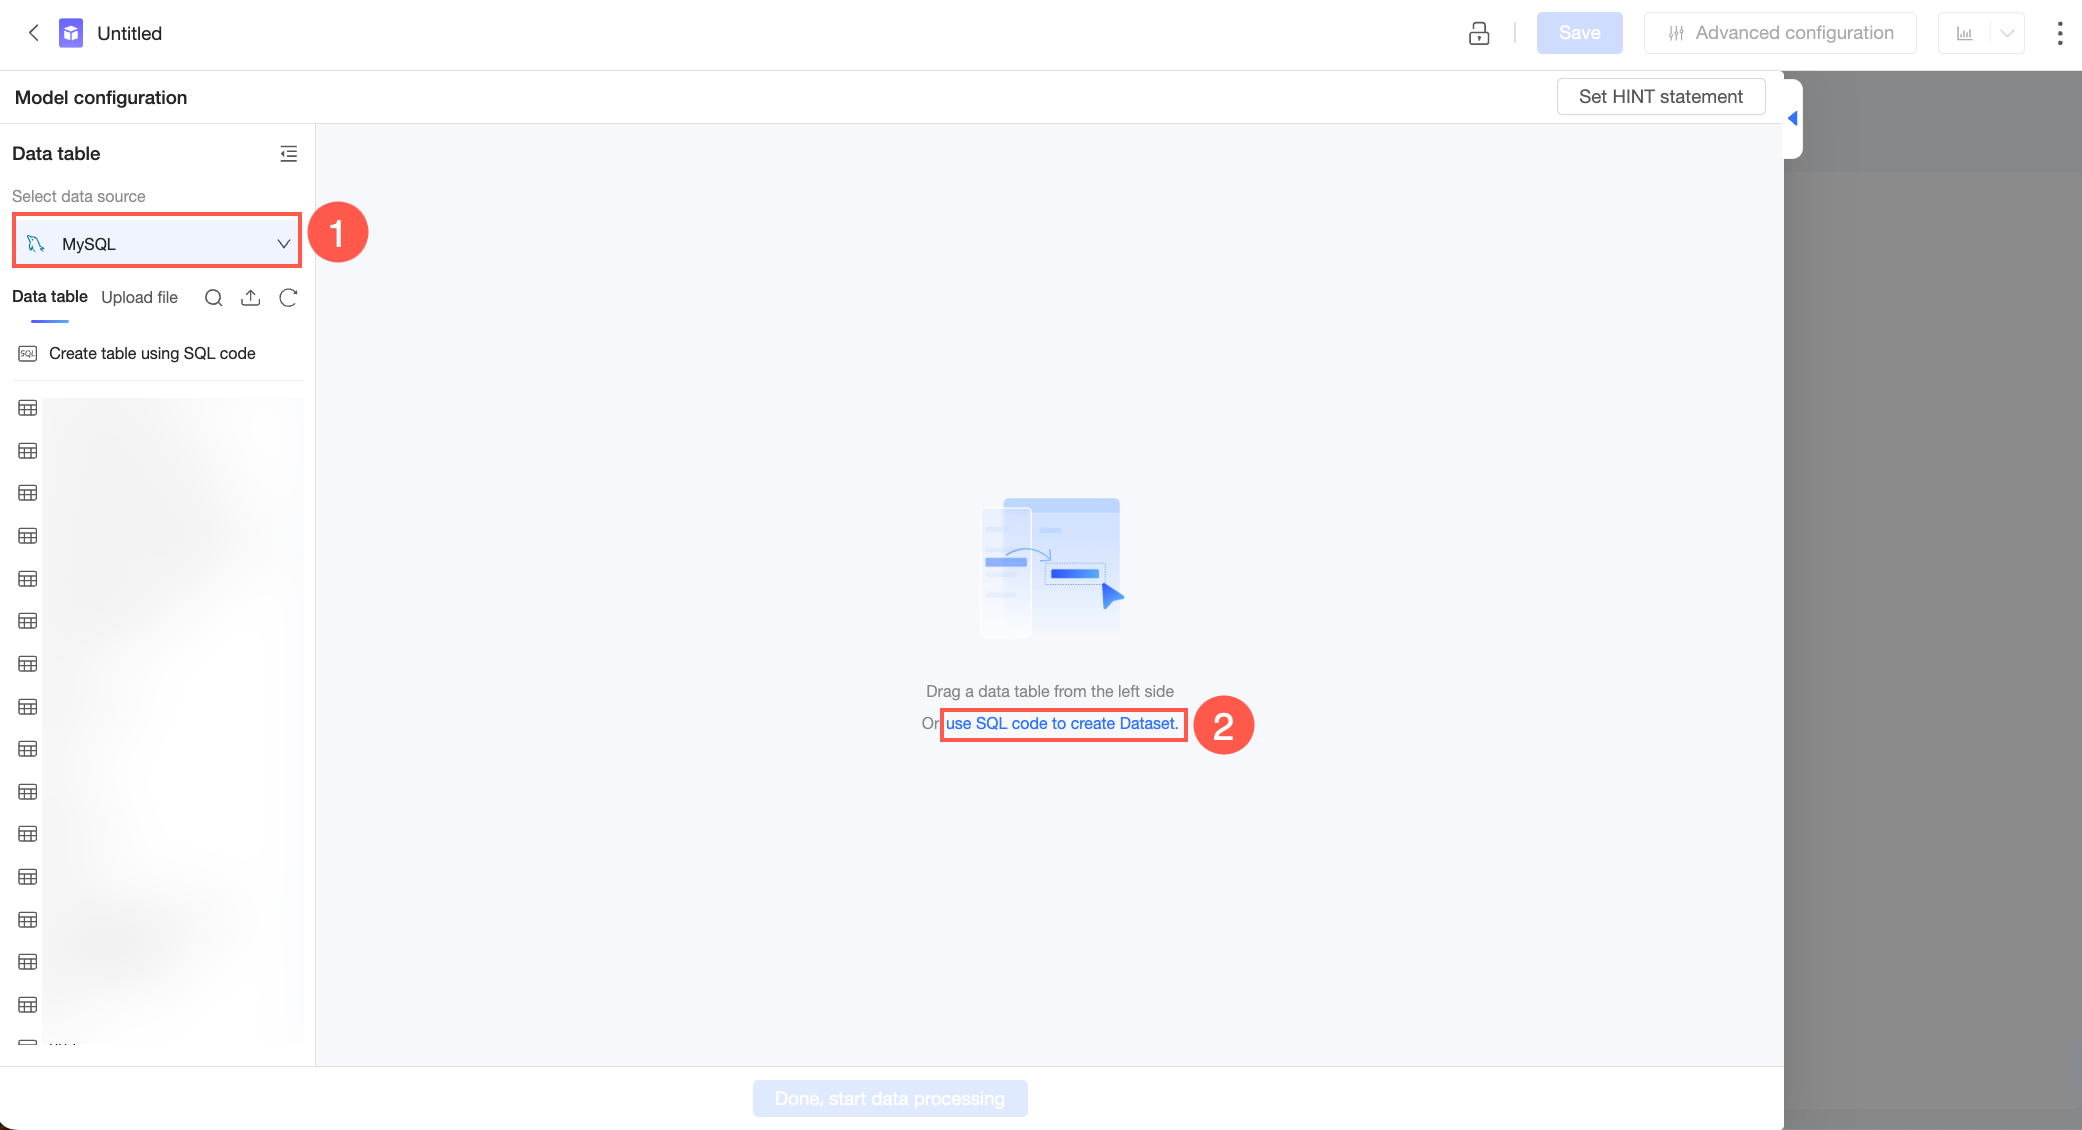
On the dataset creation page, select a database from the list on the left, then click Create dataset by SQL on the right.
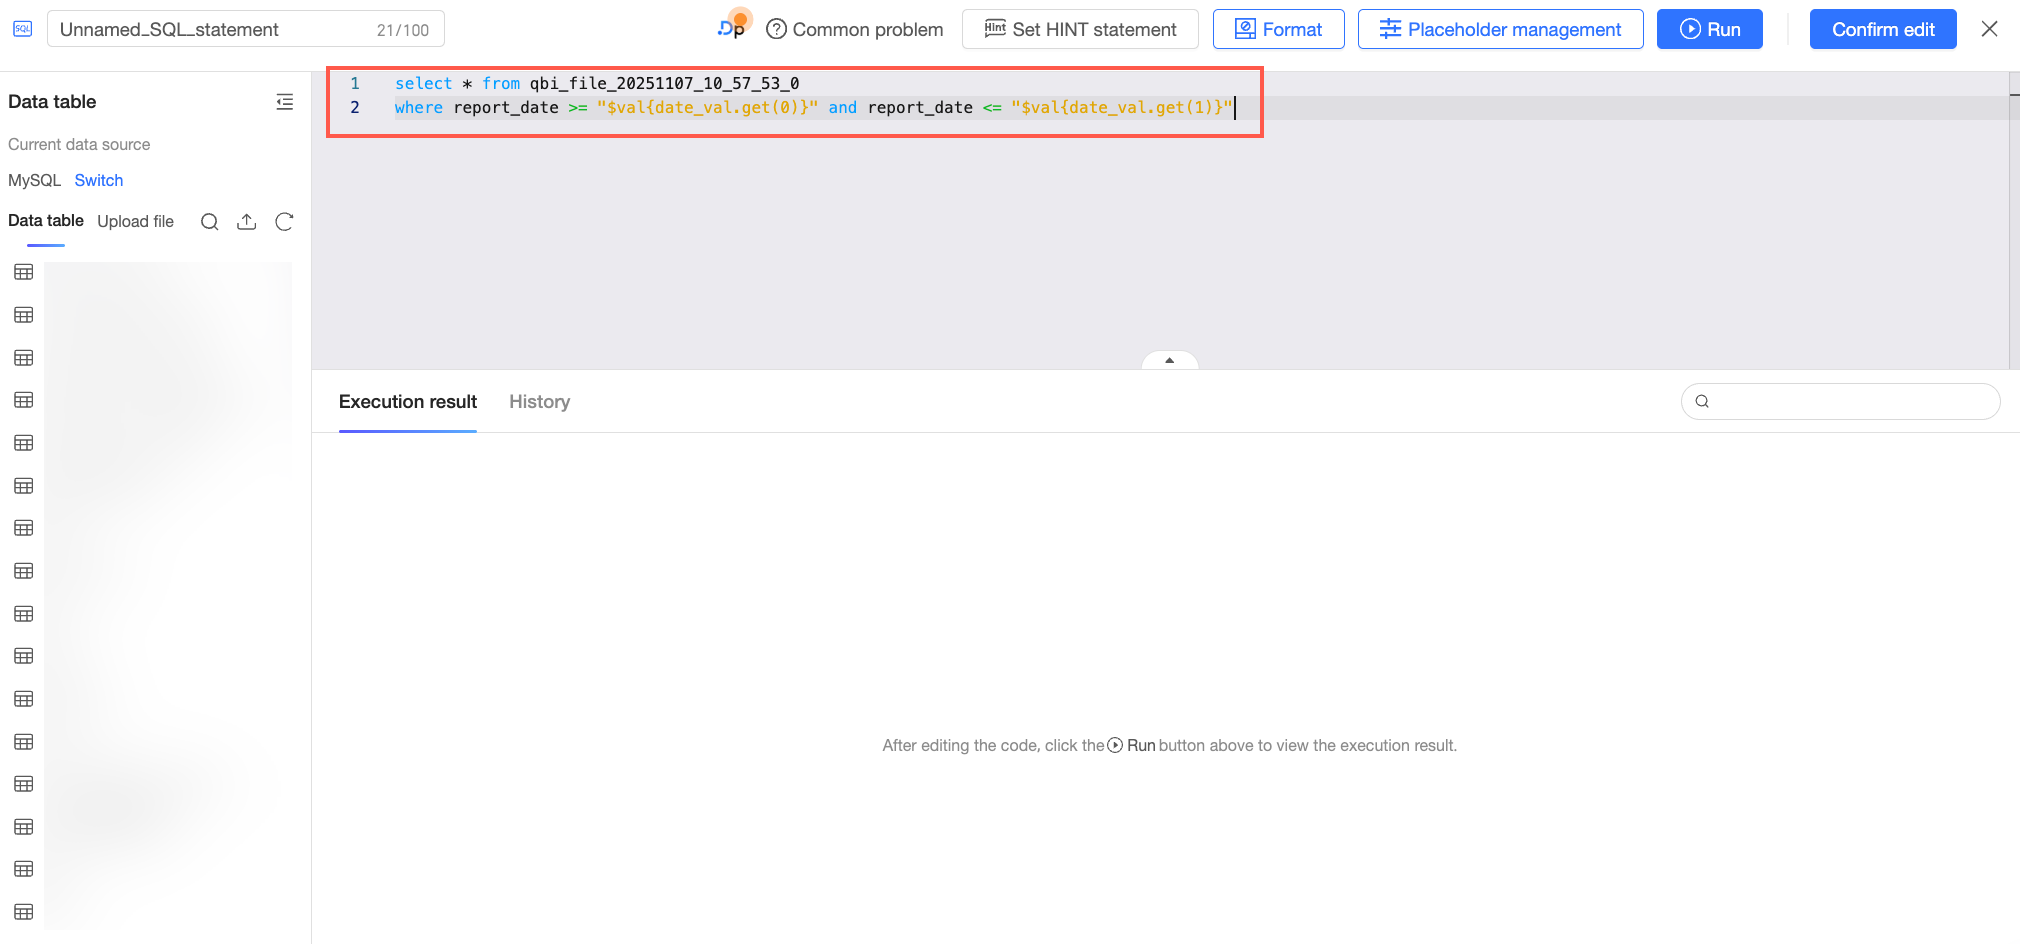
On the custom SQL edit page, reference the placeholder in your SQL statement as needed.
In this example, a date placeholder is referenced in the
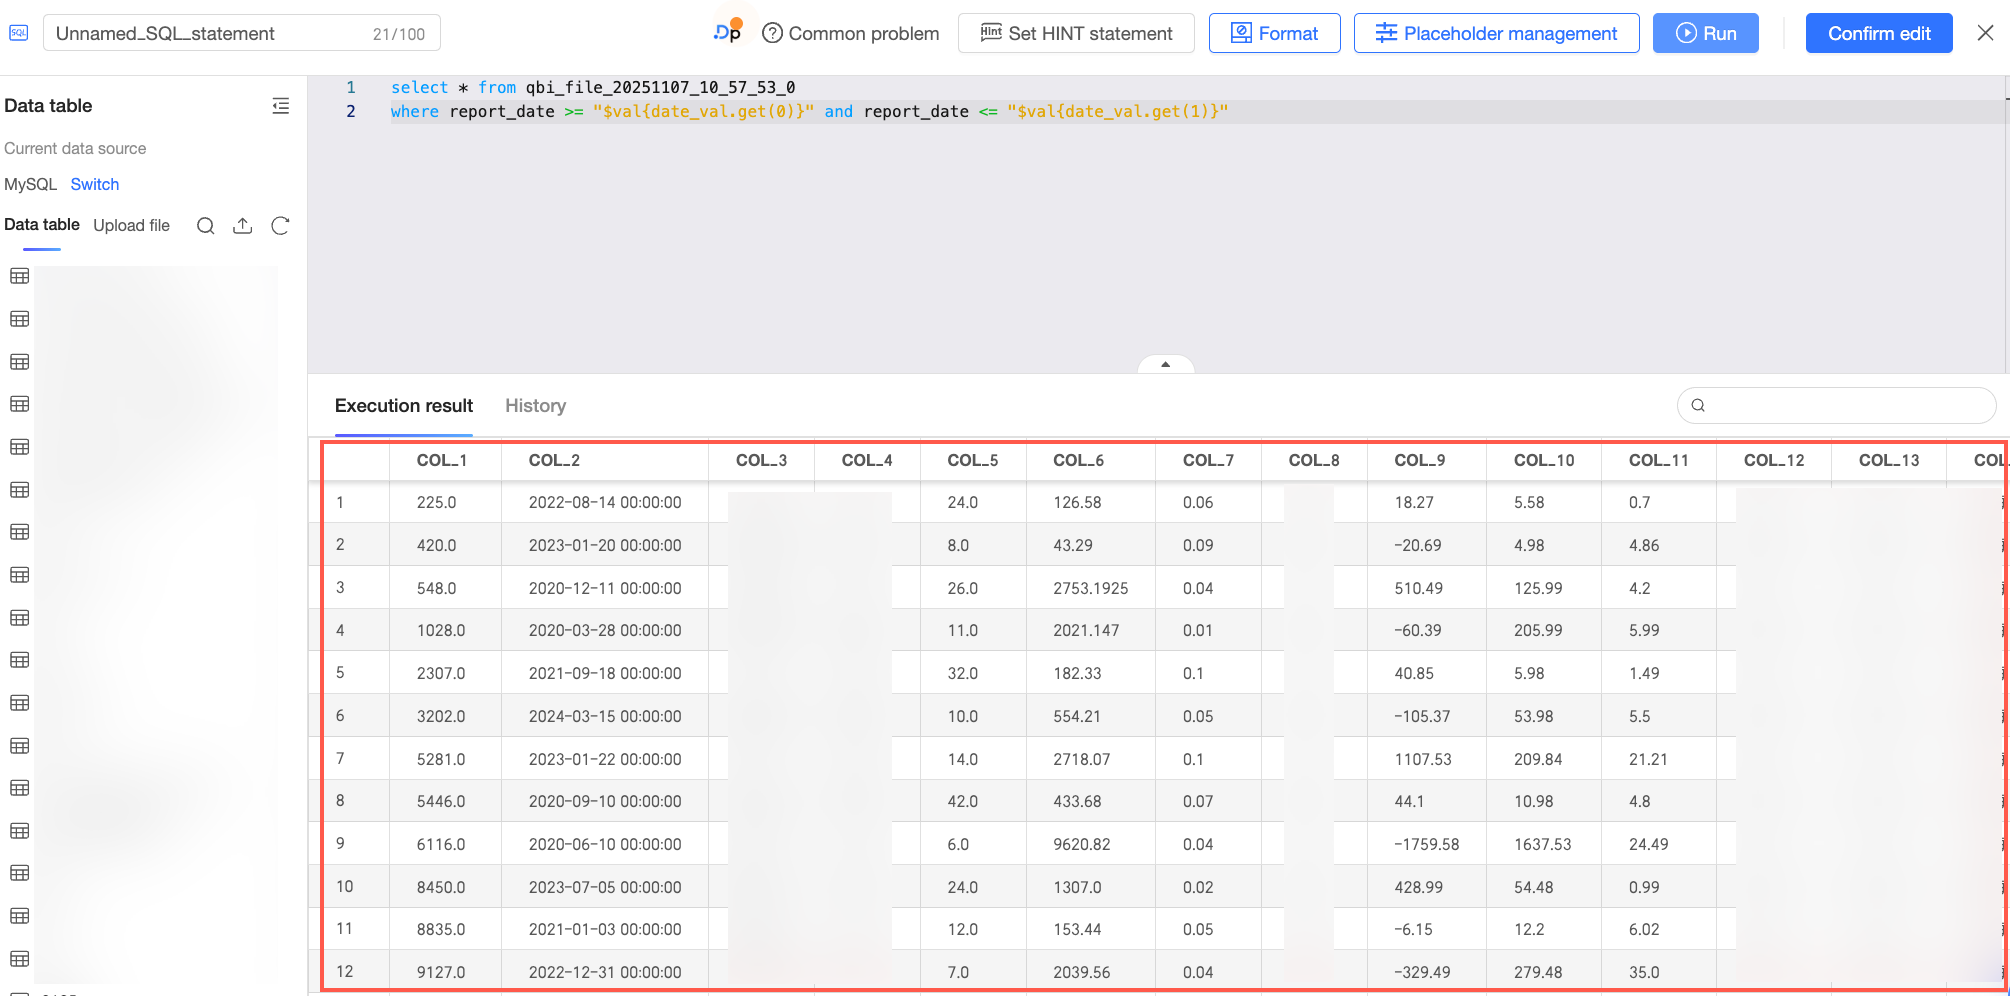
qbi_file_20251107_10_57_53_0data table. This allows thereport_datefield values to dynamically adjust based on values passed from the query control on the dashboard. The code is as follows:select * from qbi_file_20251107_10_57_53_0 where report_date >= "$val{date_val.get(0)}" and report_date <= "$val{date_val.get(1)}"Click the Run button at the top of the page and view the result of the custom SQL statement on the Run result tab.
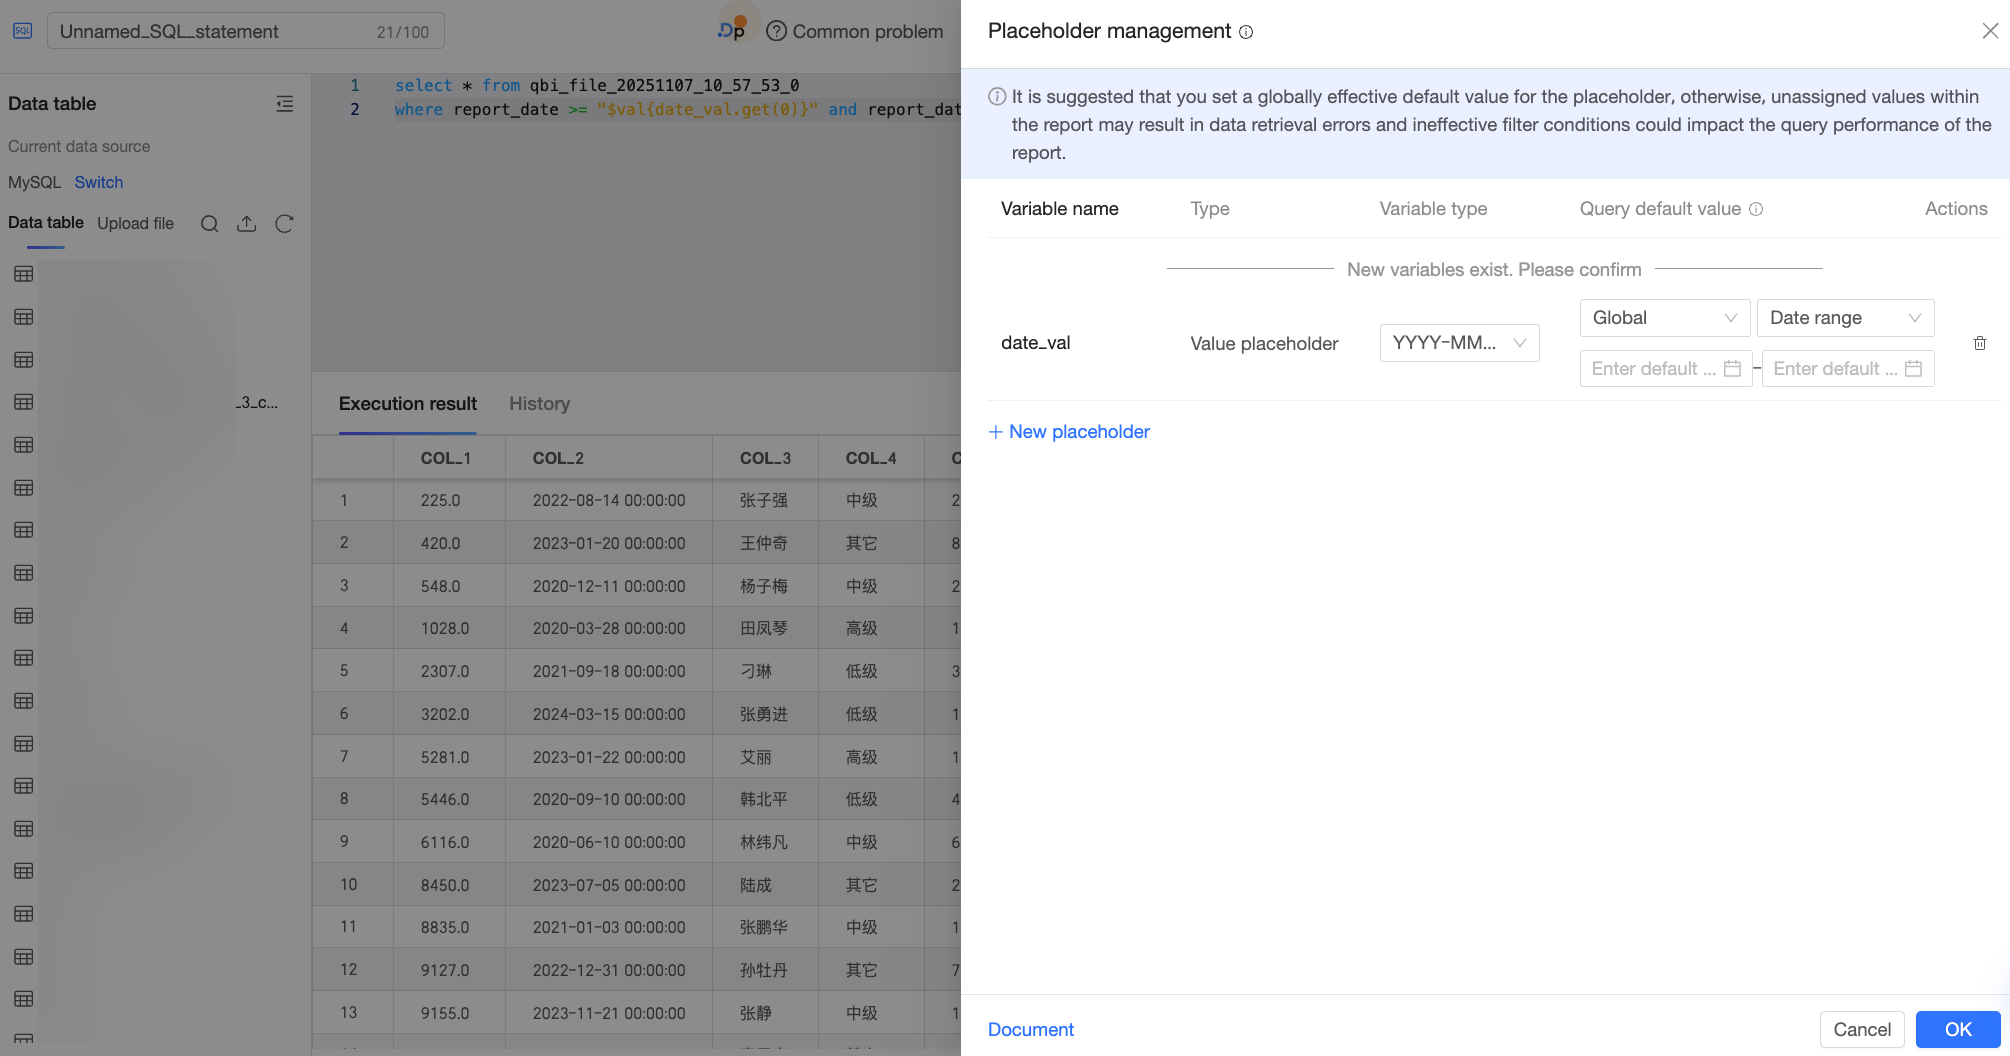
After you confirm that the result is correct, click Confirm edit. The system detects the placeholder referenced in the SQL statement and adds it to the placeholder list. Then, configure the placeholder's information in the Placeholder management dialog box on the right and click Confirm.
In this example, to enable the month-over-year comparison, set Variable type to Date - YYYY-MM-DD.
NoteEnsure that the placeholder you create is a value placeholder. Otherwise, the period-over-period and year-over-year comparison cannot be calculated correctly.
Period-over-period and year-over-year comparisons require that placeholders are configured correctly in the dataset. For more information about configuring placeholders, see Placeholders.
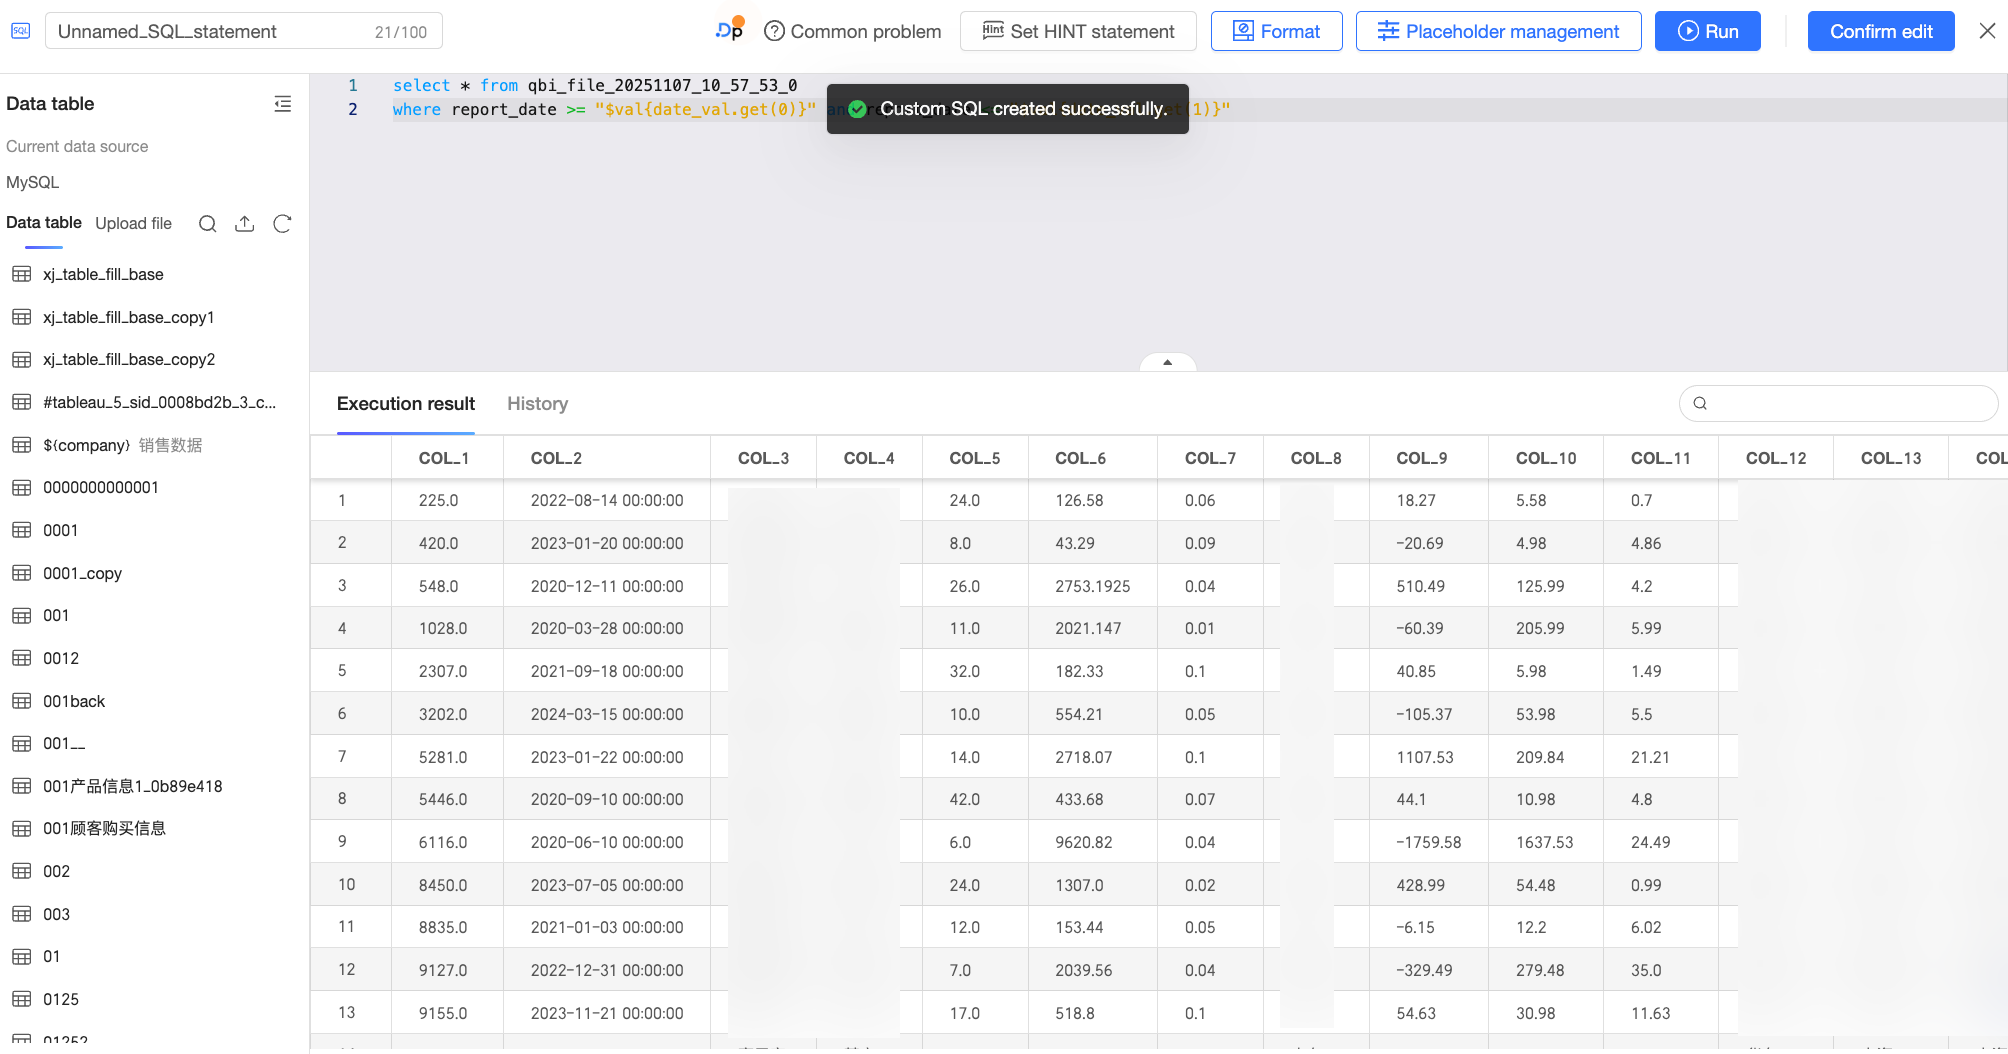
Click Confirm edit again to save the custom SQL.
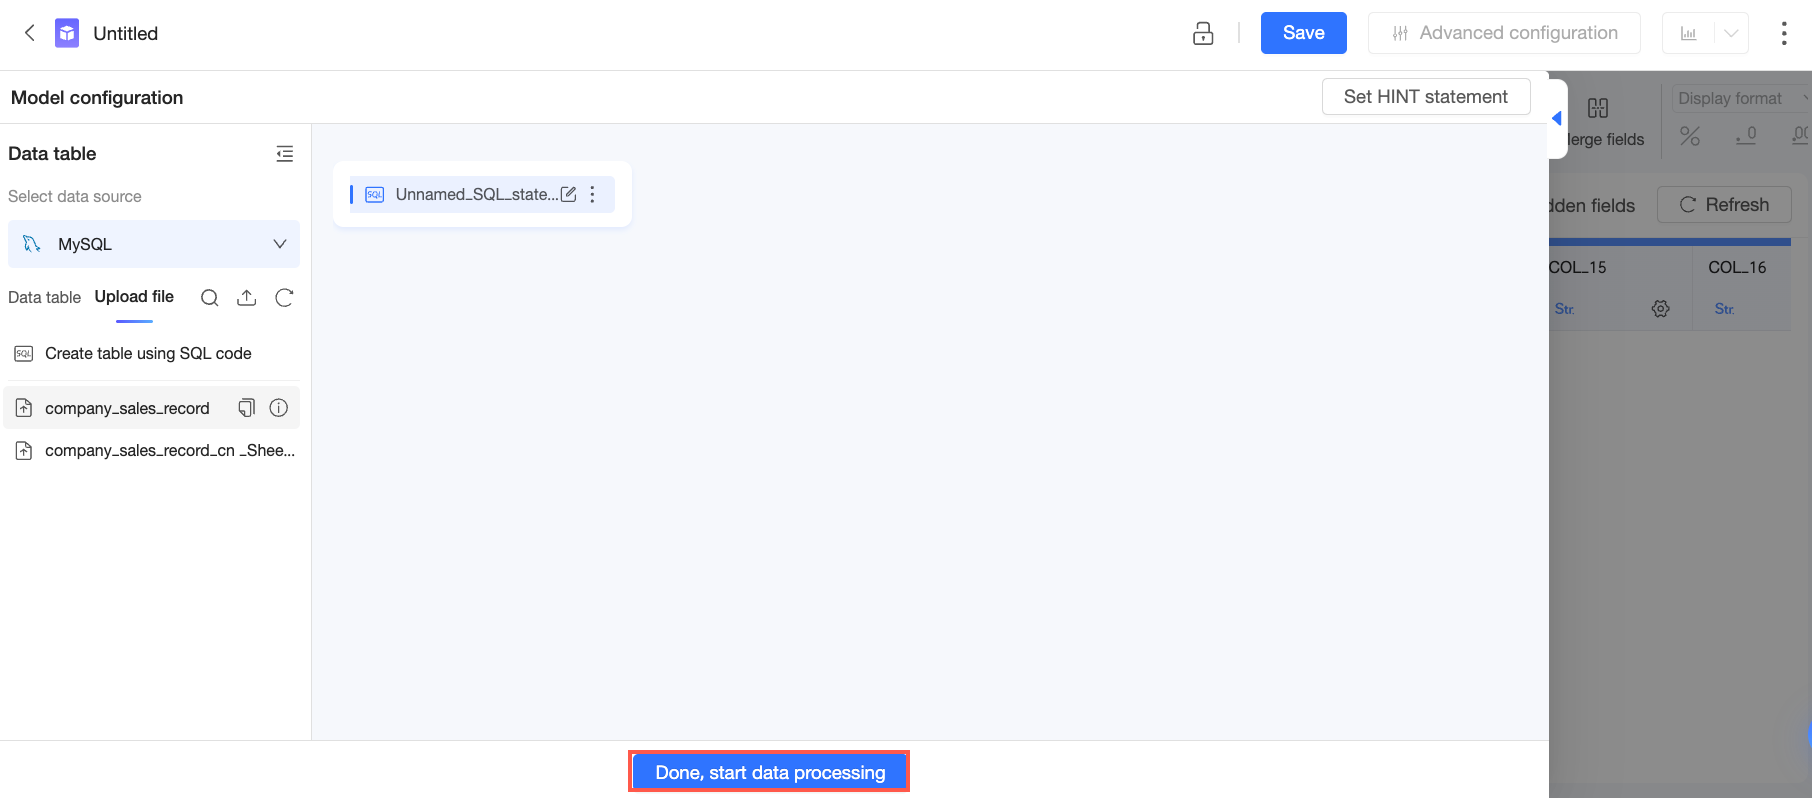
Close the custom SQL page. On the dataset editing page, click Start data processing to configure the dataset, for example, by adjusting field types or creating calculated fields. For more information, see Data processing.
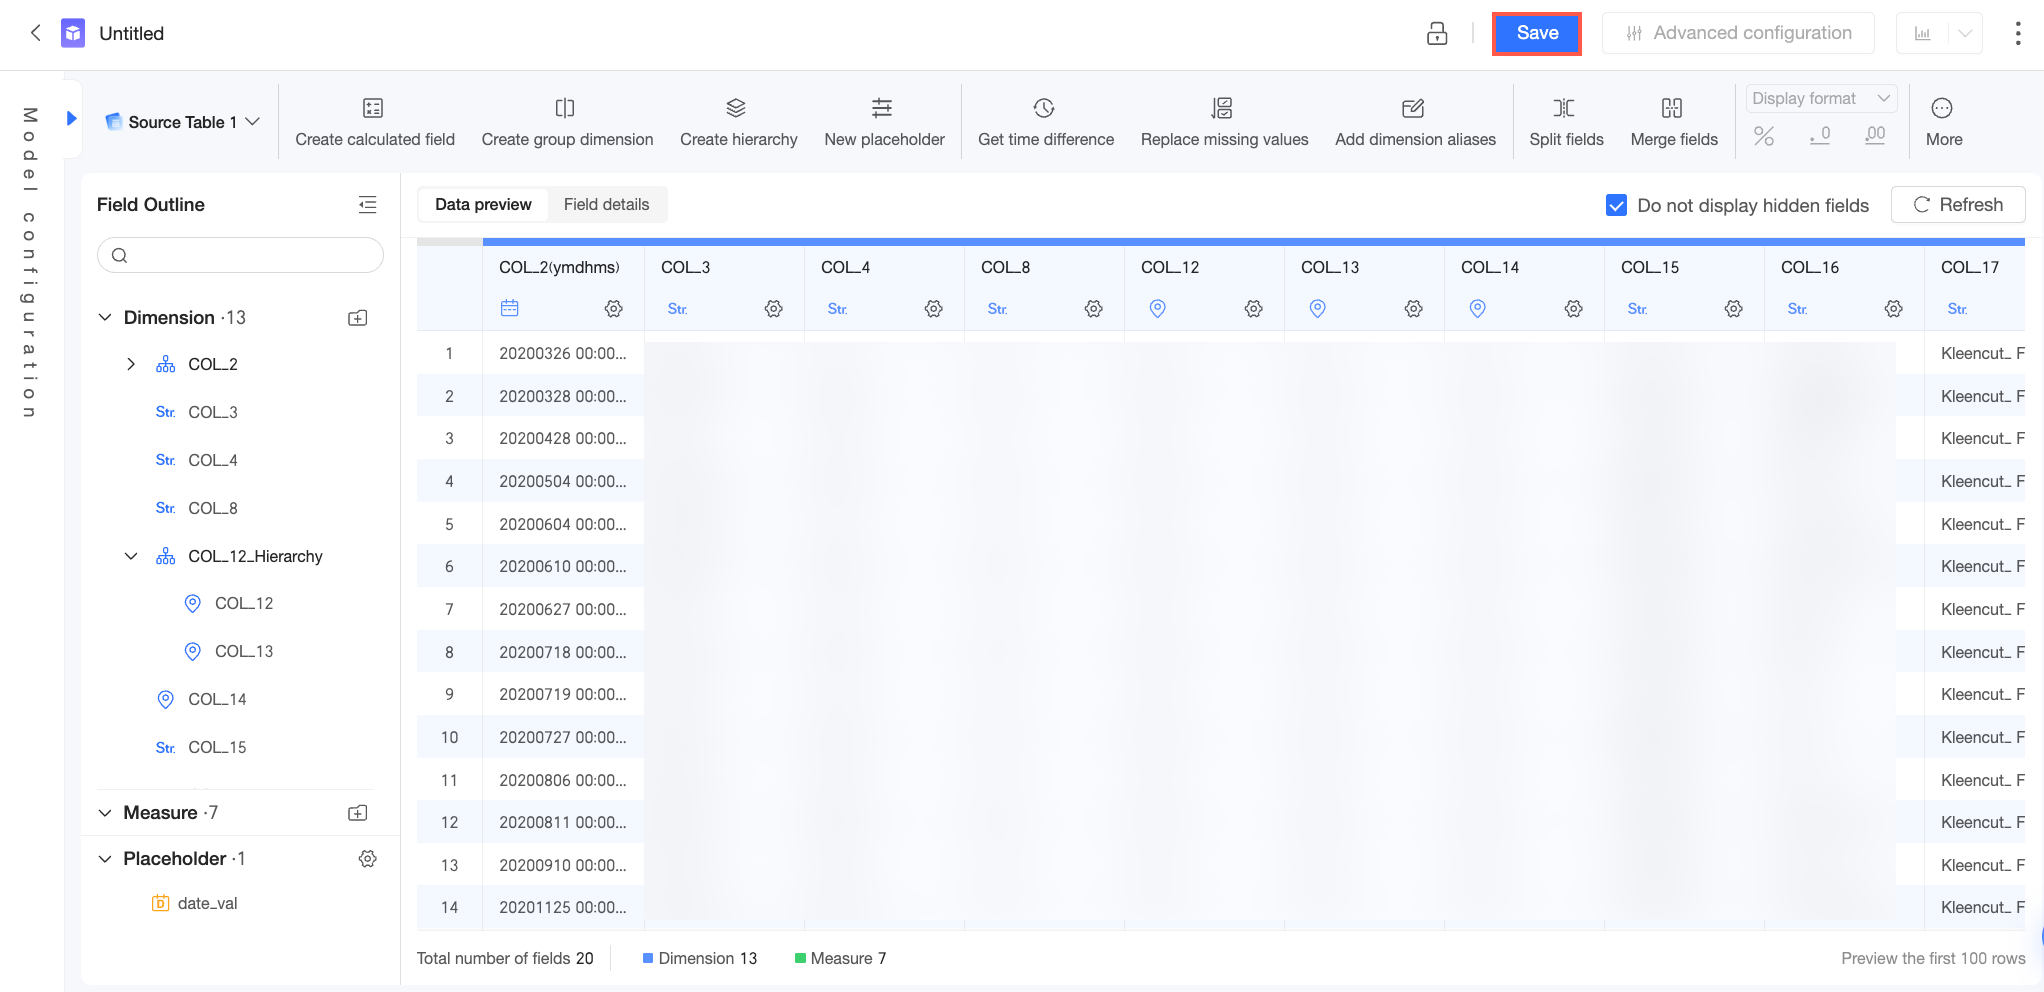
After you complete the configuration, click Save in the upper-right corner to create the dataset.
Dashboard configuration: Create a dashboard using the saved dataset.
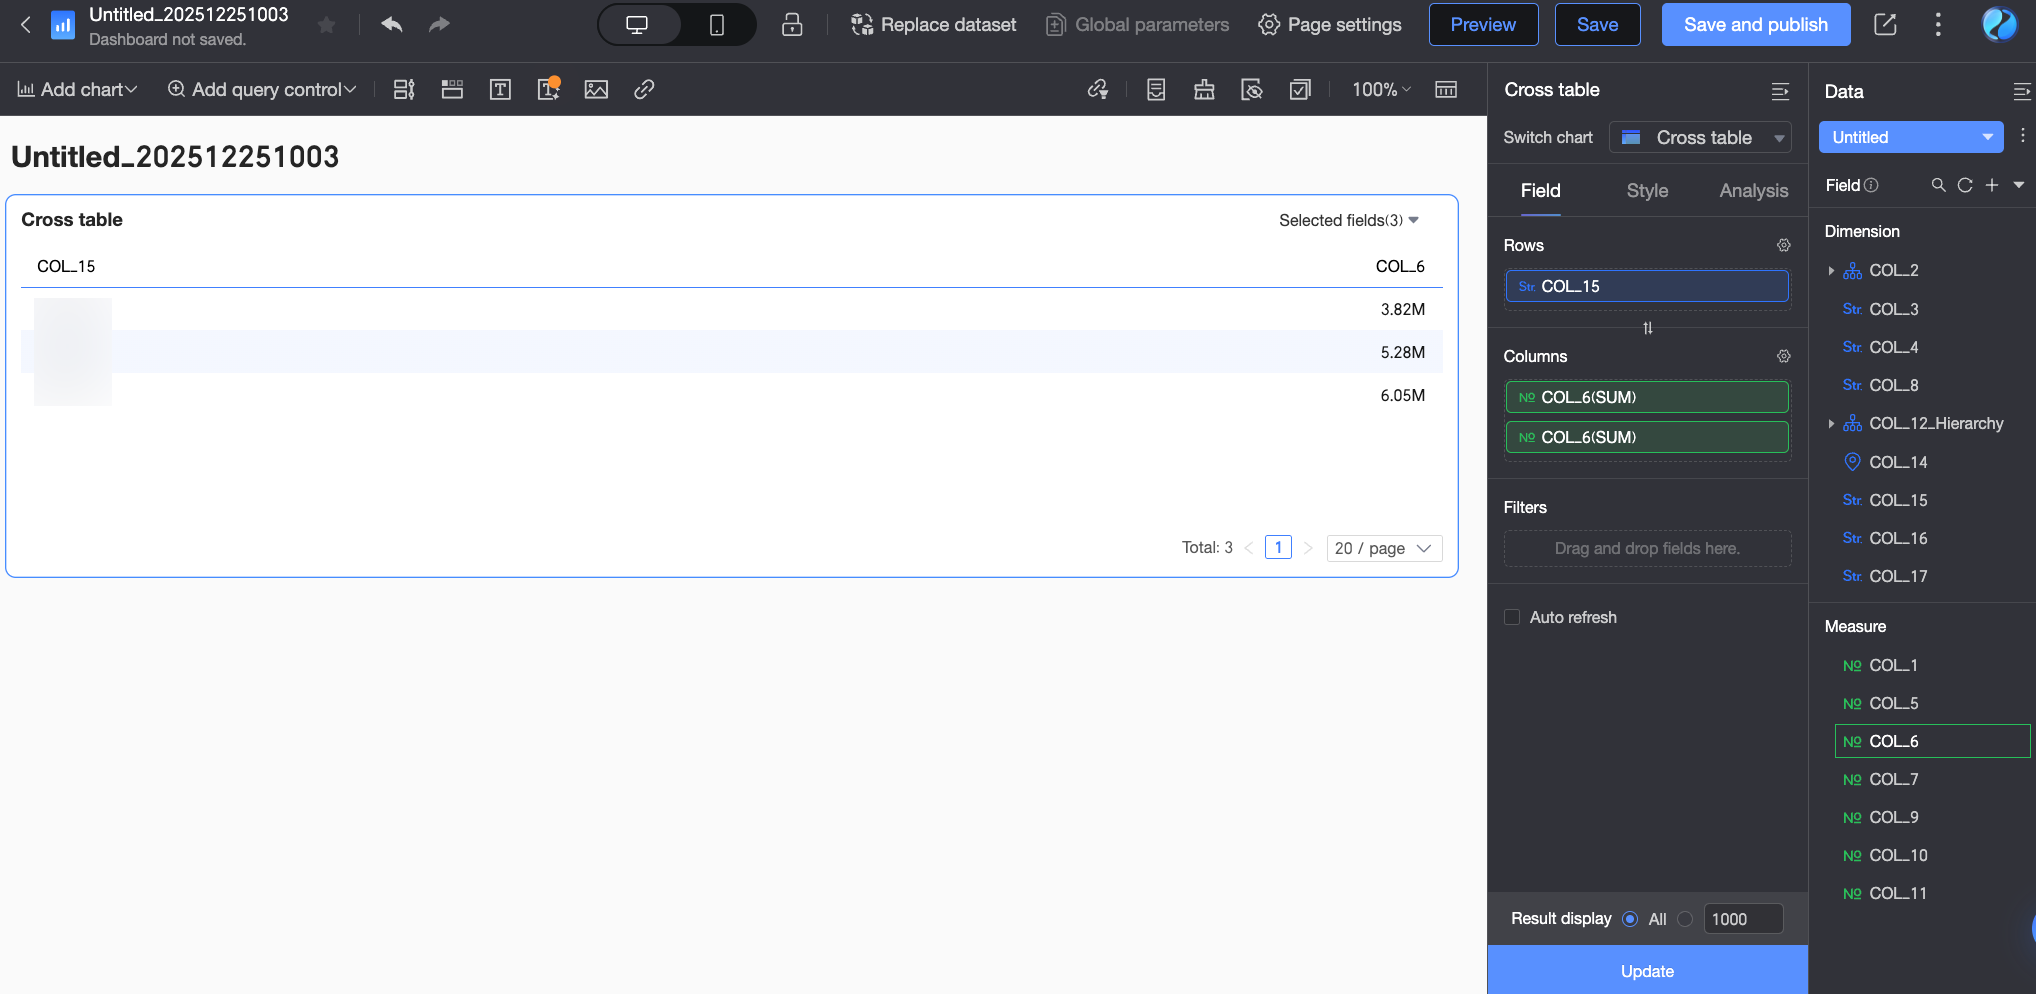
On the dashboard edit page, add a crosstab and configure its fields using the dataset from the previous step. To calculate the month-over-year comparison for the order amount, drag two Order Amount fields to the Columns area.
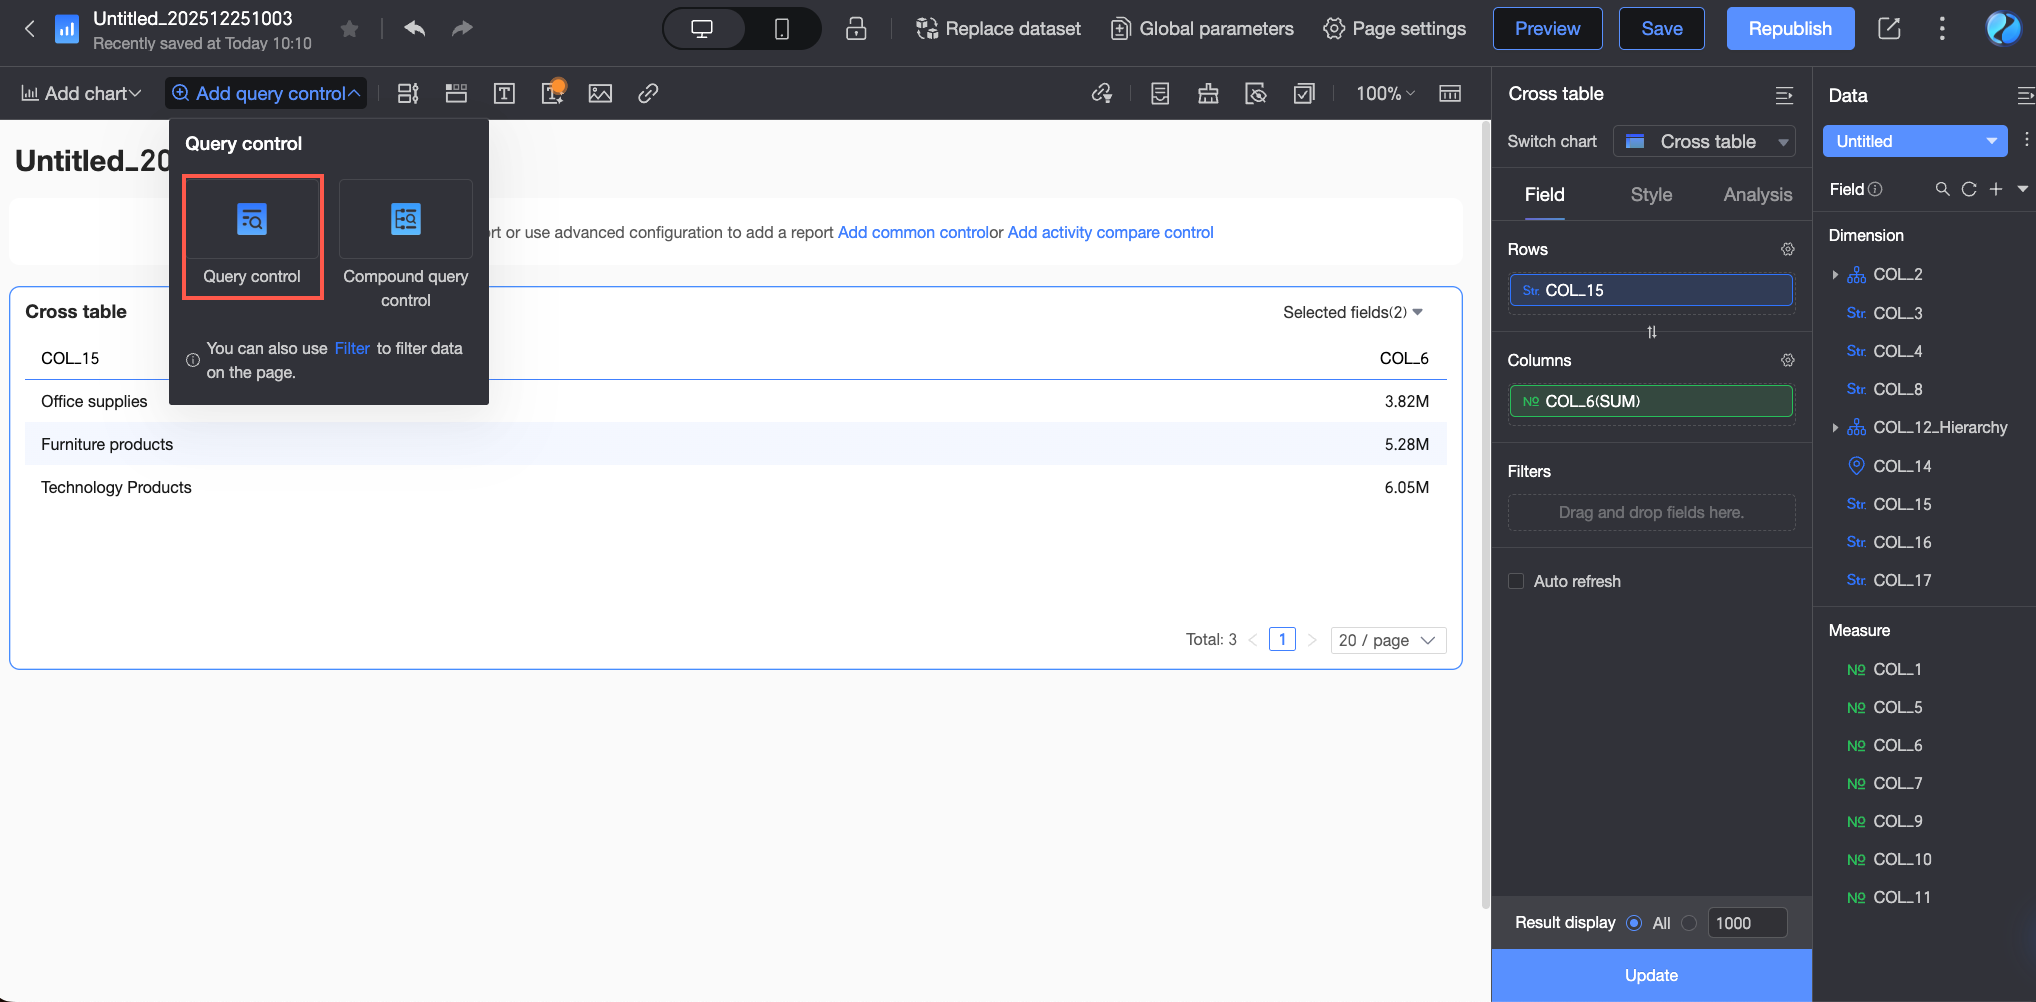
Click Add query control > Query control to add an empty query control to the chart.
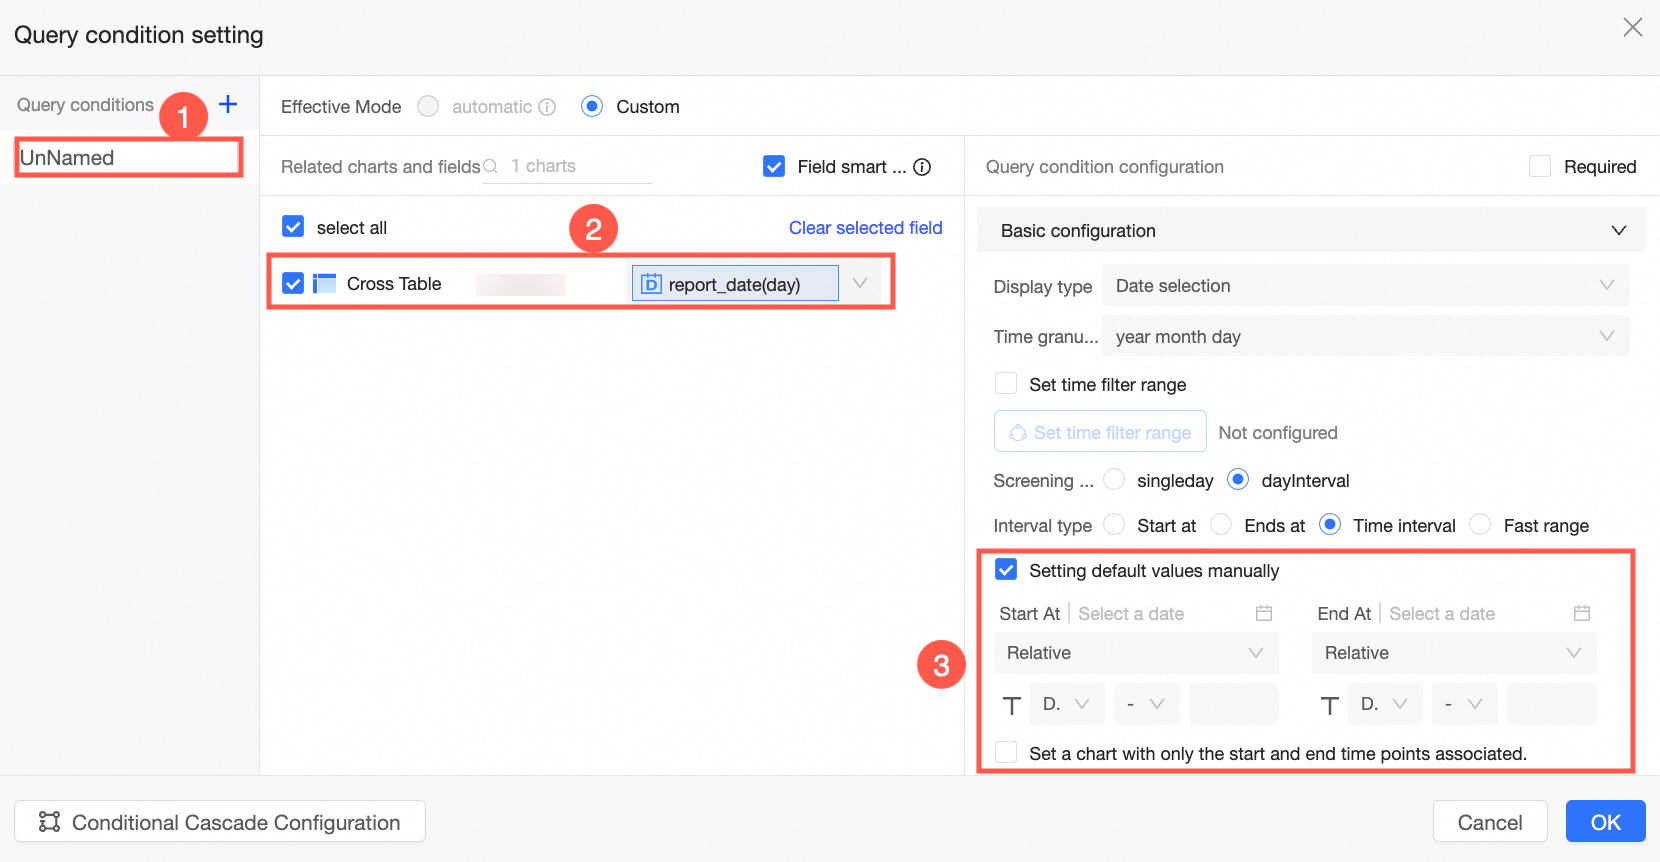
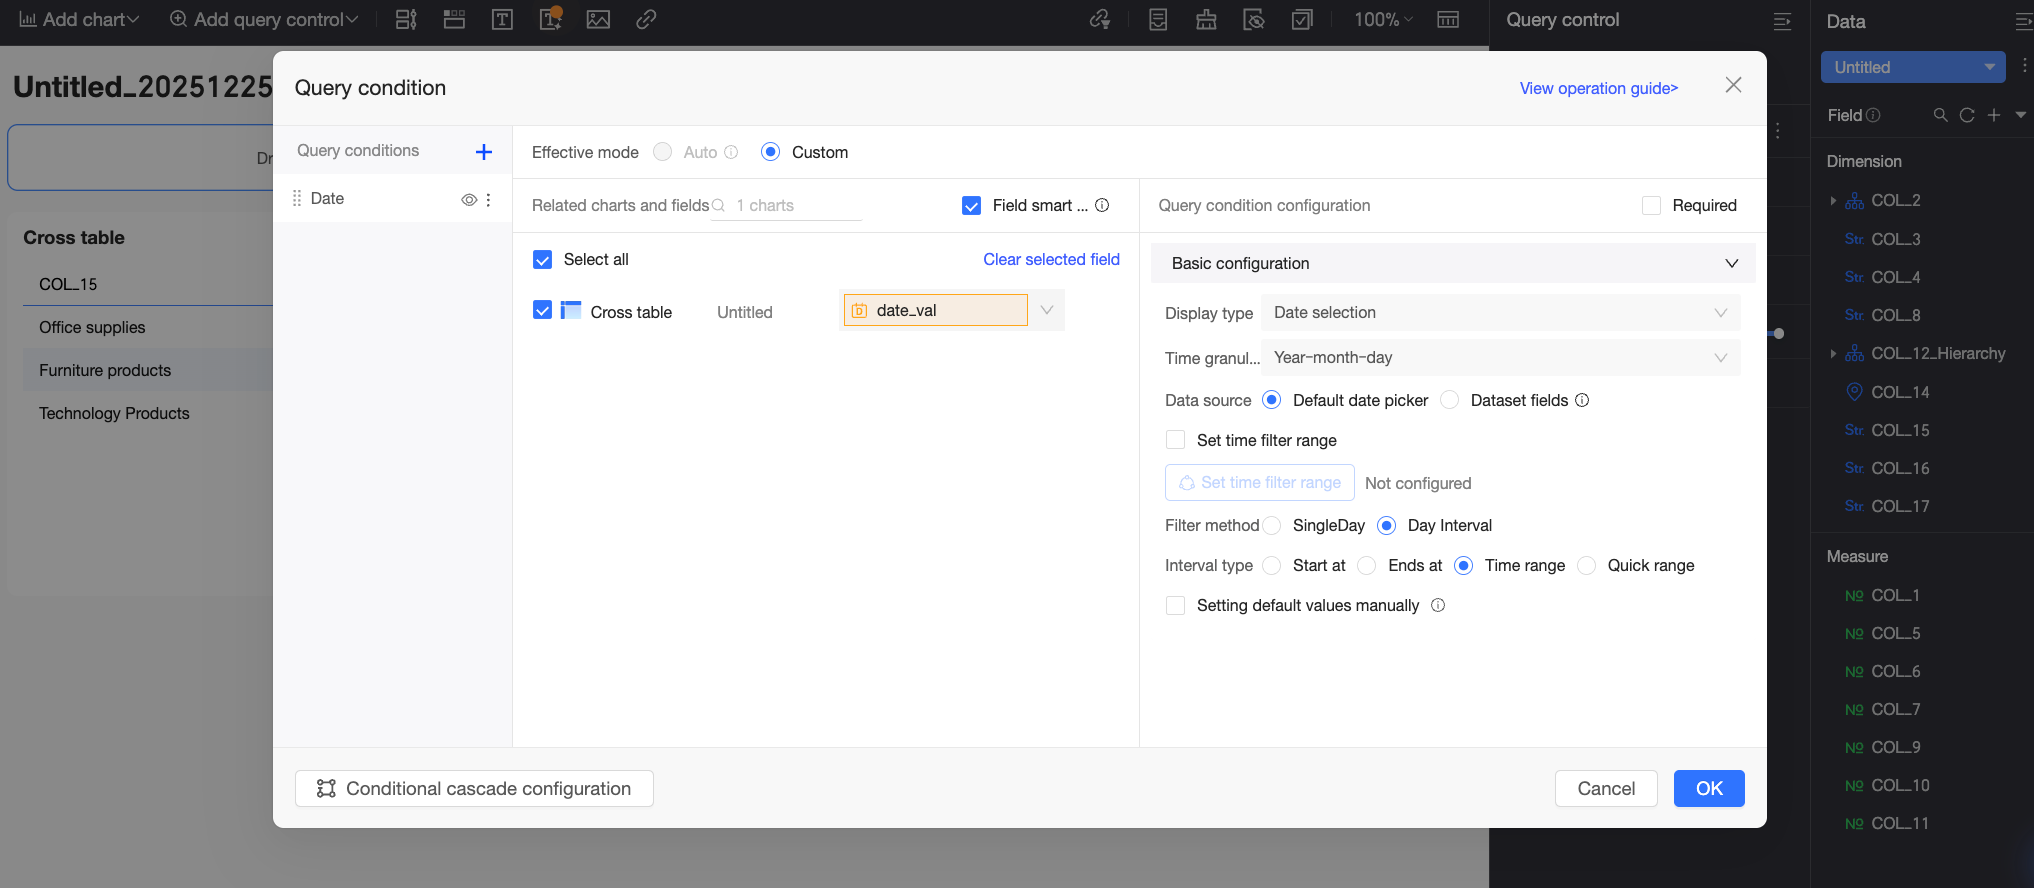
Click Add general control. In the Query condition settings dialog box, configure the query control and click OK.
In this example, name the query control Time selection, associate it with the crosstab in the current dashboard, and bind it to the value placeholder
date_valfrom the dataset used by the crosstab. When a user selects a date in the query control, the value is passed to the dataset's SQL query. This refreshes the crosstab to show the order amount for that date.For more information on configuring query controls, see Query control.
Period-over-period and year-over-year comparison configuration: Configure the comparison for the order amount field.
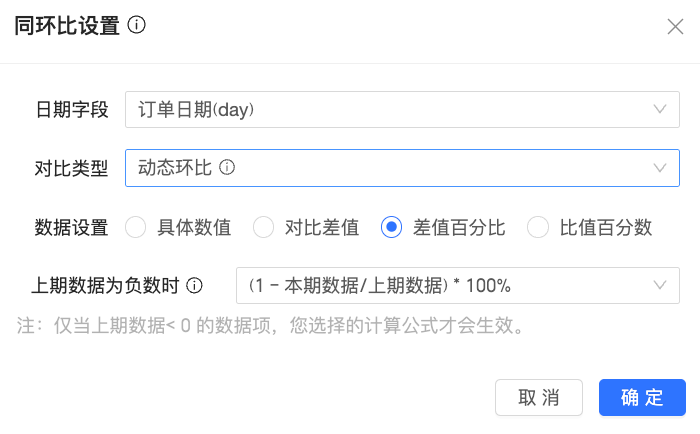
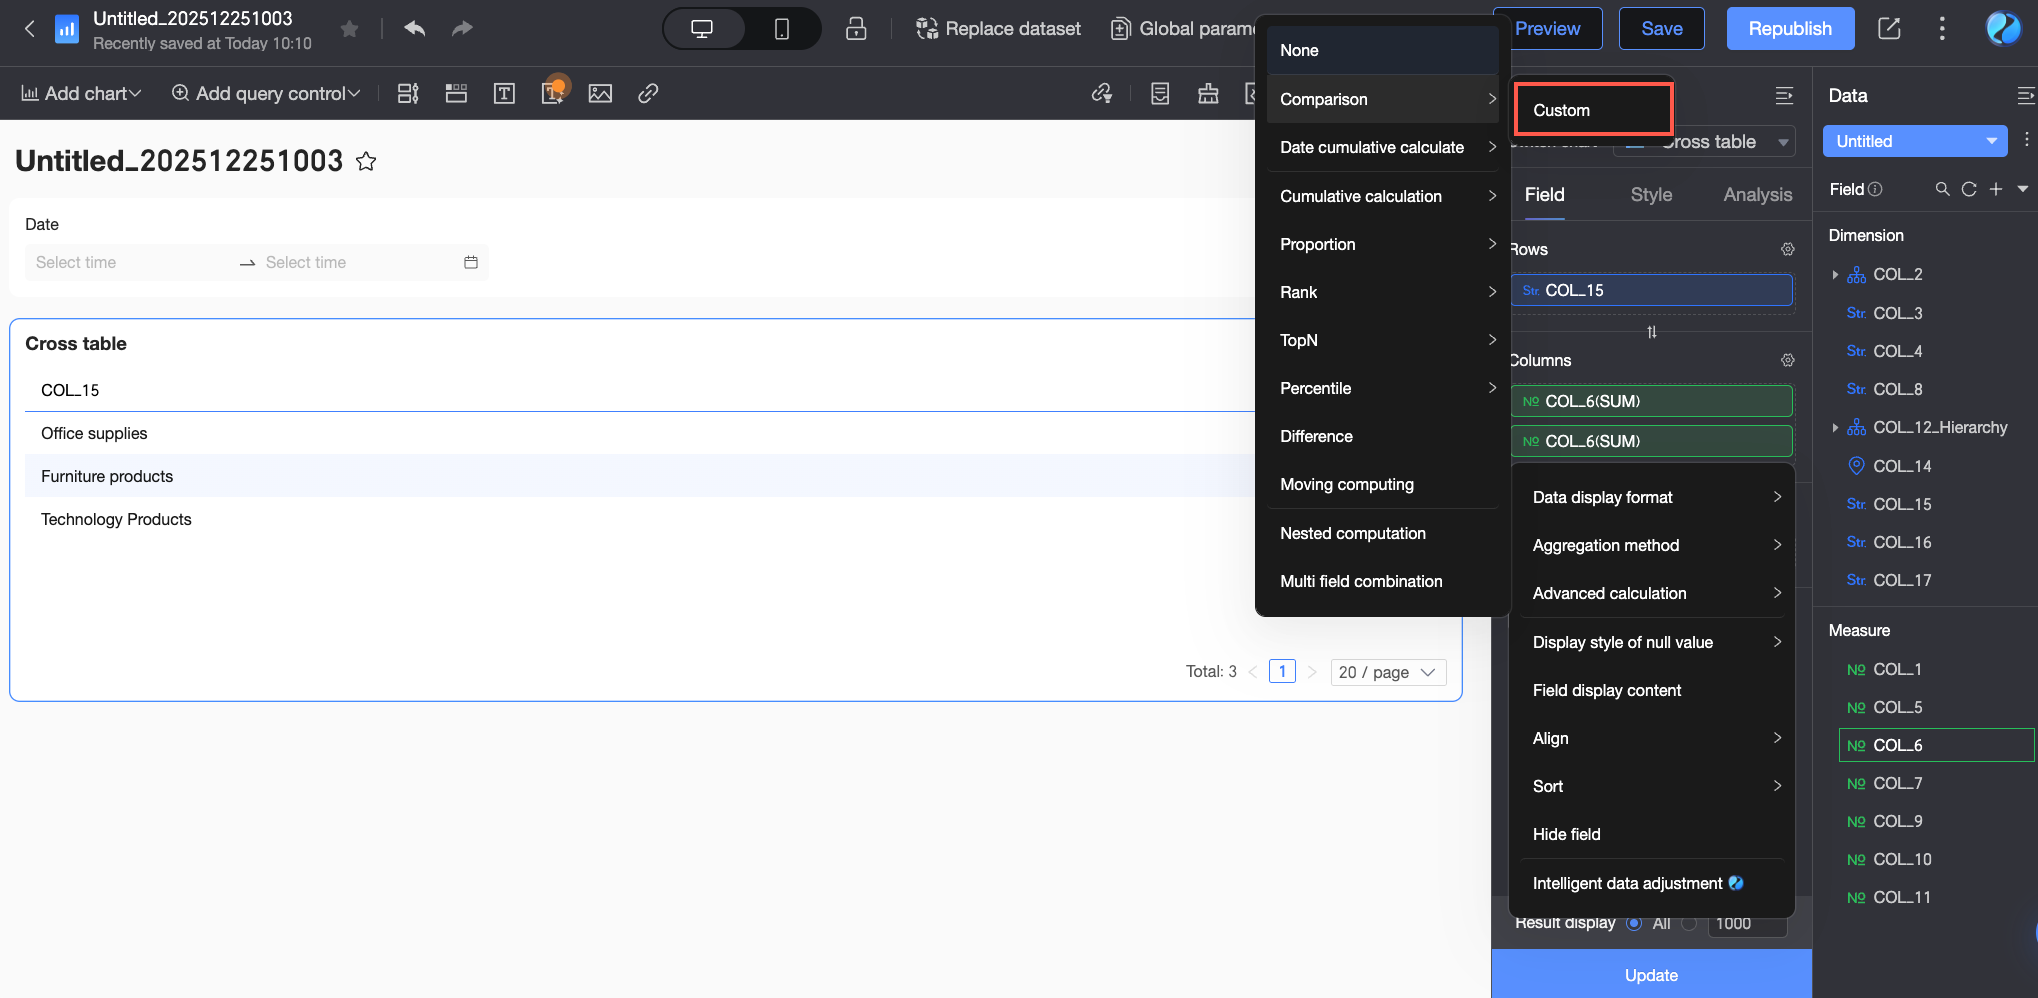
In the crosstab's field configuration panel, open the period-over-period and year-over-year comparison settings as shown in the figure.
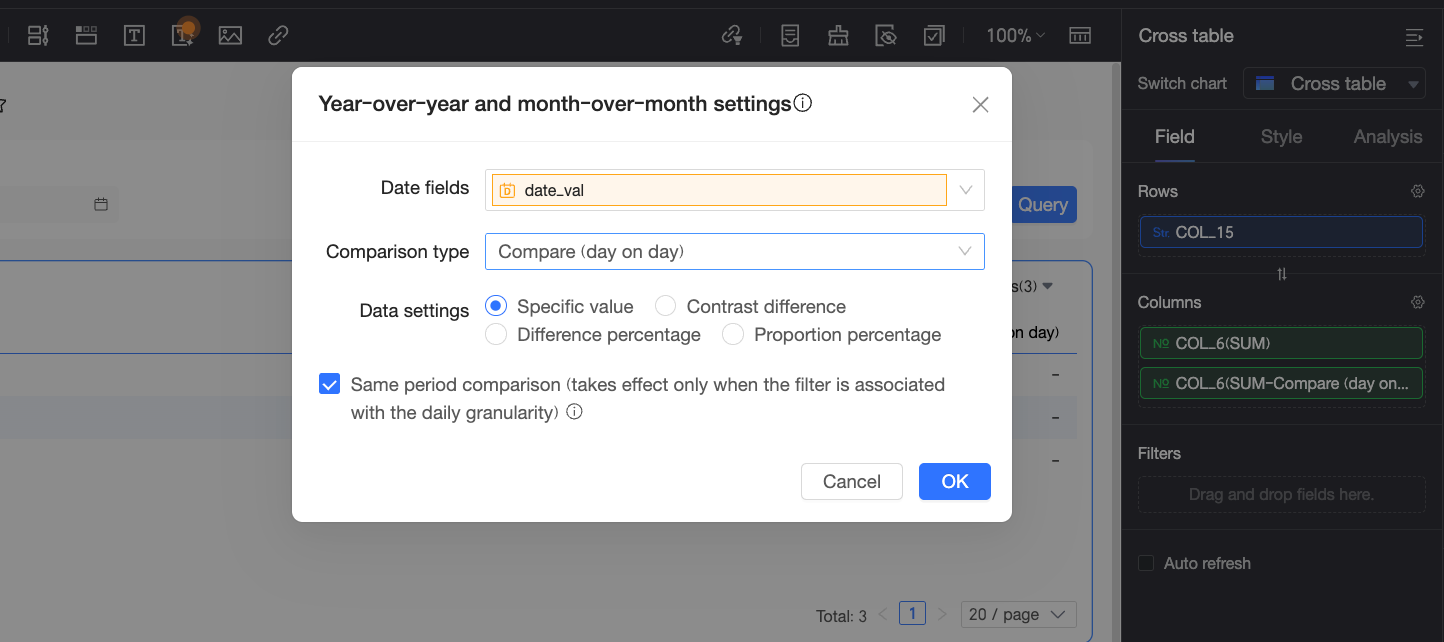
In the YoY and QoQ settings dialog box, configure Date field, Comparison type, and Data settings.
In this example, set Date field to the date placeholder
date_val. The date values passed to this placeholder serve as the comparison baseline. Set Comparison type to Month-over-year and Data settings to Specific value.NoteEnsure that the placeholder selected for the Date field matches the placeholder bound to the query control. Otherwise, the calculation will fail.
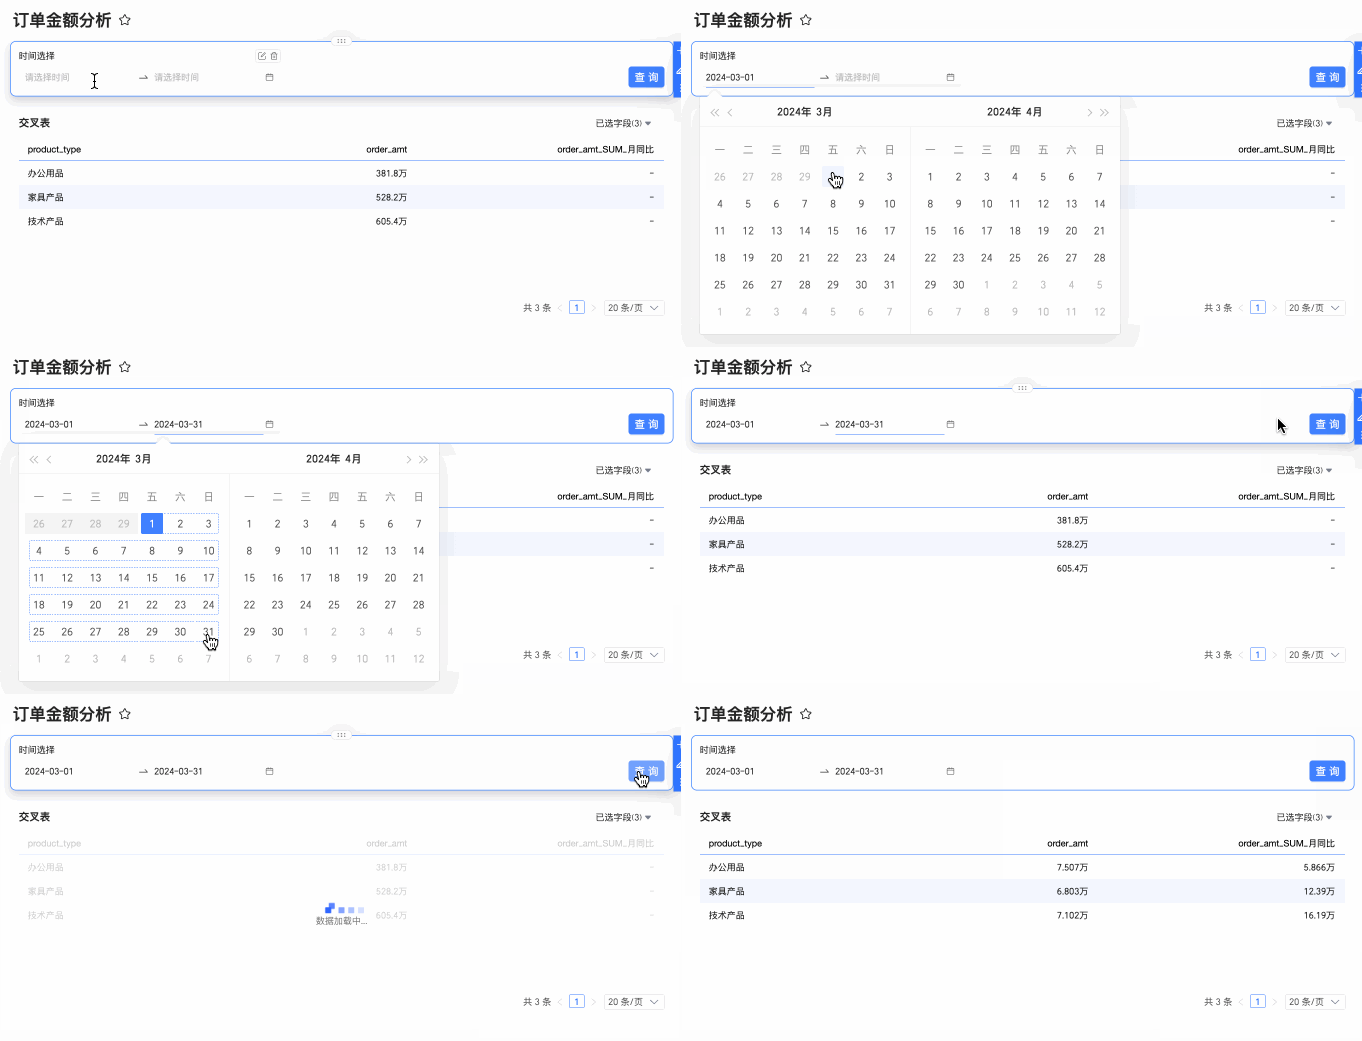
After you complete the configuration, click OK. The following figure shows the final result.
Custom configuration
Custom configuration lets you set a custom comparison date. This example shows how to configure the order amount field in a crosstab to show month-over-month (2 months prior) data.
On the Fields tab of the dashboard edit page, add fields and configure a period-over-period comparison.
Add fields.
From the Dimensions list, double-click or drag Region and Order Date (month) to the Rows area.
From the Measures list, double-click or drag Order Amount to the Columns area. Add a second Order Amount field to the Columns area.
Hover over the Order Amount measure, click the
icon on the right, and select Advanced Calculation > Period-over-Period Comparison > Custom.On the Period-over-Period Settings page, configure the date field, comparison type, and data settings.
Set the date field to Order Date (month), the comparison type to Custom, the comparison date to 2 months ago, and the data setting to Difference.
NoteData settings include Specific Value, Difference, Percentage Difference, and Percentage of Ratio.
Click OK, and then click update.
Add and configure a filter control.
NoteThe date field in the filter control must match the one used in the period-over-period settings. For this example, that field is Order Date (month).
On the dashboard edit page, select a date range and click query.


Advanced settings
When the date field in the YoY and MoM settings window is set to By Day, you can use the advanced settings to set the comparison date to options such as "First Day of This Month", "Last Day of Last Month", "First Day of This Quarter", "Last Day of Last Quarter", "First Day of This Year", or "Last Day of Last Year". This example configures the order amount field in a crosstab to compare it with data from the First Day of This Month.
On the Fields tab of the dashboard edit page, add fields and configure a period-over-period comparison.
Add fields.
From the Dimensions list, double-click or drag region and order date (day) to the Rows area.
From the Measures list, double-click or drag order amount to the Columns area. For this example, add two order amount fields to the Columns area.
Hover over the order amount measure, click the
icon on the right, and then select Advanced Calculation > period-over-period comparison > Custom.On the period-over-period comparison settings page, configure the date field, comparison type, and data settings.
In this example, set the date field to order date (day), the comparison type to Advanced Configuration, the comparison date to Beginning of this month, and the data setting to difference.
NoteThe data settings include actual value, difference, percent difference, and ratio percentage.
Click OK and then Update.
Add and configure query conditions.
NoteThe date field in the query control must match the one used for the period-over-period comparison.
On the dashboard edit page, select a date range and click Query.


Special scenarios
When a year-over-year and month-over-month calculation is configured for a chart, the configuration automatically adjusts as you drill down, switch a dimension group, or filter fields. The following rules apply.
Drill down
Drilling down automatically adjusts the YoY and PoP comparison to the new granularity. For example, drilling down from a year to its quarters changes the year-over-year (YoY) comparison to a quarter-over-quarter (QoQ) comparison.
Drilling down into a field that lacks period-over-period granularity (such as region, hour, minute, or second) removes the date field from the chart, while leaving the comparison type consistent with the parent level.
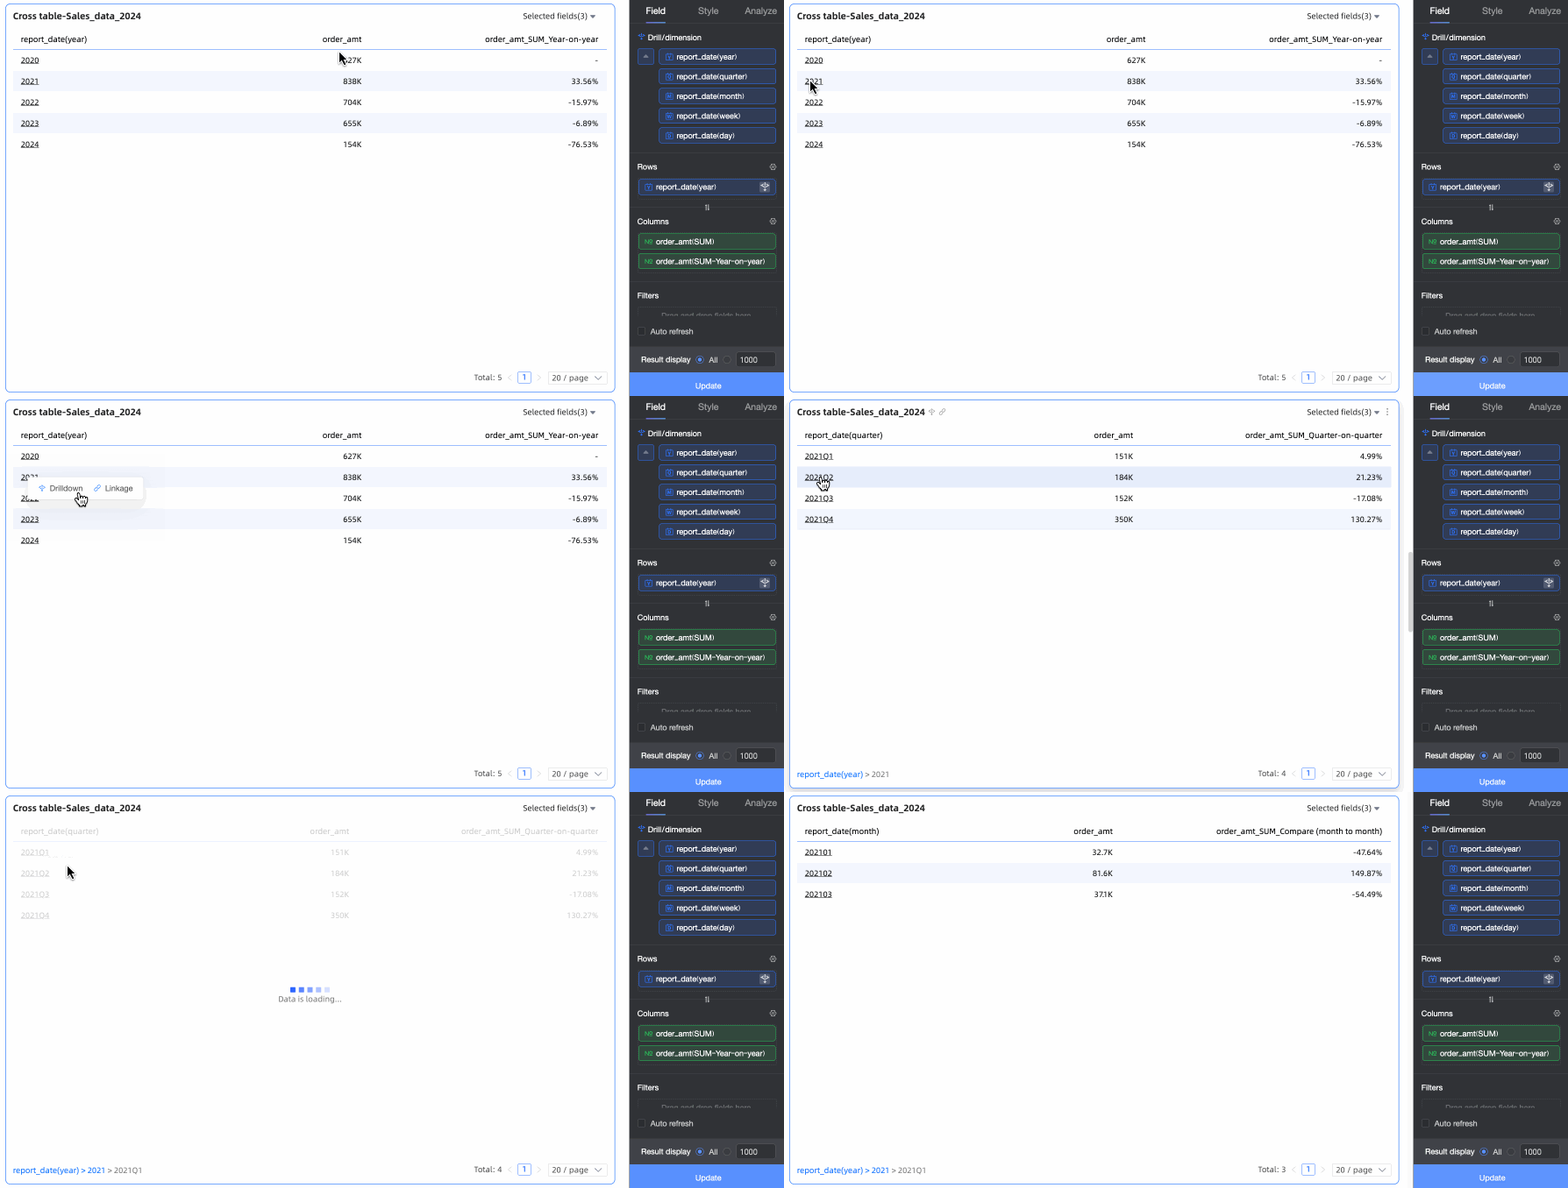
When you drill down, a chain-on-chain comparison adjusts to the new granularity, while a year-over-year comparison remains year-over-year.
Initial granularity | Configured comparison | Drill-down comparison | |||
Quarter | Month | Week | Day | ||
year | year-over-year | quarter-over-quarter | month-over-month | week-over-week | day-over-day |
quarter | quarter-over-quarter | / | month-over-month | week-over-week | day-over-day |
year-over-year | / | year-over-year | |||
month | month-over-month | / | / | week-over-week | day-over-day |
year-over-year | / | / | year-over-year | ||
week | week-over-week | / | / | / | day-over-day |
year-over-year | / | / | / | year-over-year | |
Dimension group switching
When you switch dimensions in a chart with a configured dimension group, the period-over-period comparison automatically adjusts to the new granularity. For example, if you switch a date dimension group from year to quarter, the YoY comparison automatically becomes a QoQ comparison.
If you switch the dimension group to a non-date field or another date field, the year-over-year and month-over-month configuration remains unchanged. However, the calculation depends on the filter conditions in the query control; otherwise, it will return a null value.
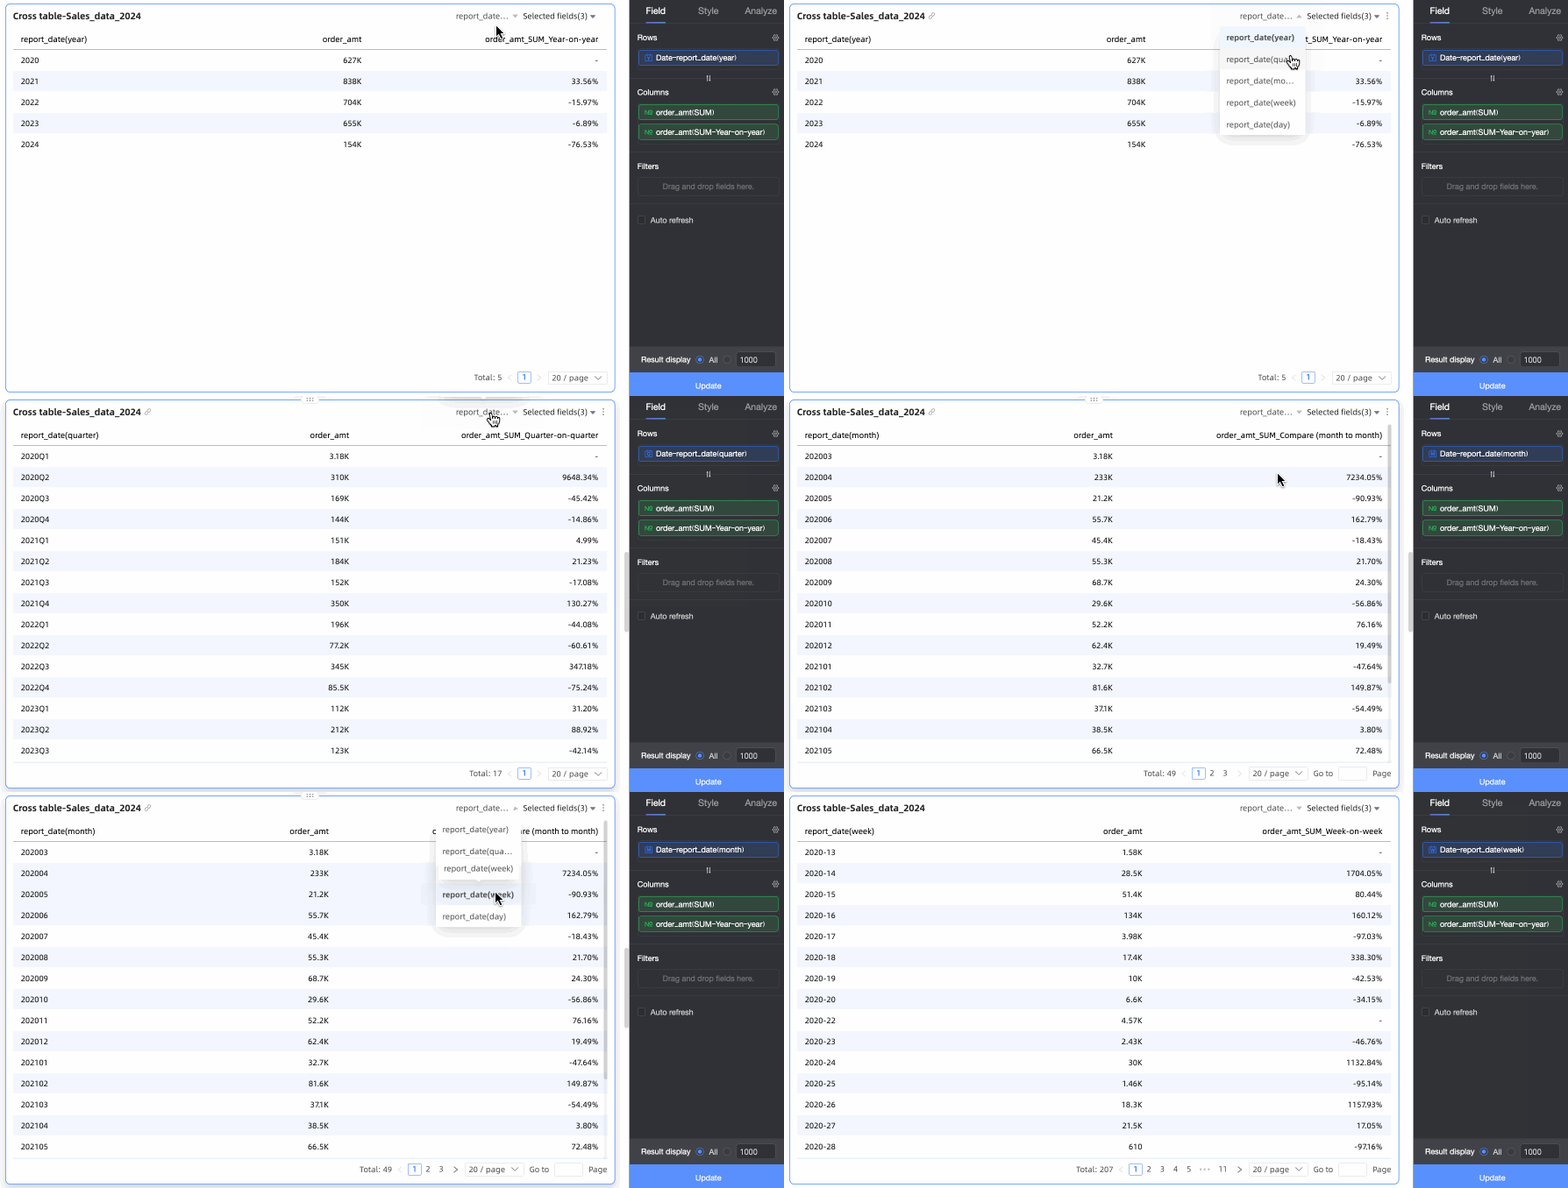
A hyphen (-) indicates that the YoY and MoM comparison is not available for an item. Selecting such an item disables the comparison, displays only the base data, and clears the current secondary metric.
Comparison type | Comparison granularity | Default comparison | Resulting comparison | ||||
Year | Quarter | Month | Week | Day | |||
Period-over-period comparison | Year | year-over-year (YoY) | year-over-year (YoY) | quarter-over-quarter (QoQ) | month-over-month (MoM) | week-over-week (WoW) | day-over-day (DoD) |
Quarter | quarter-over-quarter (QoQ) | year-over-year (YoY) | quarter-over-quarter (QoQ) | month-over-month (MoM) | week-over-week (WoW) | day-over-day (DoD) | |
Month | month-over-month (MoM) | year-over-year (YoY) | quarter-over-quarter (QoQ) | month-over-month (MoM) | week-over-week (WoW) | day-over-day (DoD) | |
Week | week-over-week (WoW) | year-over-year (YoY) | quarter-over-quarter (QoQ) | month-over-month (MoM) | week-over-week (WoW) | day-over-day (DoD) | |
Day | day-over-day (DoD) | year-over-year (YoY) | quarter-over-quarter (QoQ) | month-over-month (MoM) | week-over-week (WoW) | day-over-day (DoD) | |
Corresponding-period comparison | Quarter | year-over-year (YoY) | - | year-over-year (YoY) | |||
Month | year-over-year (YoY) | - | year-over-year (YoY) | ||||
Week | year-over-year (YoY) | - | year-over-year (YoY) | ||||
Day | year-over-year (YoY) | - | year-over-year (YoY) | ||||
Day | month-over-month (MoM) | - | month-over-month (MoM) | ||||
Day | week-over-week (WoW) | - | week-over-week (WoW) | ||||
Field filtering
When you filter fields in the chart's Selected Fields area, the chart automatically applies a period-over-period comparison based on the date field with the finest granularity. For example, if a chart includes date fields for year, quarter, month, week, and day, it uses a day-over-day comparison. If you remove the day field, the chart automatically switches to a week-over-week comparison.
If a filter removes all period-over-period date fields from the chart—and thus all granularities—the period-over-period comparison configuration is unaffected. The calculation must then use the filter conditions in the query control; otherwise, it returns a null value.
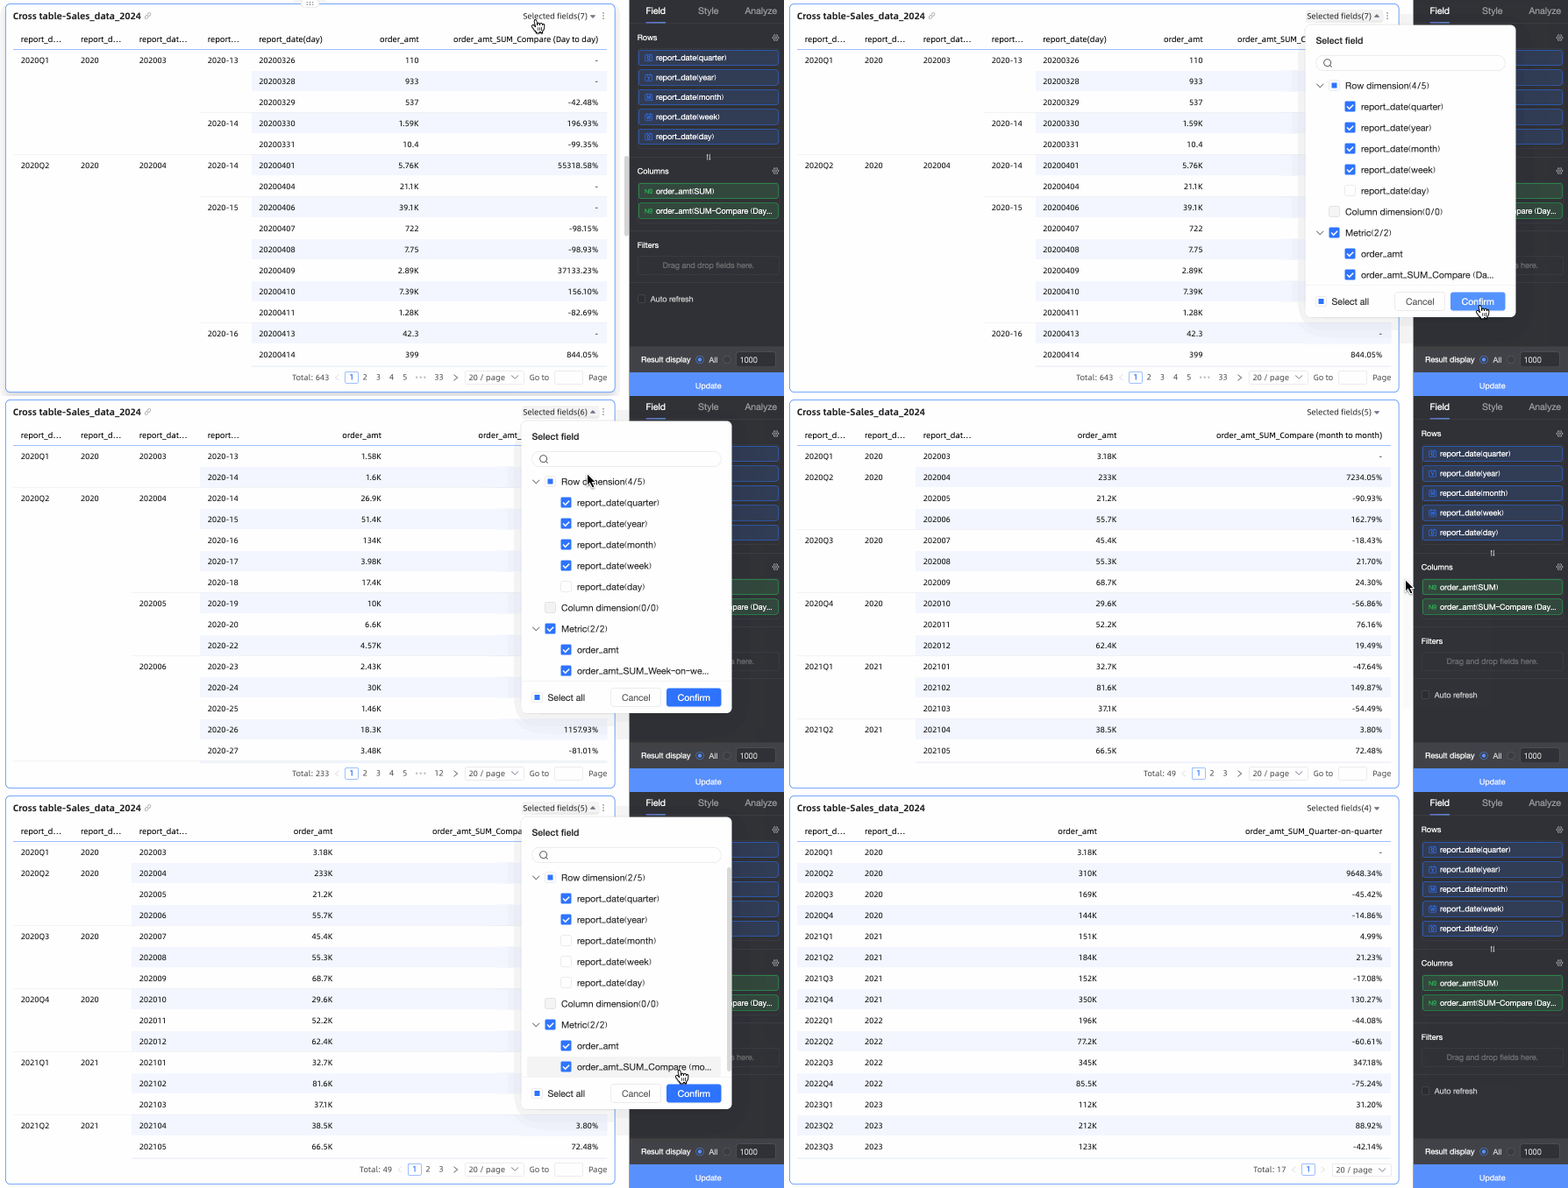
The rules are the same as those for dimension group switching.
Troubleshoot missing comparison data
Ensure the dataset contains data for the comparison period. For example, if the dataset only contains data for 2020 and not for 2019, the year-over-year comparison displays - for all entries.
If no date field is configured in the data configuration, you must configure both the filter bar and the custom comparison date field.