Cumulative calculation
A cumulative calculation, or running total, sequentially sums the values in a result set. This shows the accumulation of a metric.
Prerequisites
You have created a dashboard. For more information, see Create a dashboard.
You have selected a target dataset and configured the chart fields. For more information, see Configure chart fields.
Limitations
Cumulative calculations exclude grand totals and subtotals. When this feature is enabled, they are disabled and displayed as "-".
Null values are excluded from the calculation. They do not affect other results and are displayed as "-".
This calculation runs on the returned result set. In the public cloud, a result set is limited to 10,000 rows. Results may be inaccurate if your data exceeds this limit.
The following table lists the chart types that support cumulative calculations.
Cumulative calculation method
Description
Supported chart types
Overall cumulative
Calculates a sequential, top-to-bottom running total for all measure values.
Line/Area charts: Line Chart, Area Chart, Stacked Area Chart, Percentage Stacked Area Chart, Combo Chart.
Column/Bar charts: Column Chart, Stacked Column Chart, Percentage Stacked Column Chart, Radial Bar Chart, Leaderboard, Bar Chart, Stacked Bar Chart, Percentage Stacked Bar Chart, Waterfall Chart, Bullet Chart, Box Plot, Histogram.
Bubble/Scatter charts: Bubble Chart, Scatter Plot, Faceted Scatter Plot.
Table charts: Crosstab, Detail table, Heatmap.
Pie/Ring charts: Pie Chart, Rose Chart, Radar Chart, Treemap.
Geo charts: Choropleth Map, Bubble Map, Heat Map, 3D Fly Line Map, Symbol Map.
Metric charts: KPI Card, KPI Trend Card.
Funnel/Conversion charts: Funnel Chart, Comparison Funnel Chart.
Other charts: Word Cloud.
In-group cumulative
Calculates a sequential, top-to-bottom running total for all measure values within each group.
Line/Area charts: Line Chart, Area Chart, Stacked Area Chart, Percentage Stacked Area Chart, Combo Chart.
Column/Bar charts: Column Chart, Stacked Column Chart, Percentage Stacked Column Chart, Bar Chart, Stacked Bar Chart, Percentage Stacked Bar Chart, Bullet Chart, Box Plot, Histogram.
Bubble/Scatter charts (the X-axis cannot be a measure): Bubble Chart, Scatter Plot, Faceted Scatter Plot.
Table charts: Crosstab, Heatmap.
Configuration
In the Fields panel of a chart, find the target measure. Click the  icon next to the measure, select Advanced calculation > Cumulative calculation, and then select the required cumulative type.

The available cumulative calculation methods differ for crosstabs and other chart types, as described in the following table.
Chart type | Cumulative calculation method | Condition | Calculation logic | |
Crosstab | Overall cumulative | N/A | Accumulates values sequentially from top to bottom across the entire dataset. | |
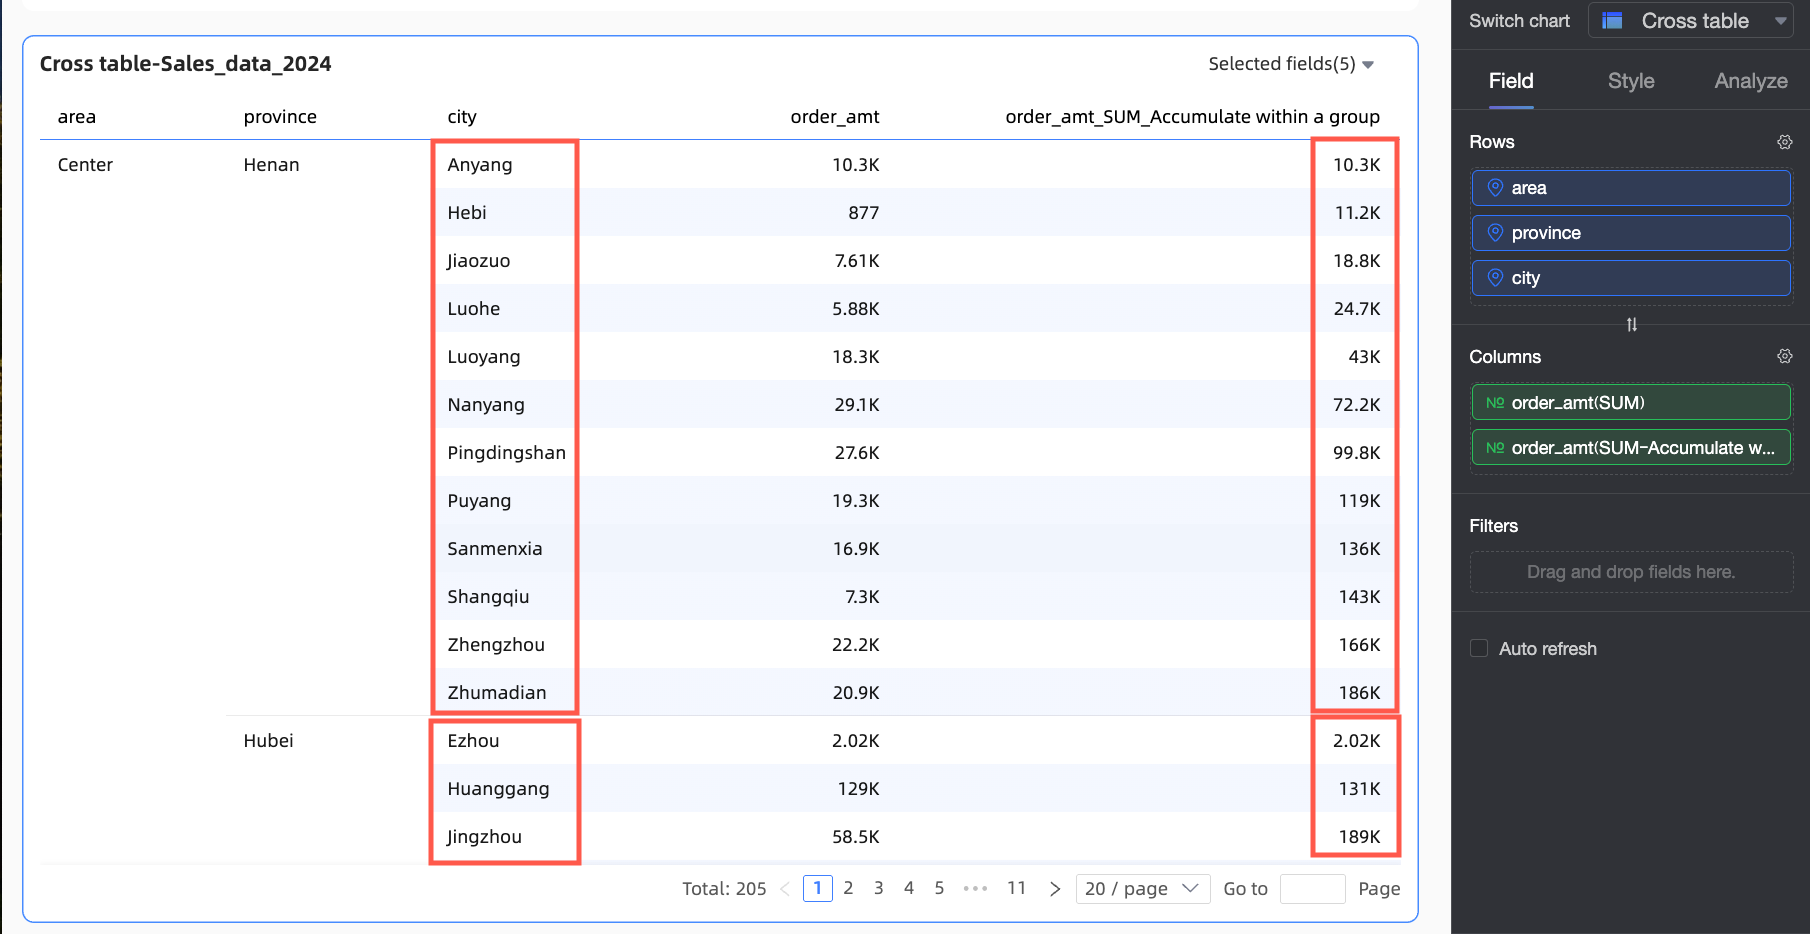
In-group cumulative | N/A | Groups data by the most granular dimension and calculates a running total within each group. For example, if you have the dimensions Region, Province, and City, data is grouped by City within its corresponding Province and Region before the calculation. | ||
Custom | Cumulative by column | The rows area contains at least one dimension field. | Accumulates values sequentially from top to bottom within a single column. | |
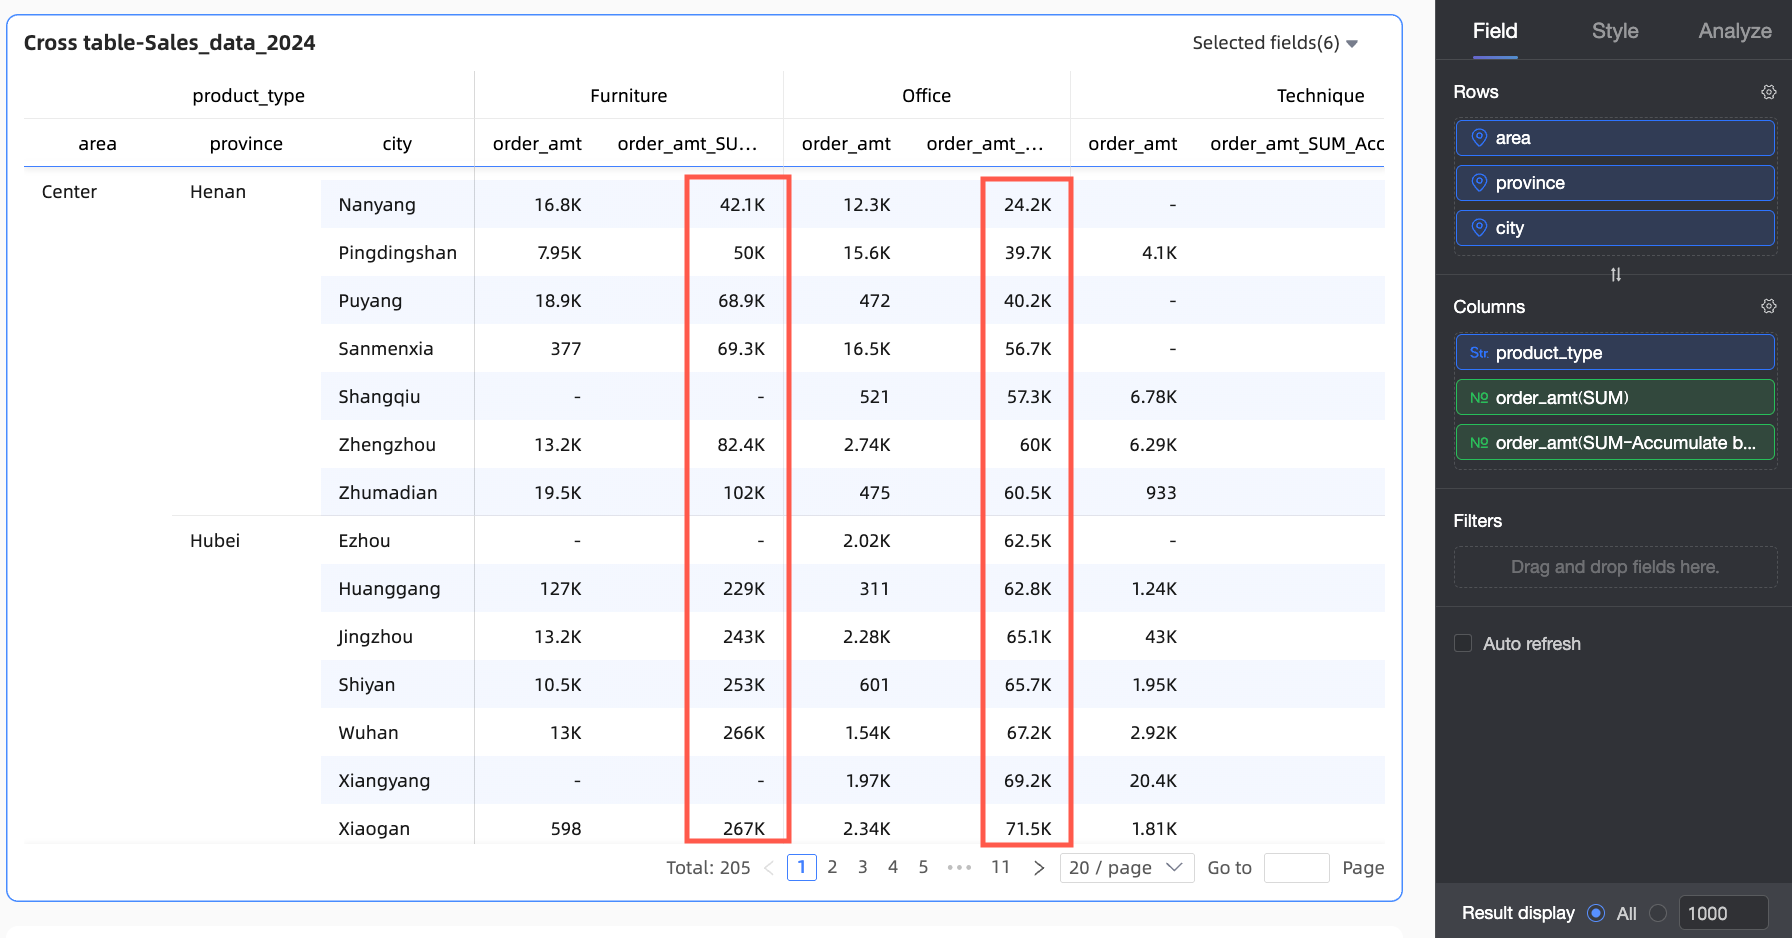
In-group cumulative by column | The rows area contains at least two dimension fields. | Groups data in a single column by a selected dimension and calculates a running total within each group. A group is formed by all dimensions from the first dimension in the rows area to the selected grouping dimension. For example, in the following figure, data is grouped by the Region and Province fields. | ||
Cumulative by row | The columns area contains at least one dimension field. | Accumulates values sequentially from left to right within a single row. | ||
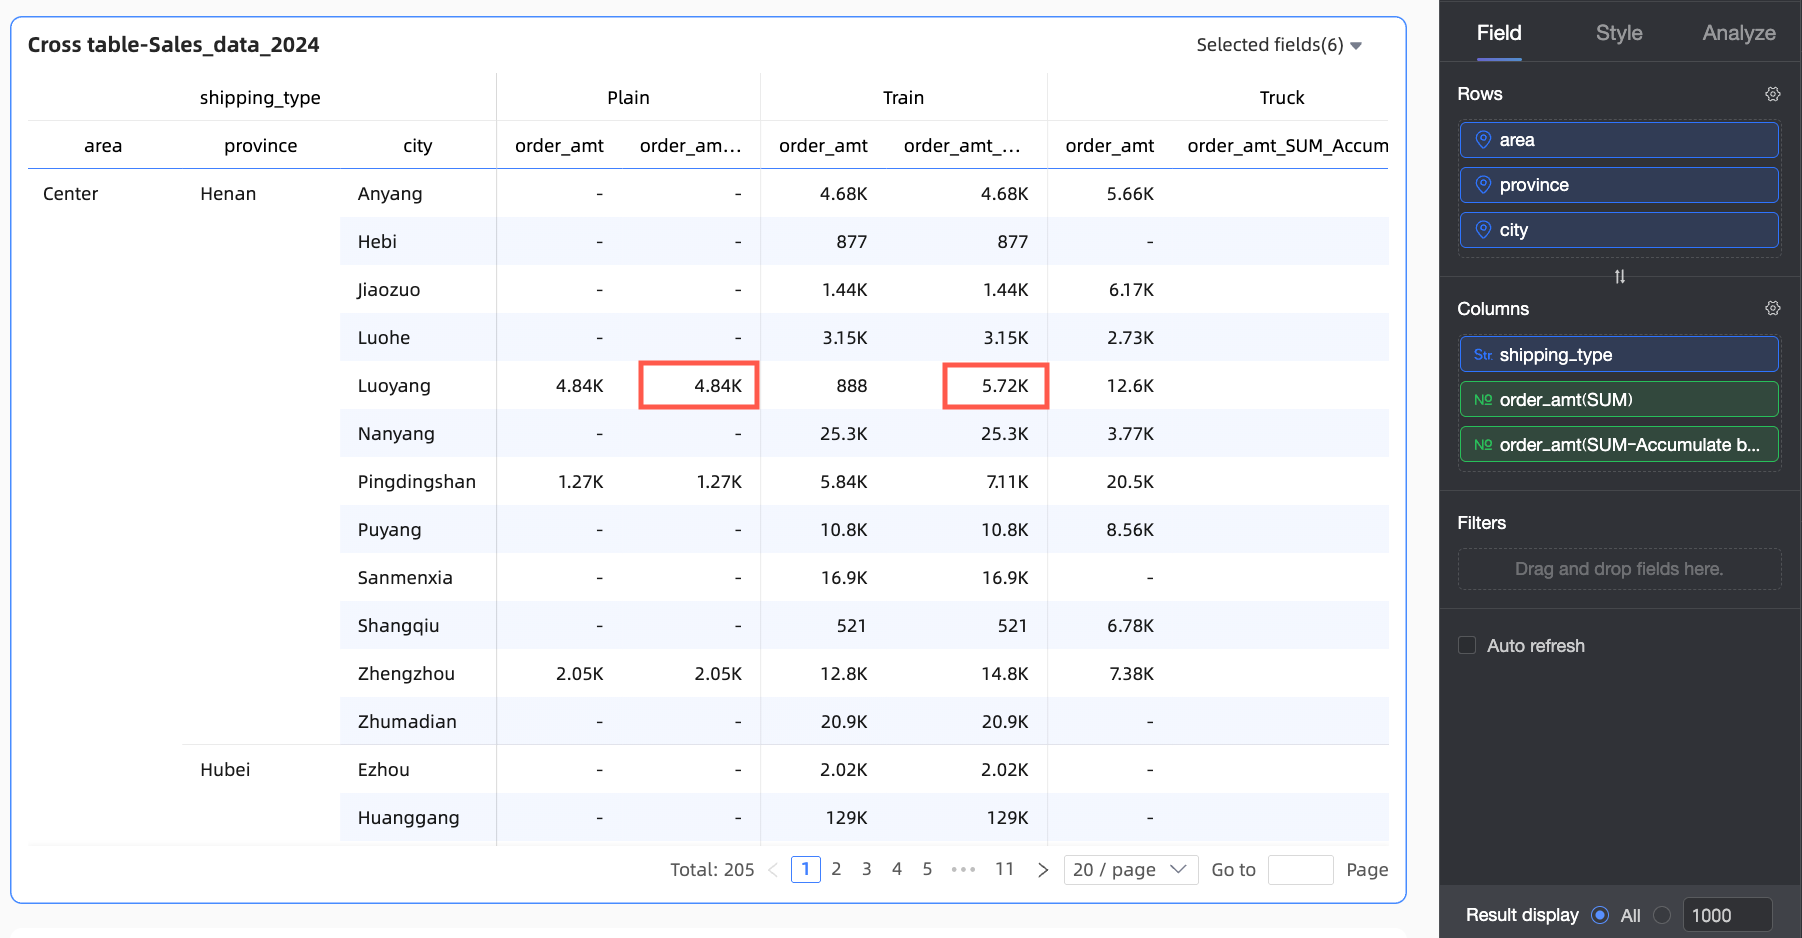
In-group cumulative by row | The columns area contains at least two dimension fields. | Groups data in a single row by a selected dimension and accumulates values sequentially from left to right within each group. A group is formed by all dimensions from the first dimension in the columns area to the selected grouping dimension. For example, in the following figure, data is grouped by the Shipping Method and Product Type fields.
| ||
Other charts | Overall cumulative | N/A | Accumulates values sequentially from top to bottom across the entire dataset. | |
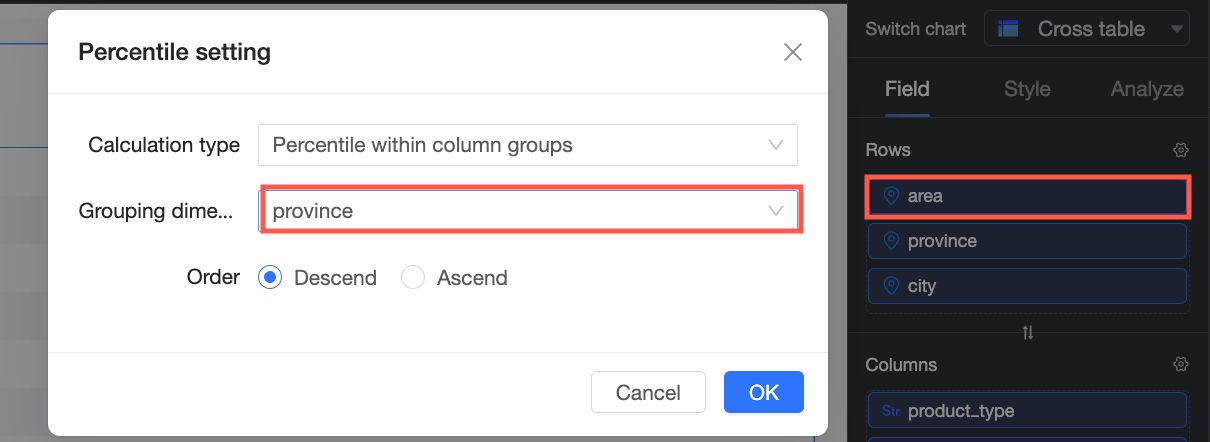
In-group cumulative | The color legend or split area contains a dimension field. For Bubble Charts and Scatter Plots, the X-axis cannot be a measure. | Groups data by dimension fields and accumulates values sequentially within each group. The grouping logic is as follows:
| ||

Examples
On the dashboard edit page, you can configure cumulative calculations for chart measures as needed. The following sections provide examples.
Overall cumulative
This example shows how to configure an overall cumulative calculation for a detail table.
On the Fields tab of the chart designer, configure the data for the detail table.
Select the required dimension and measure fields, and then double-click or drag them to the target areas.
From the dimension list, find Region, Province, and City, and then double-click or drag them to the rows area.
From the measure list, find Order Amount, and then double-click or drag it to the columns area twice.
NoteOne Order Amount field displays the original data, and the other will be used for the cumulative calculation.
Ignore this message and update the chart after completing the configuration.
Click the
 icon next to the second Order Amount field and select Advanced calculation > Cumulative calculation > Overall cumulative.
Click Update.
The system calculates a running total for the Order Amount field, accumulating values sequentially from top to bottom.
 icon next to the second Order Amount field and select Advanced calculation > Cumulative calculation > Overall cumulative.

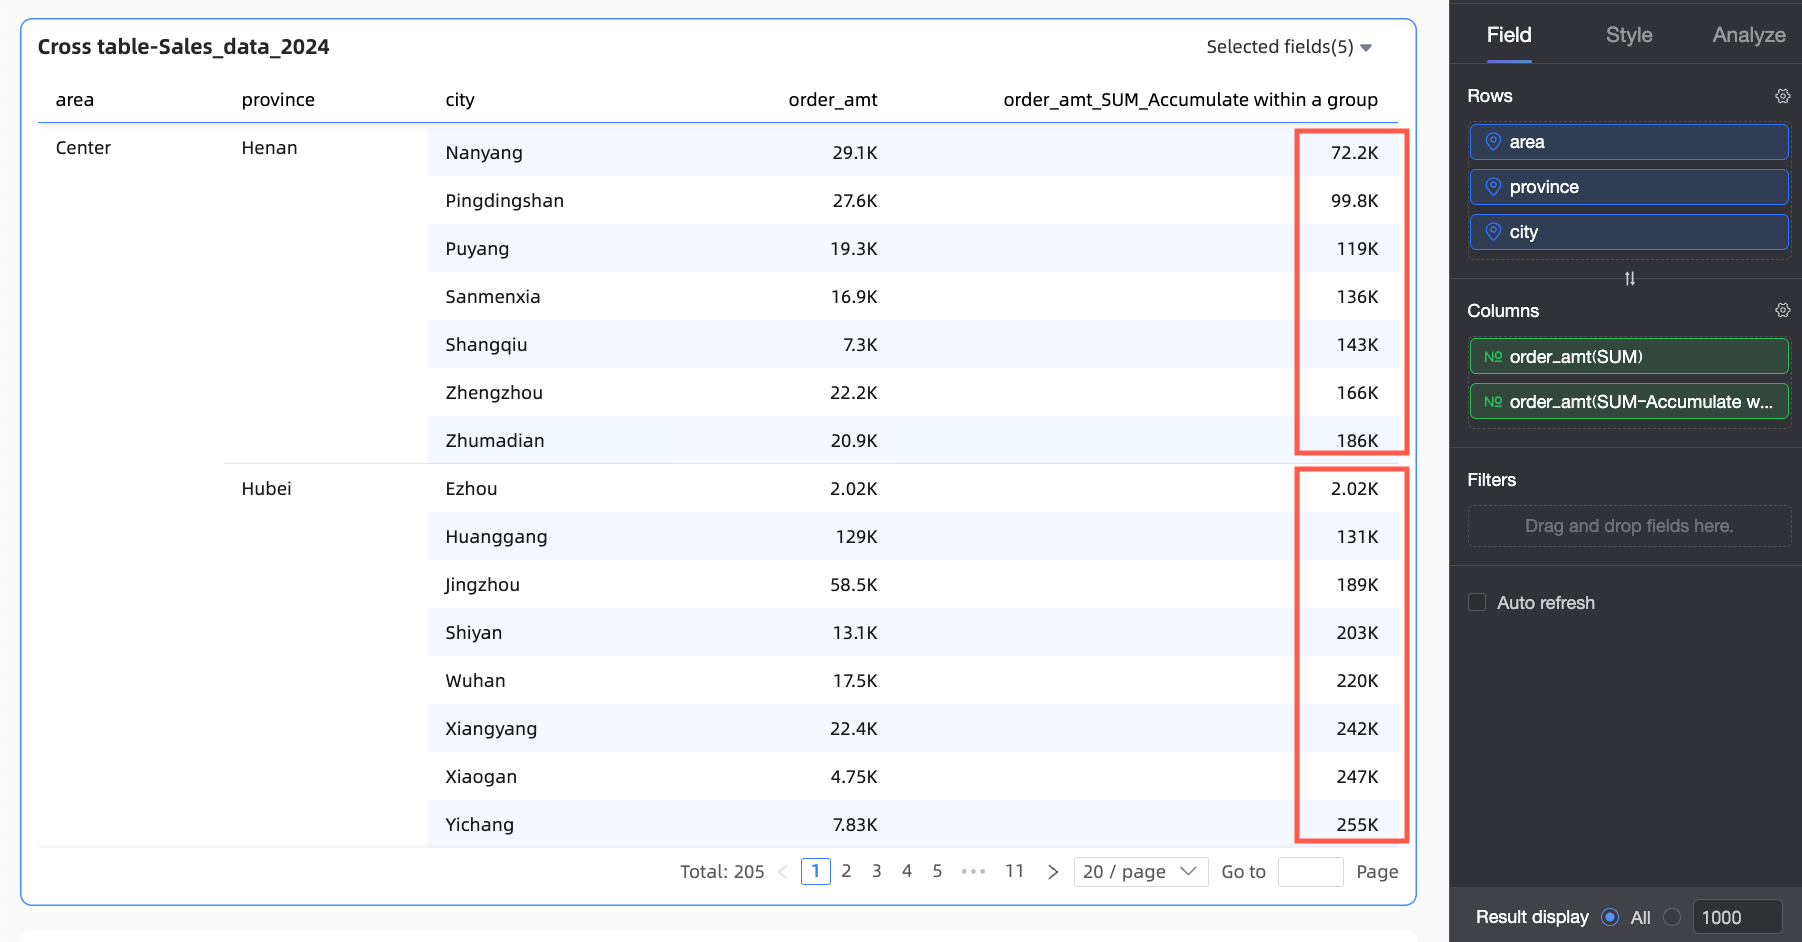
In-group cumulative
This example shows how to configure an in-group cumulative calculation for a crosstab.
On the Fields tab of the chart designer, configure the data for the crosstab.
Select the required dimension and measure fields, and then double-click or drag them to the target areas.
From the dimension list, find Region, Province, and City, and then double-click or drag them to the rows area.
From the measure list, find Order Amount, and then double-click or drag it to the columns area twice.
NoteOne Order Amount field displays the original data, and the other will be used for the cumulative calculation.
Ignore this message and update the chart after completing the configuration.
Click the
icon next to the second Order Amount field and select Advanced calculation > Cumulative calculation > In-group cumulative.Click Update.
The system groups data by the Province dimension and calculates a running total for Order Amount within each group.

Custom
Currently, only crosstabs support the custom cumulative calculation method. Four types are available: Cumulative by column, In-group cumulative by column, Cumulative by row, and In-group cumulative by row. The following table shows examples.
Cumulative type | Description | Example |
Cumulative by column | In this example, values are accumulated sequentially from top to bottom within a single column. |
|
In-group cumulative by column | In this example, the first dimension in the rows area is Region, and the grouping dimension is Province. Data is grouped by both the Region and Province fields, and the cumulative calculation is performed for each group. |
|
Cumulative by row | In this example, values are accumulated sequentially from left to right within a single row. |
|
In-group cumulative by row | In this example, the first dimension in the columns area and the grouping dimension are both Product Type. Data is grouped and accumulated based on the Product Type dimension. |
|