Quick BI supports adding interpretation results from Intelligent Q to a dashboard component. This lets you present dynamically updated data interpretations to business users or executives on a fixed schedule. This topic describes how to add and configure an interpretation component on a dashboard.
Prerequisites
You have enabled Intelligent Q interpretation.
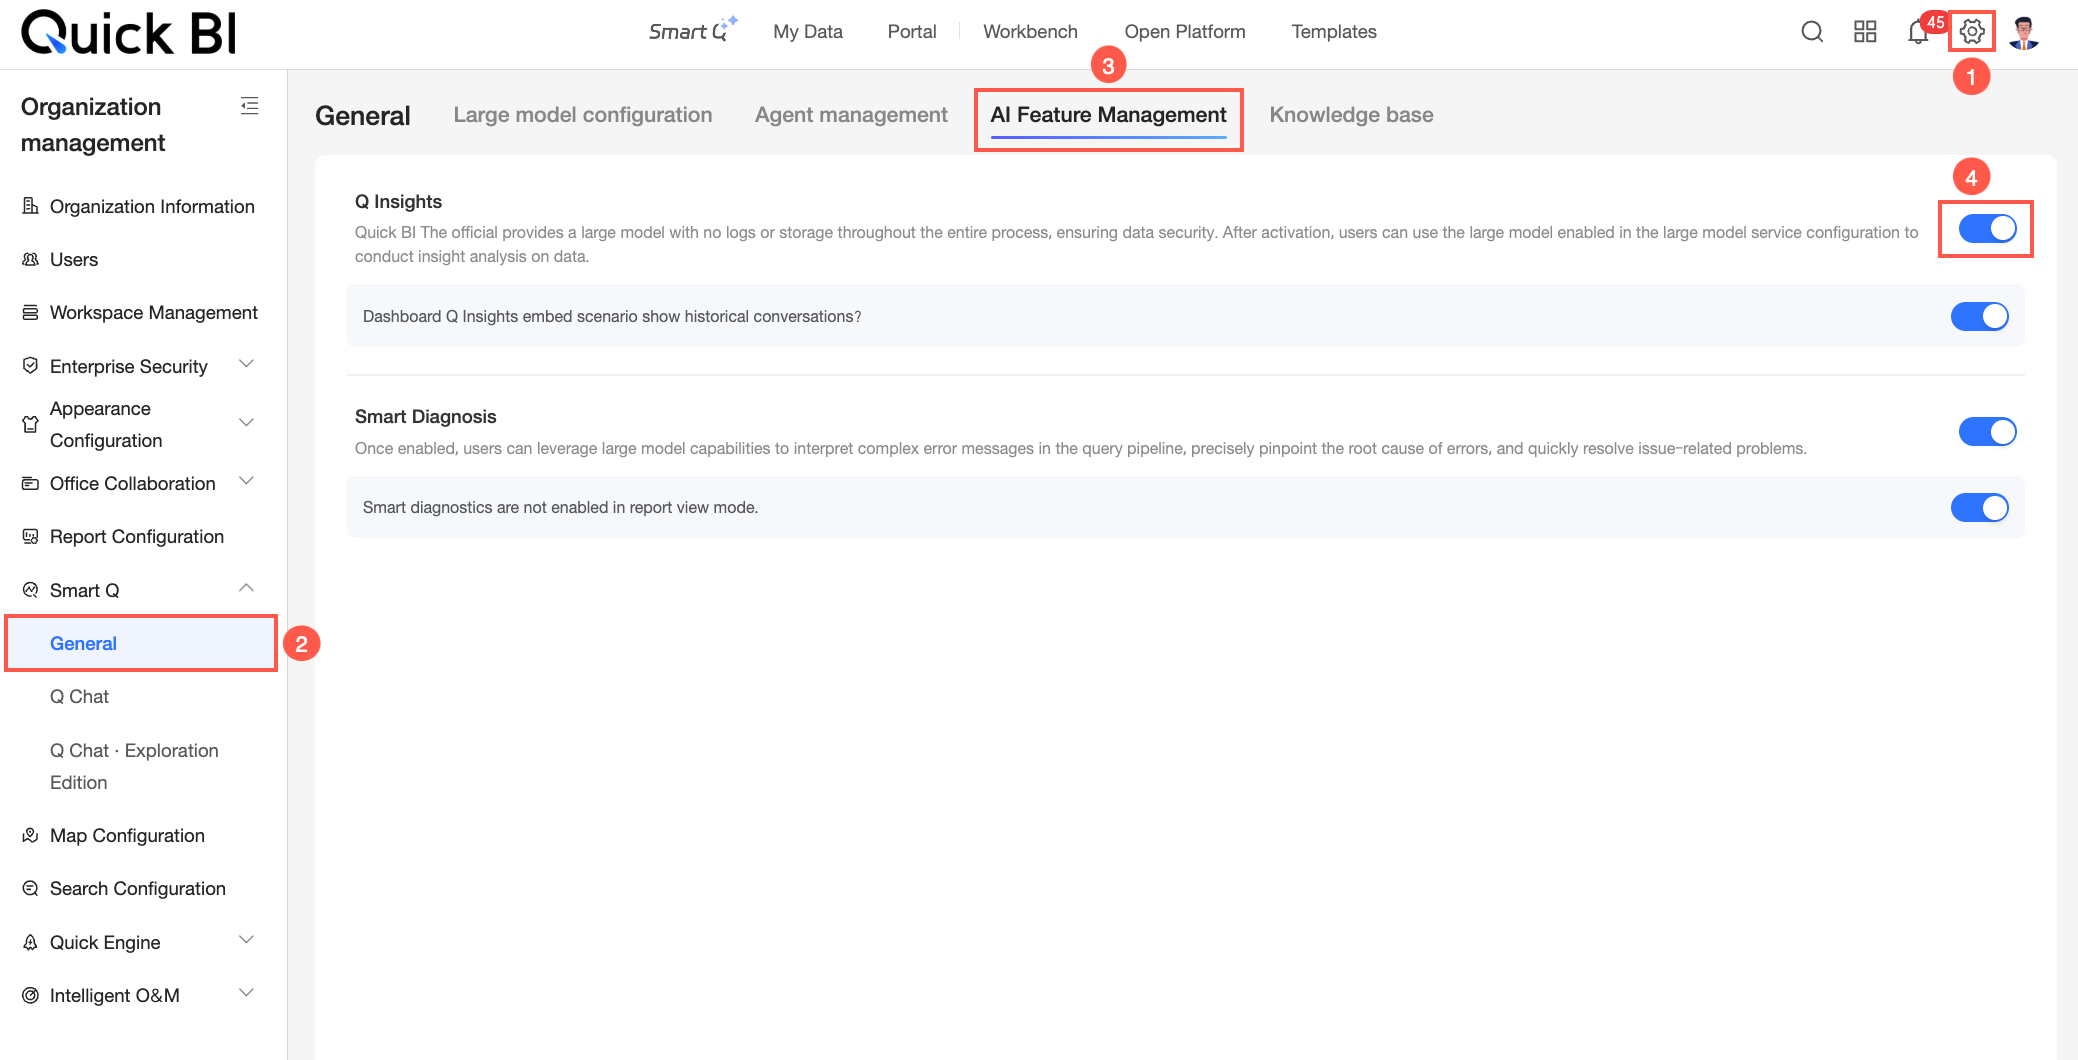
You have configured Intelligent Q interpretation.
You have created a dashboard and have editing permissions for it.
Limitations
A dashboard supports a maximum of three Intelligent Q interpretation components.
Add interpretation component
Entry points
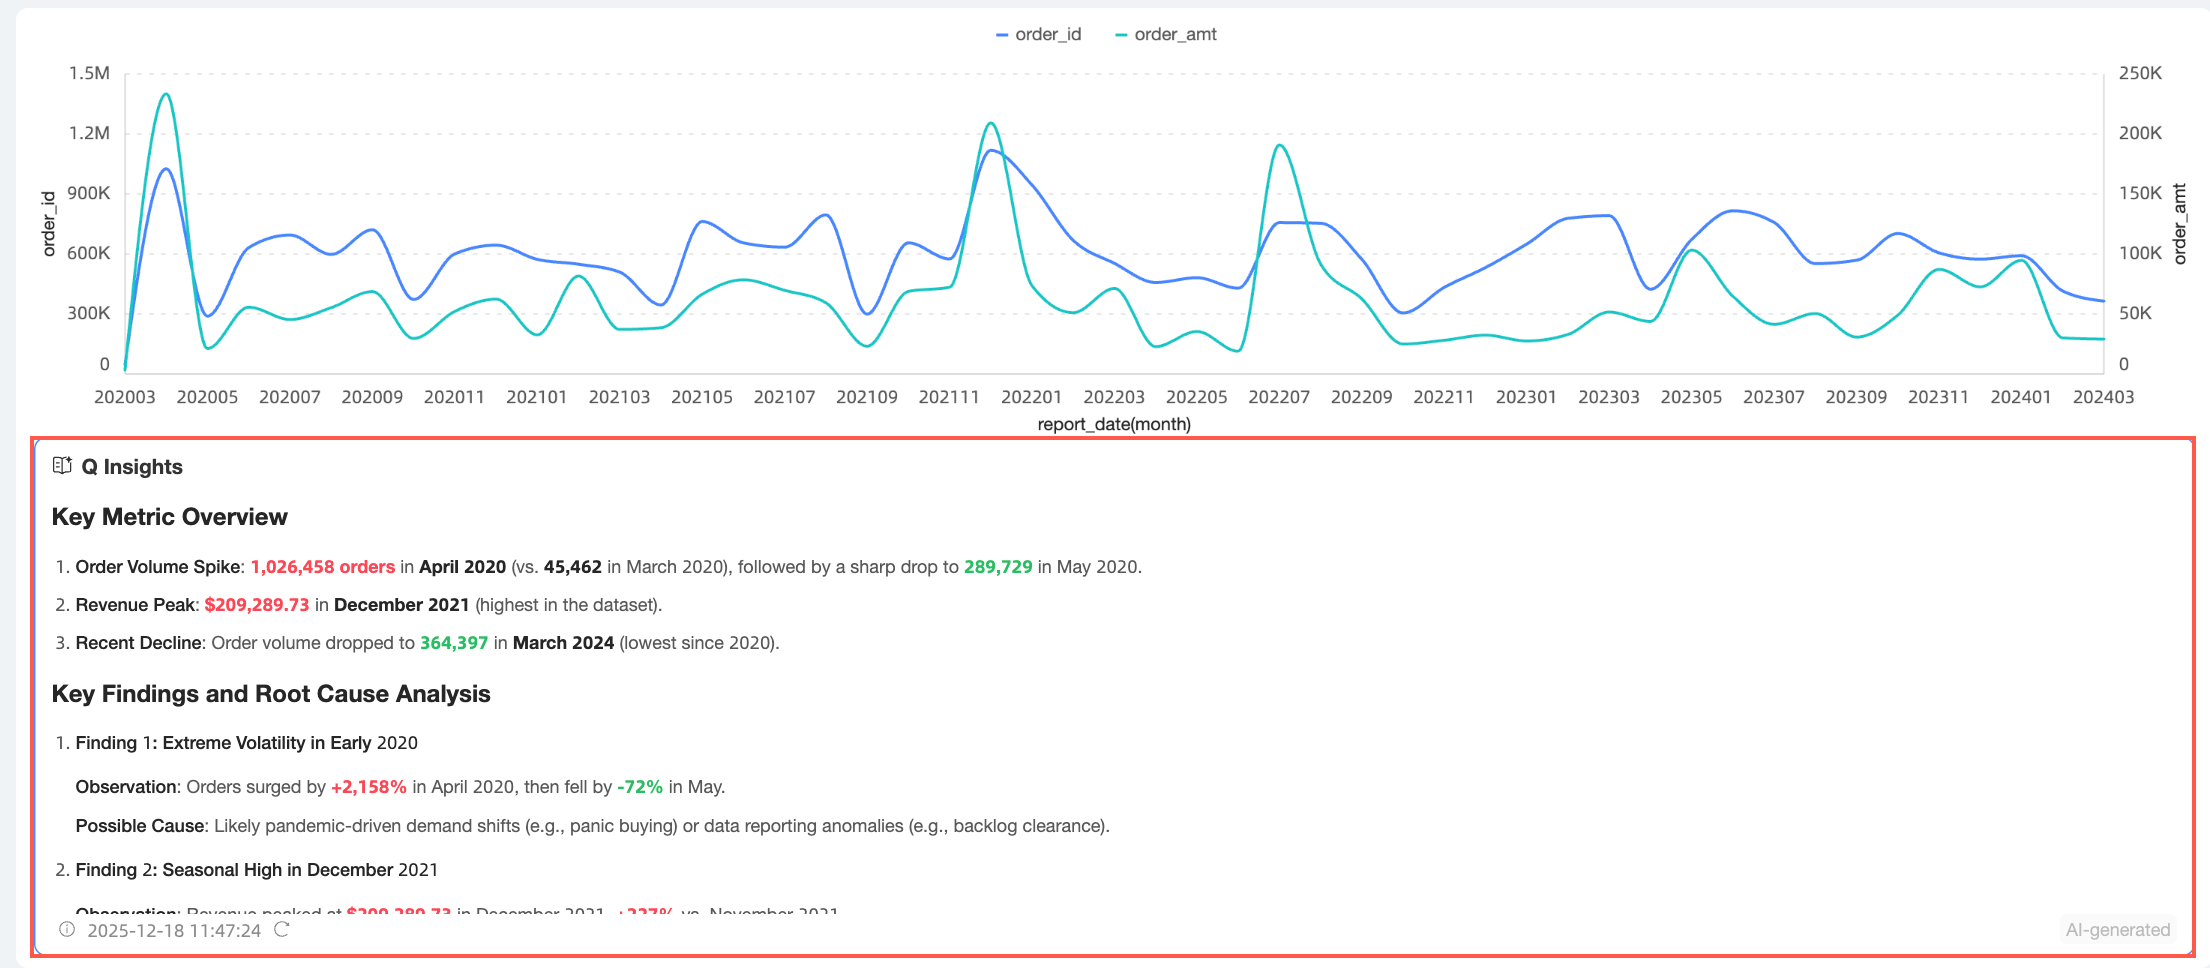
You can generate a global dashboard interpretation or an interpretation for a single chart component.
Global dashboard interpretation
On the dashboard editing page, click the
 icon at the top to start a global dashboard interpretation.
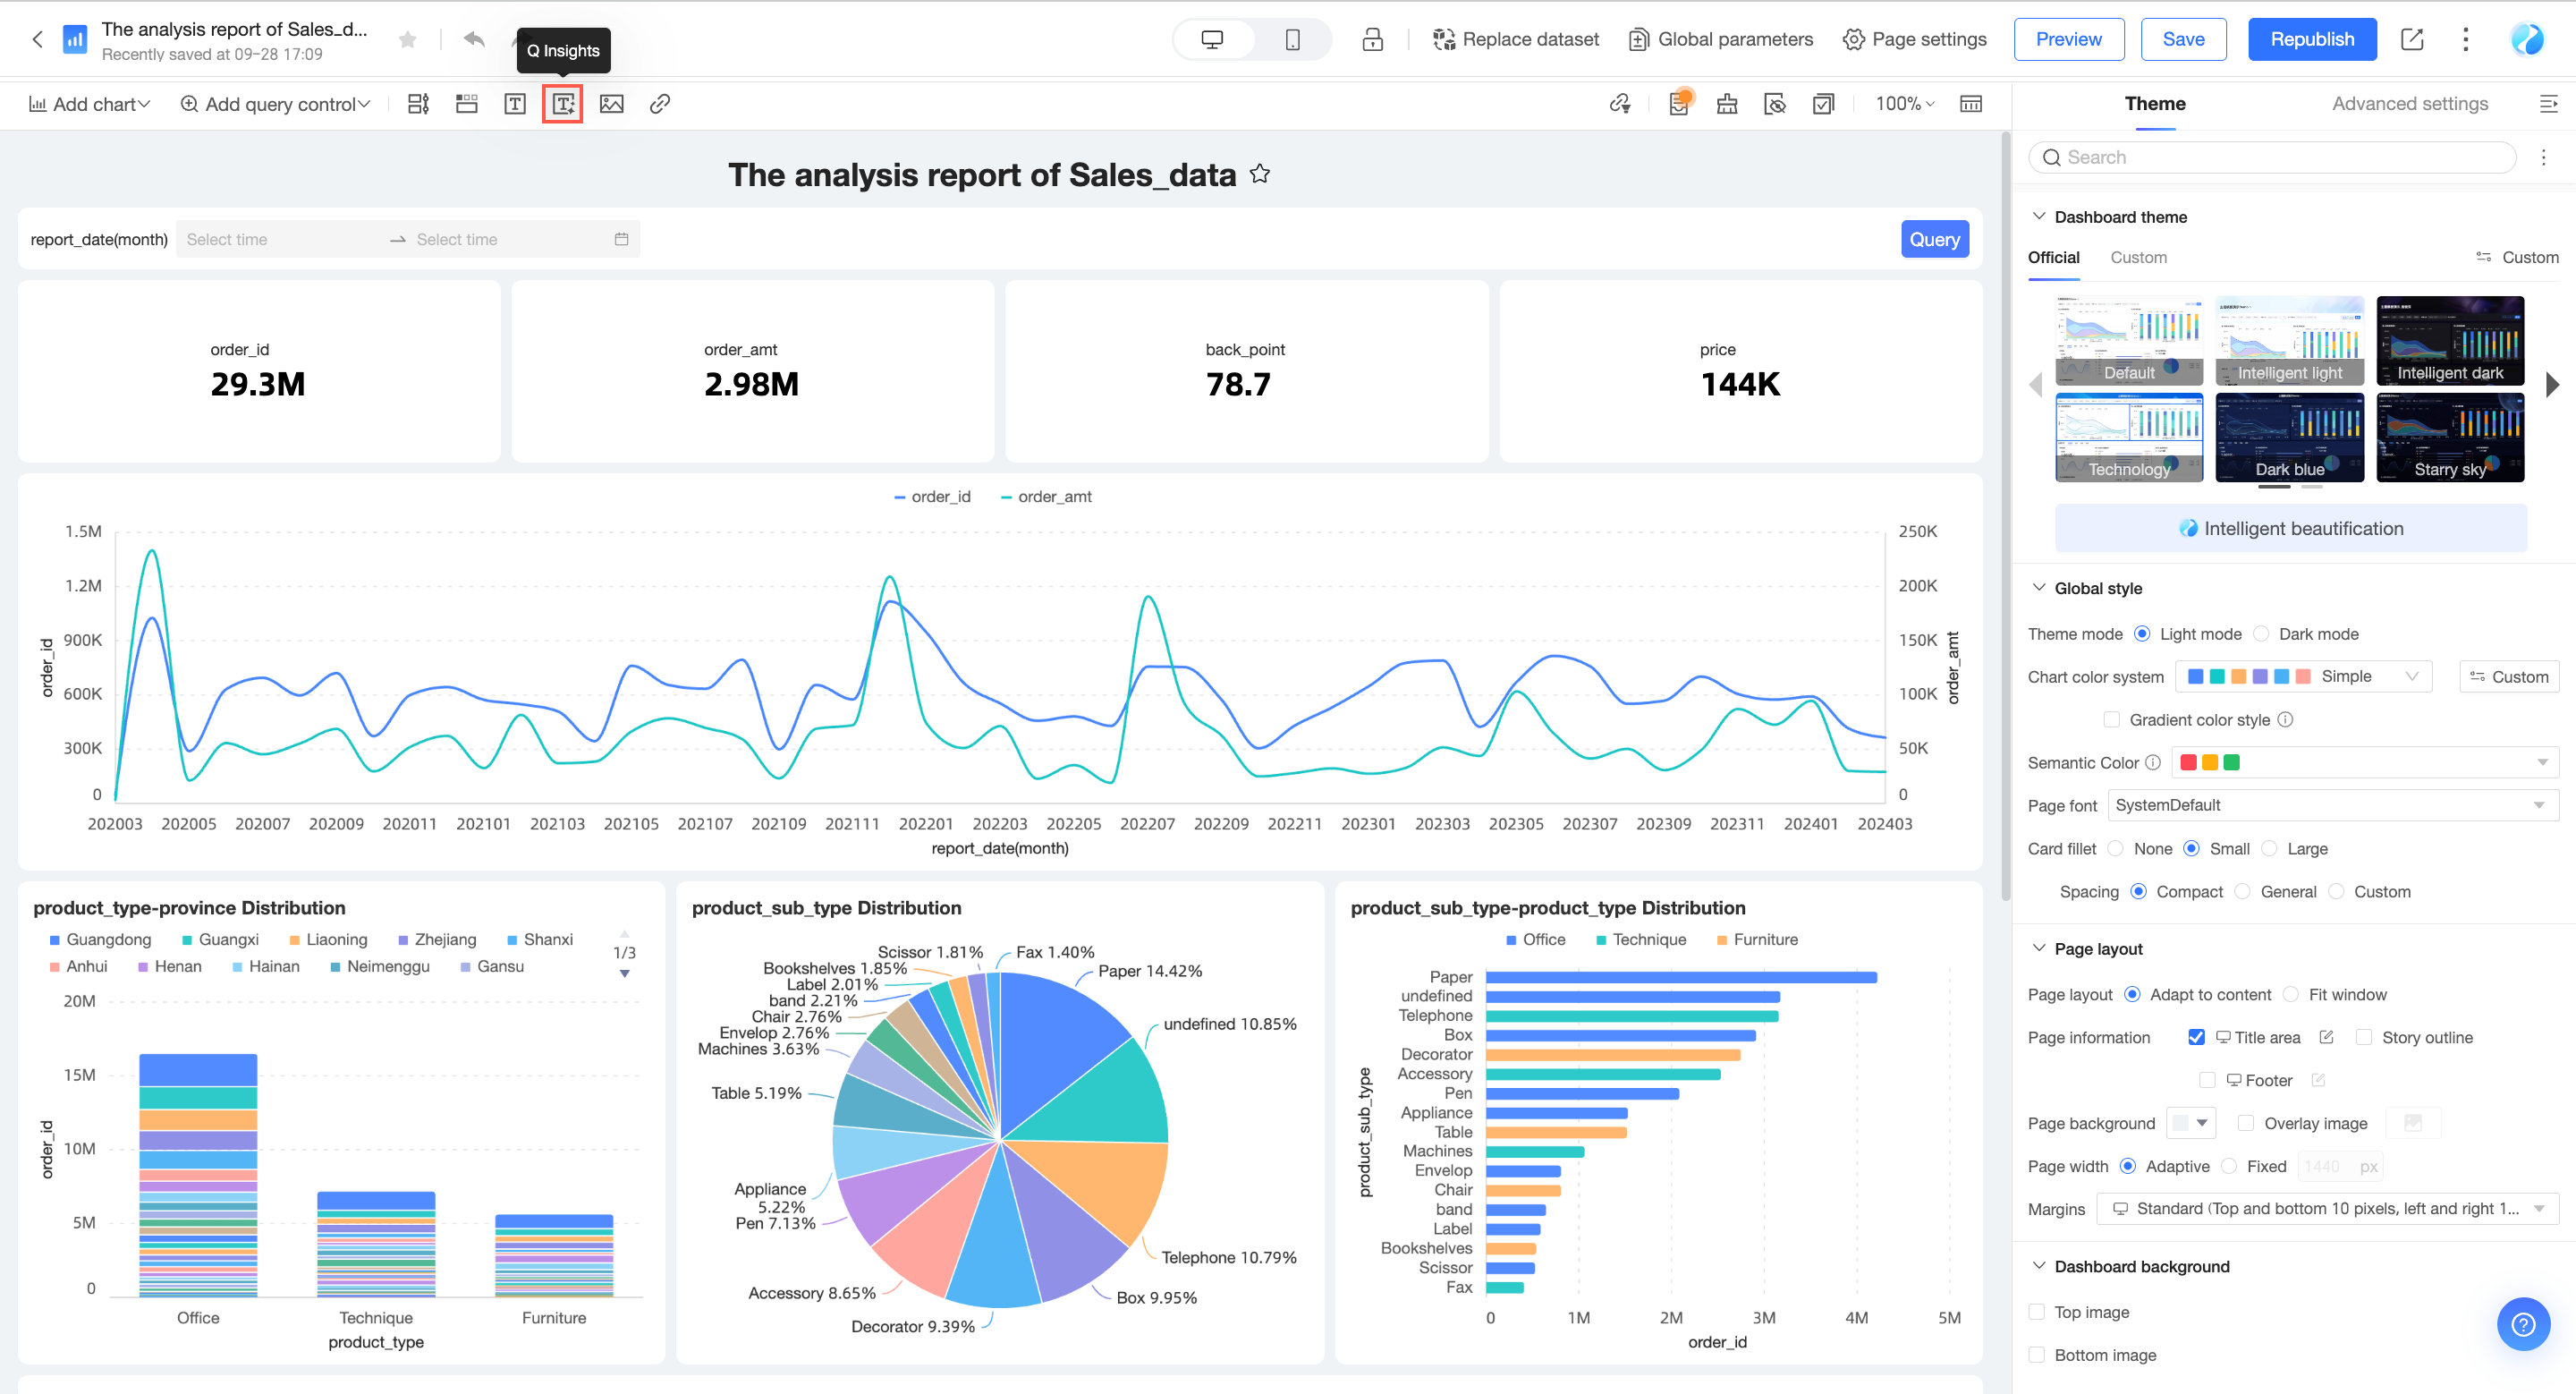
Single chart component interpretation
Click the
 icon on the right side of the target chart and select Insert Intelligent Q Interpretation to start a single chart component interpretation.
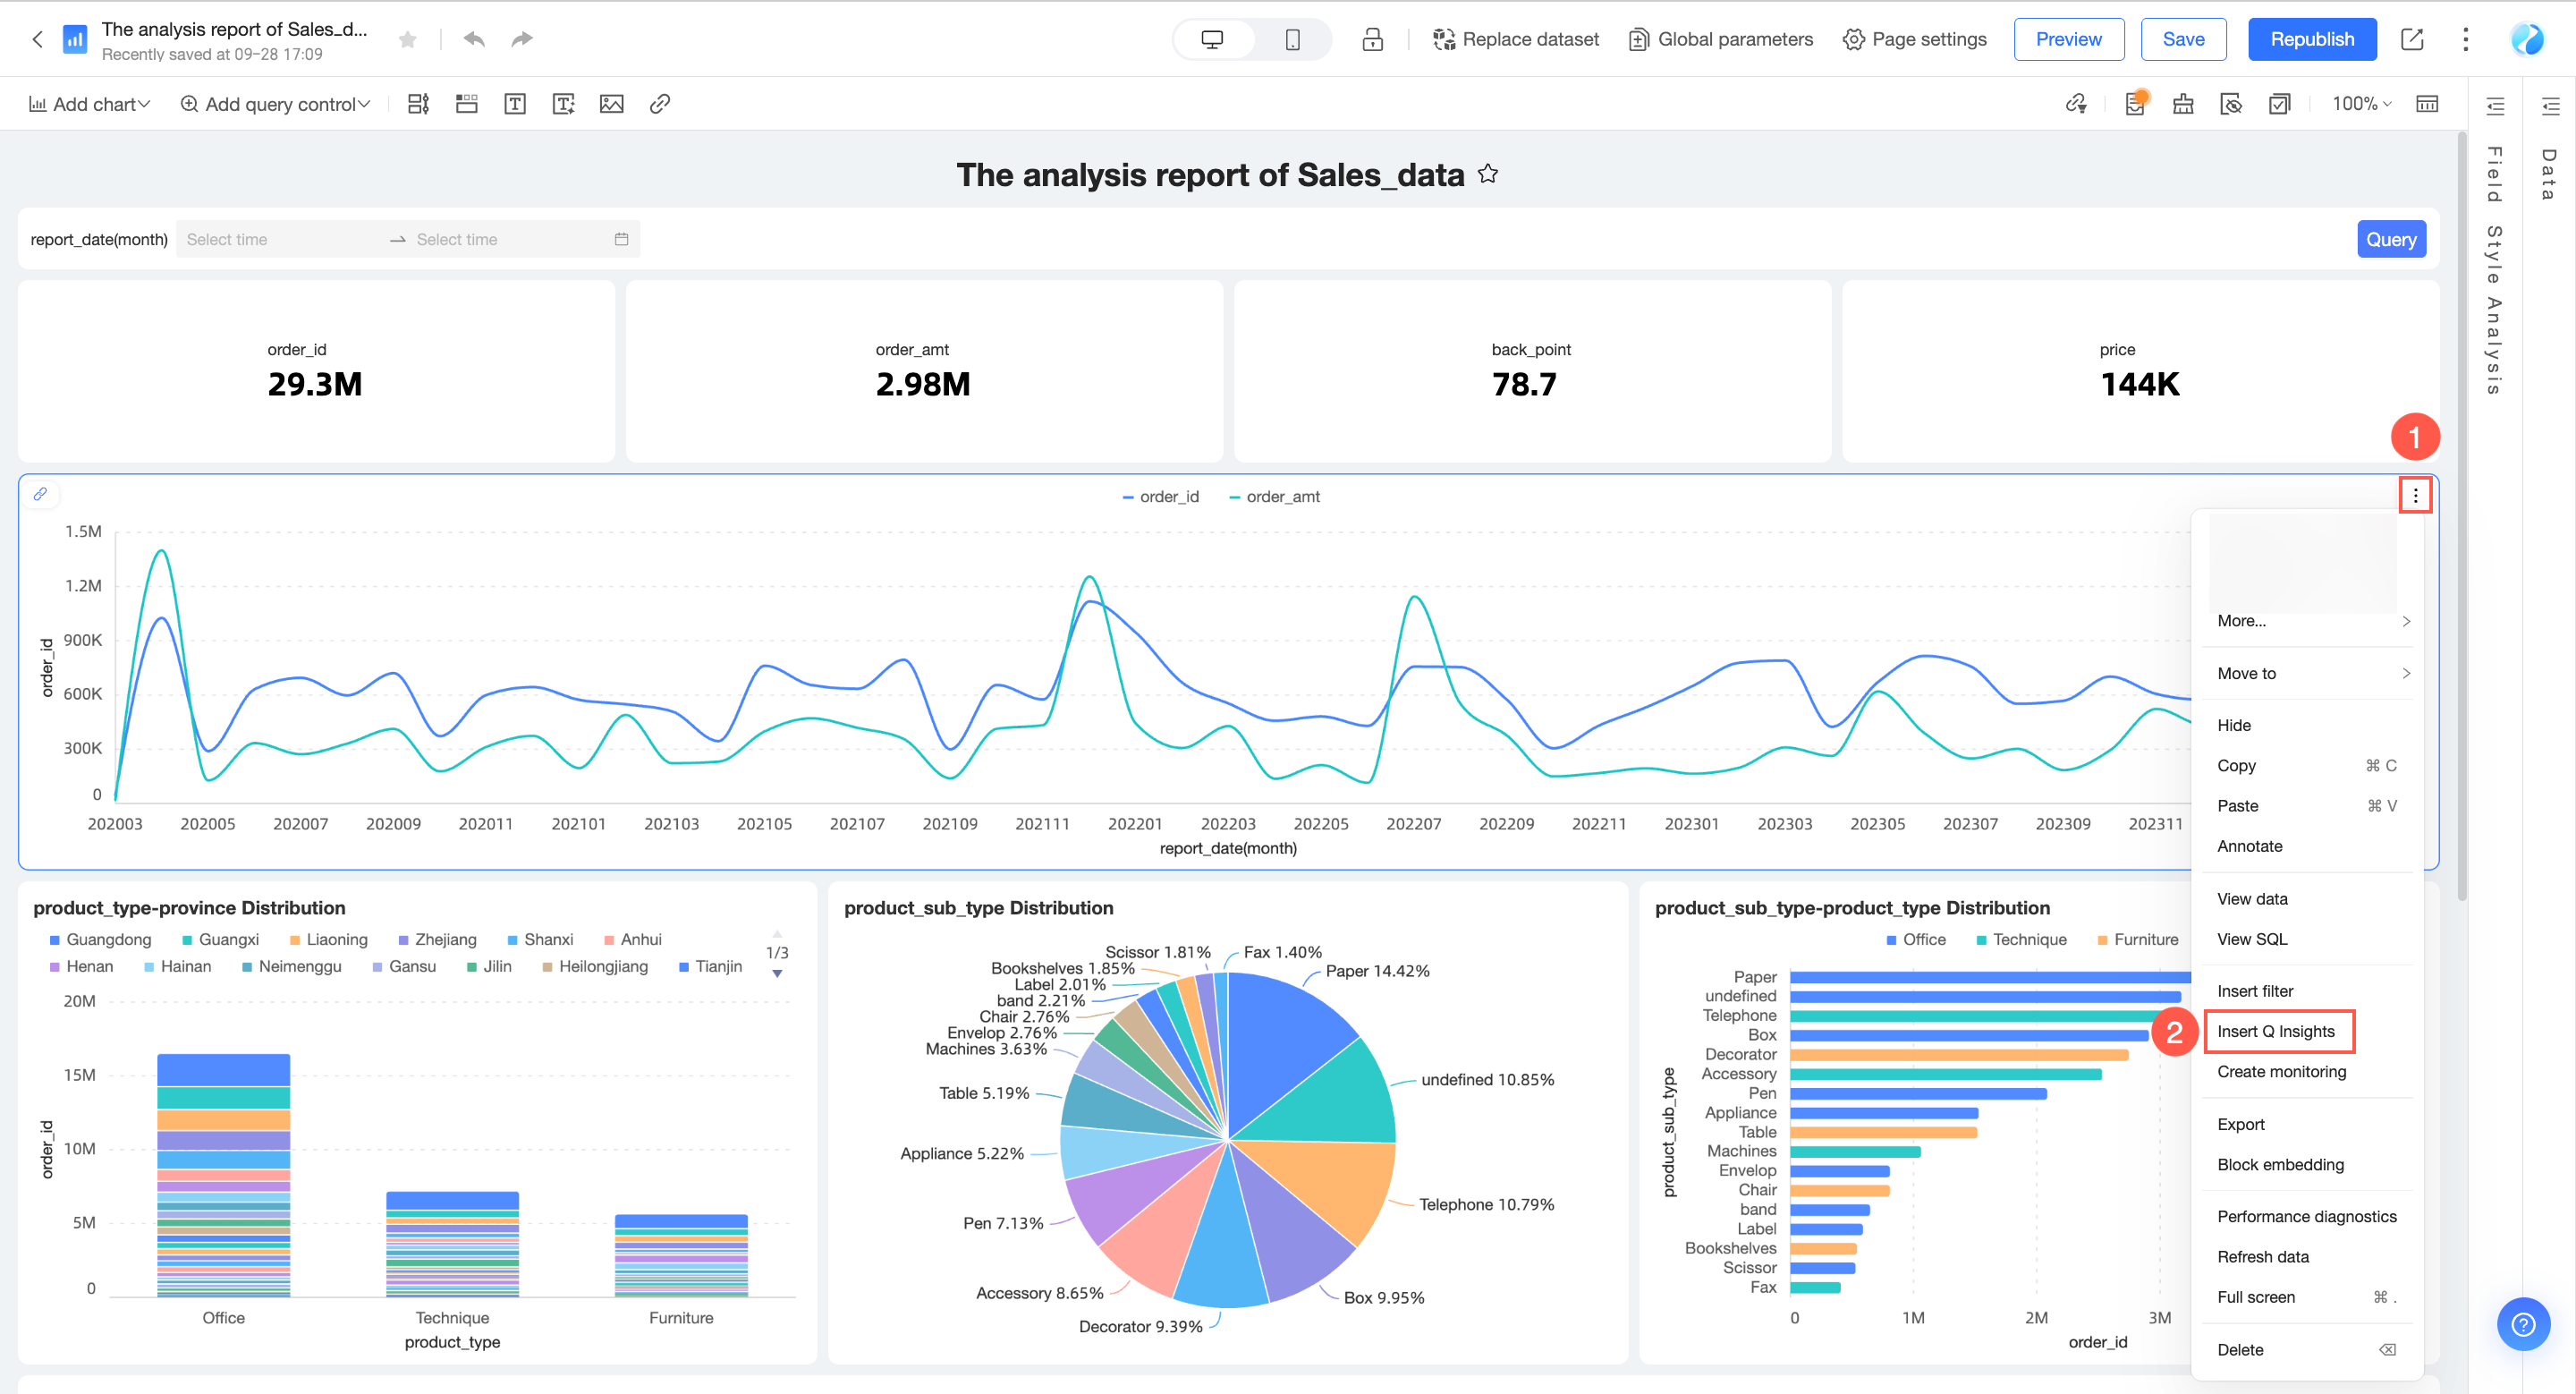
Interpretation scope
This step is not required for single chart component interpretations.
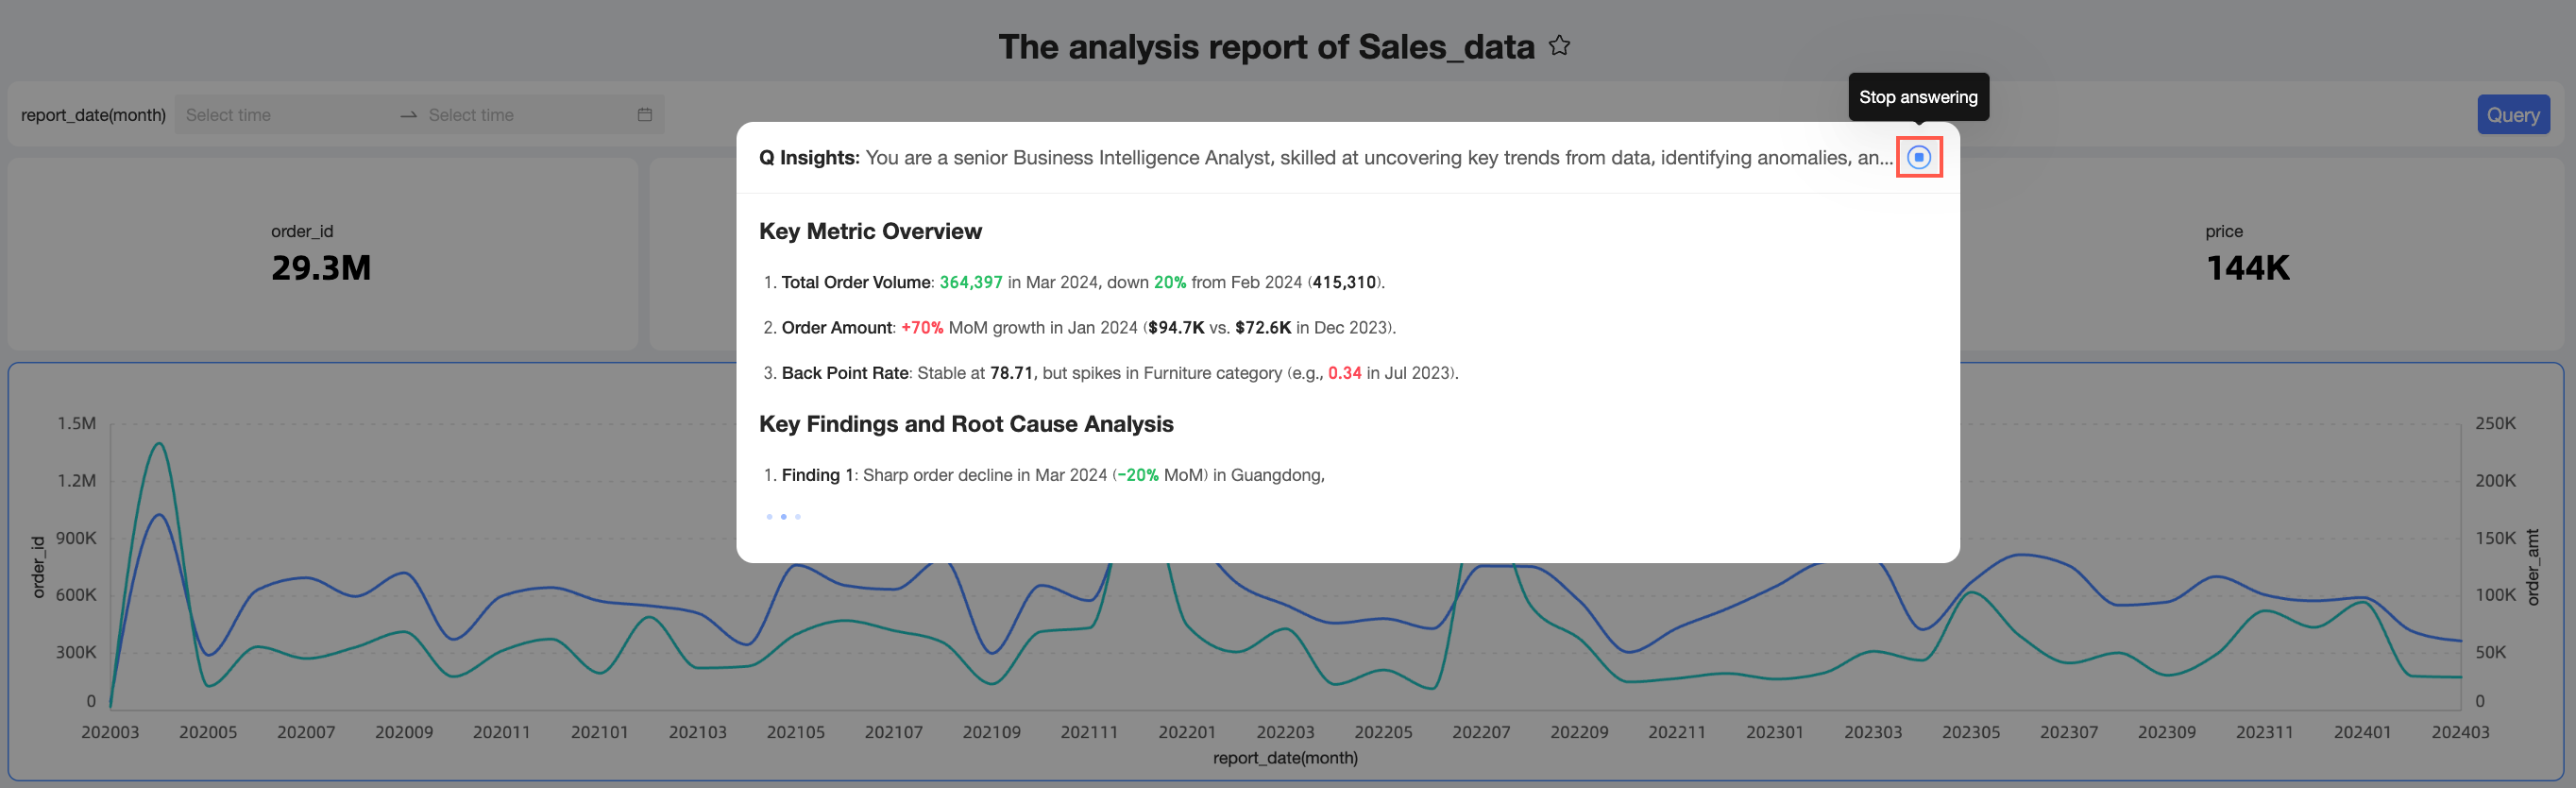
On the Intelligent Q interpretation page, the system selects All components on the dashboard for interpretation by default. Alternatively, you can select one or more specific charts for interpretation.
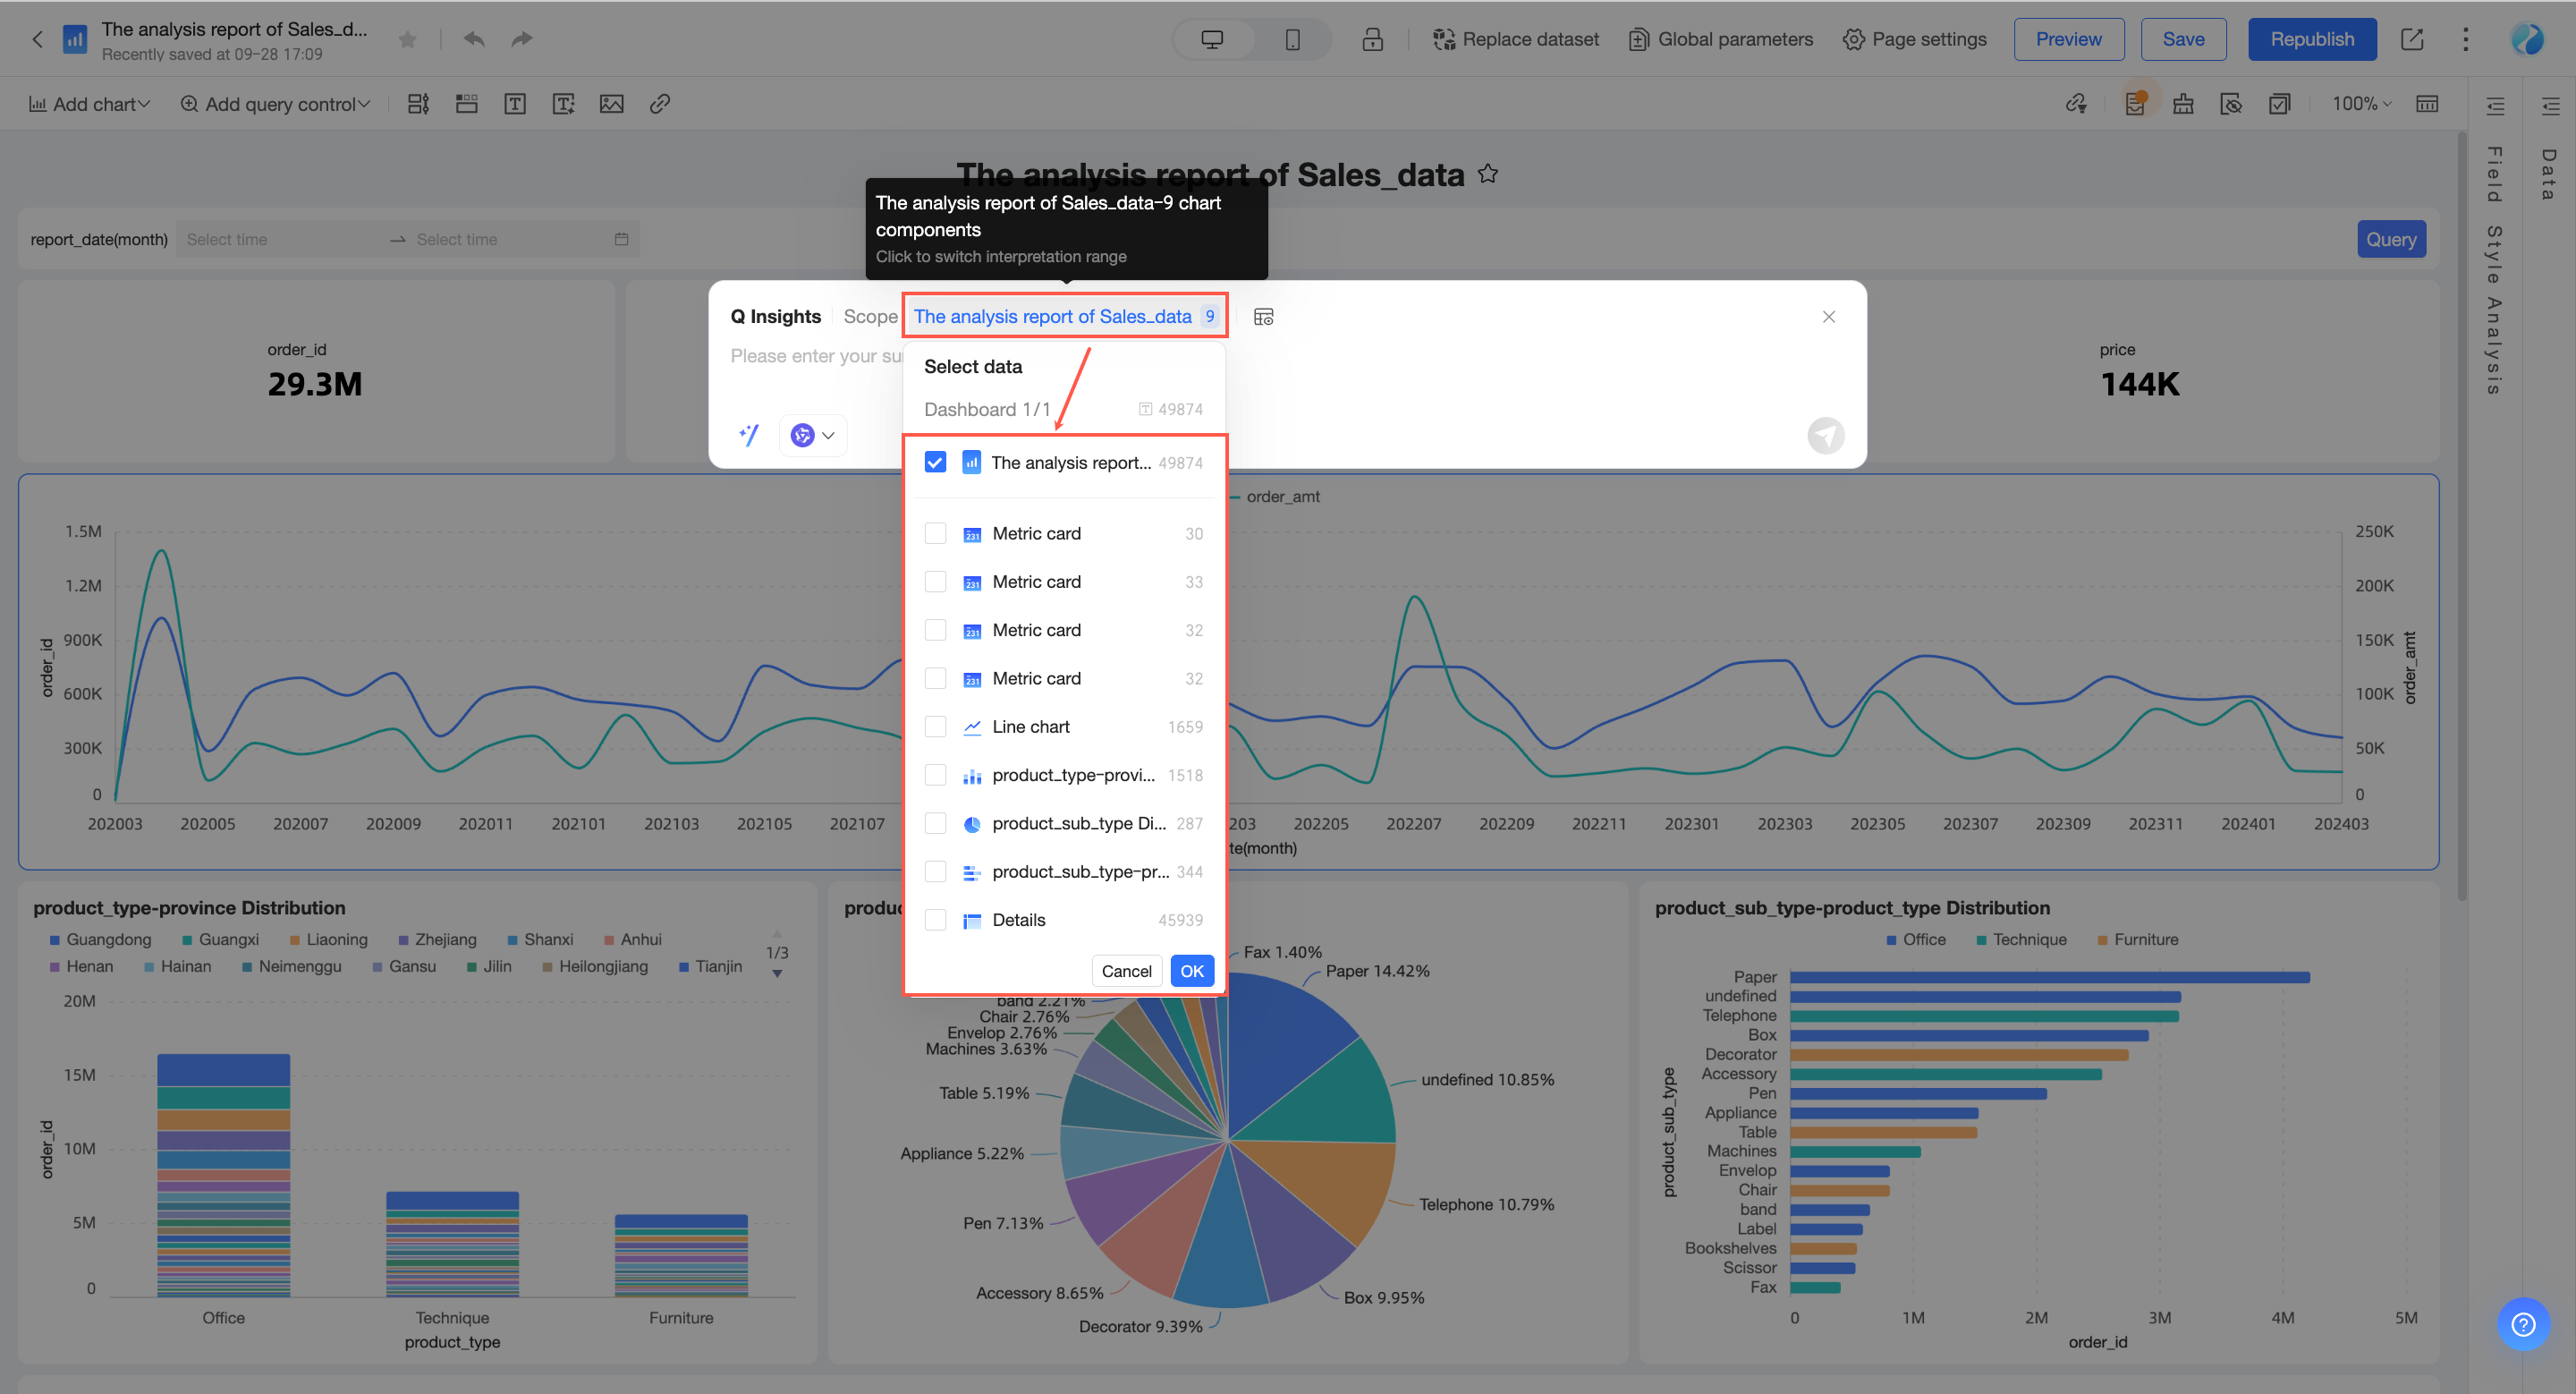
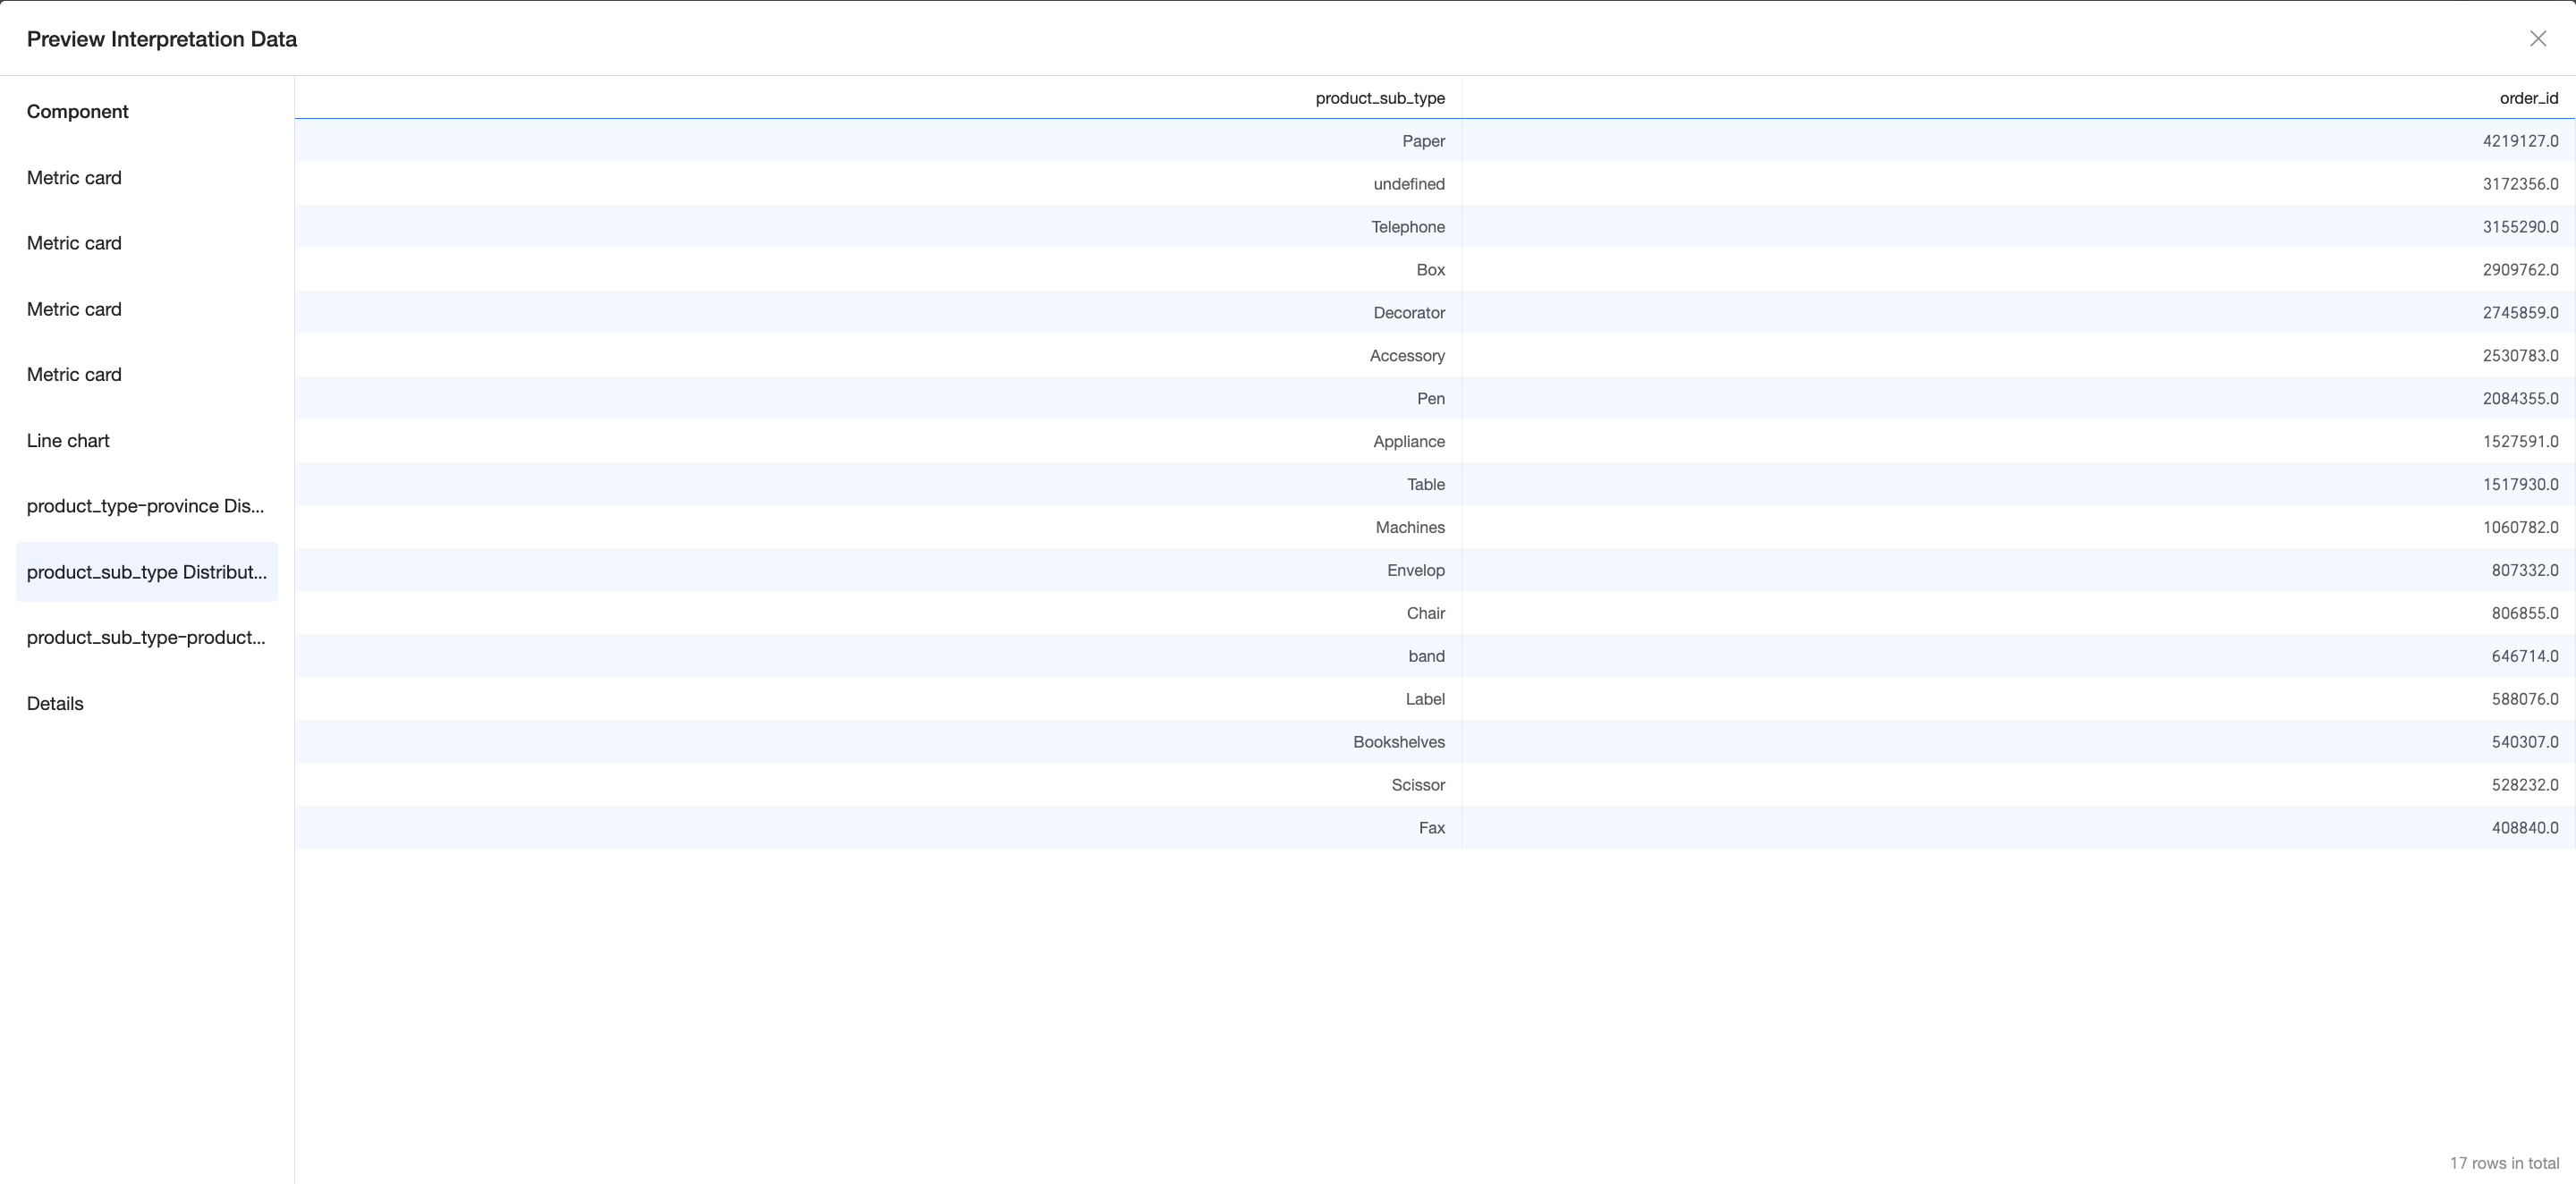
After you select the scope, click Preview interpretation data.
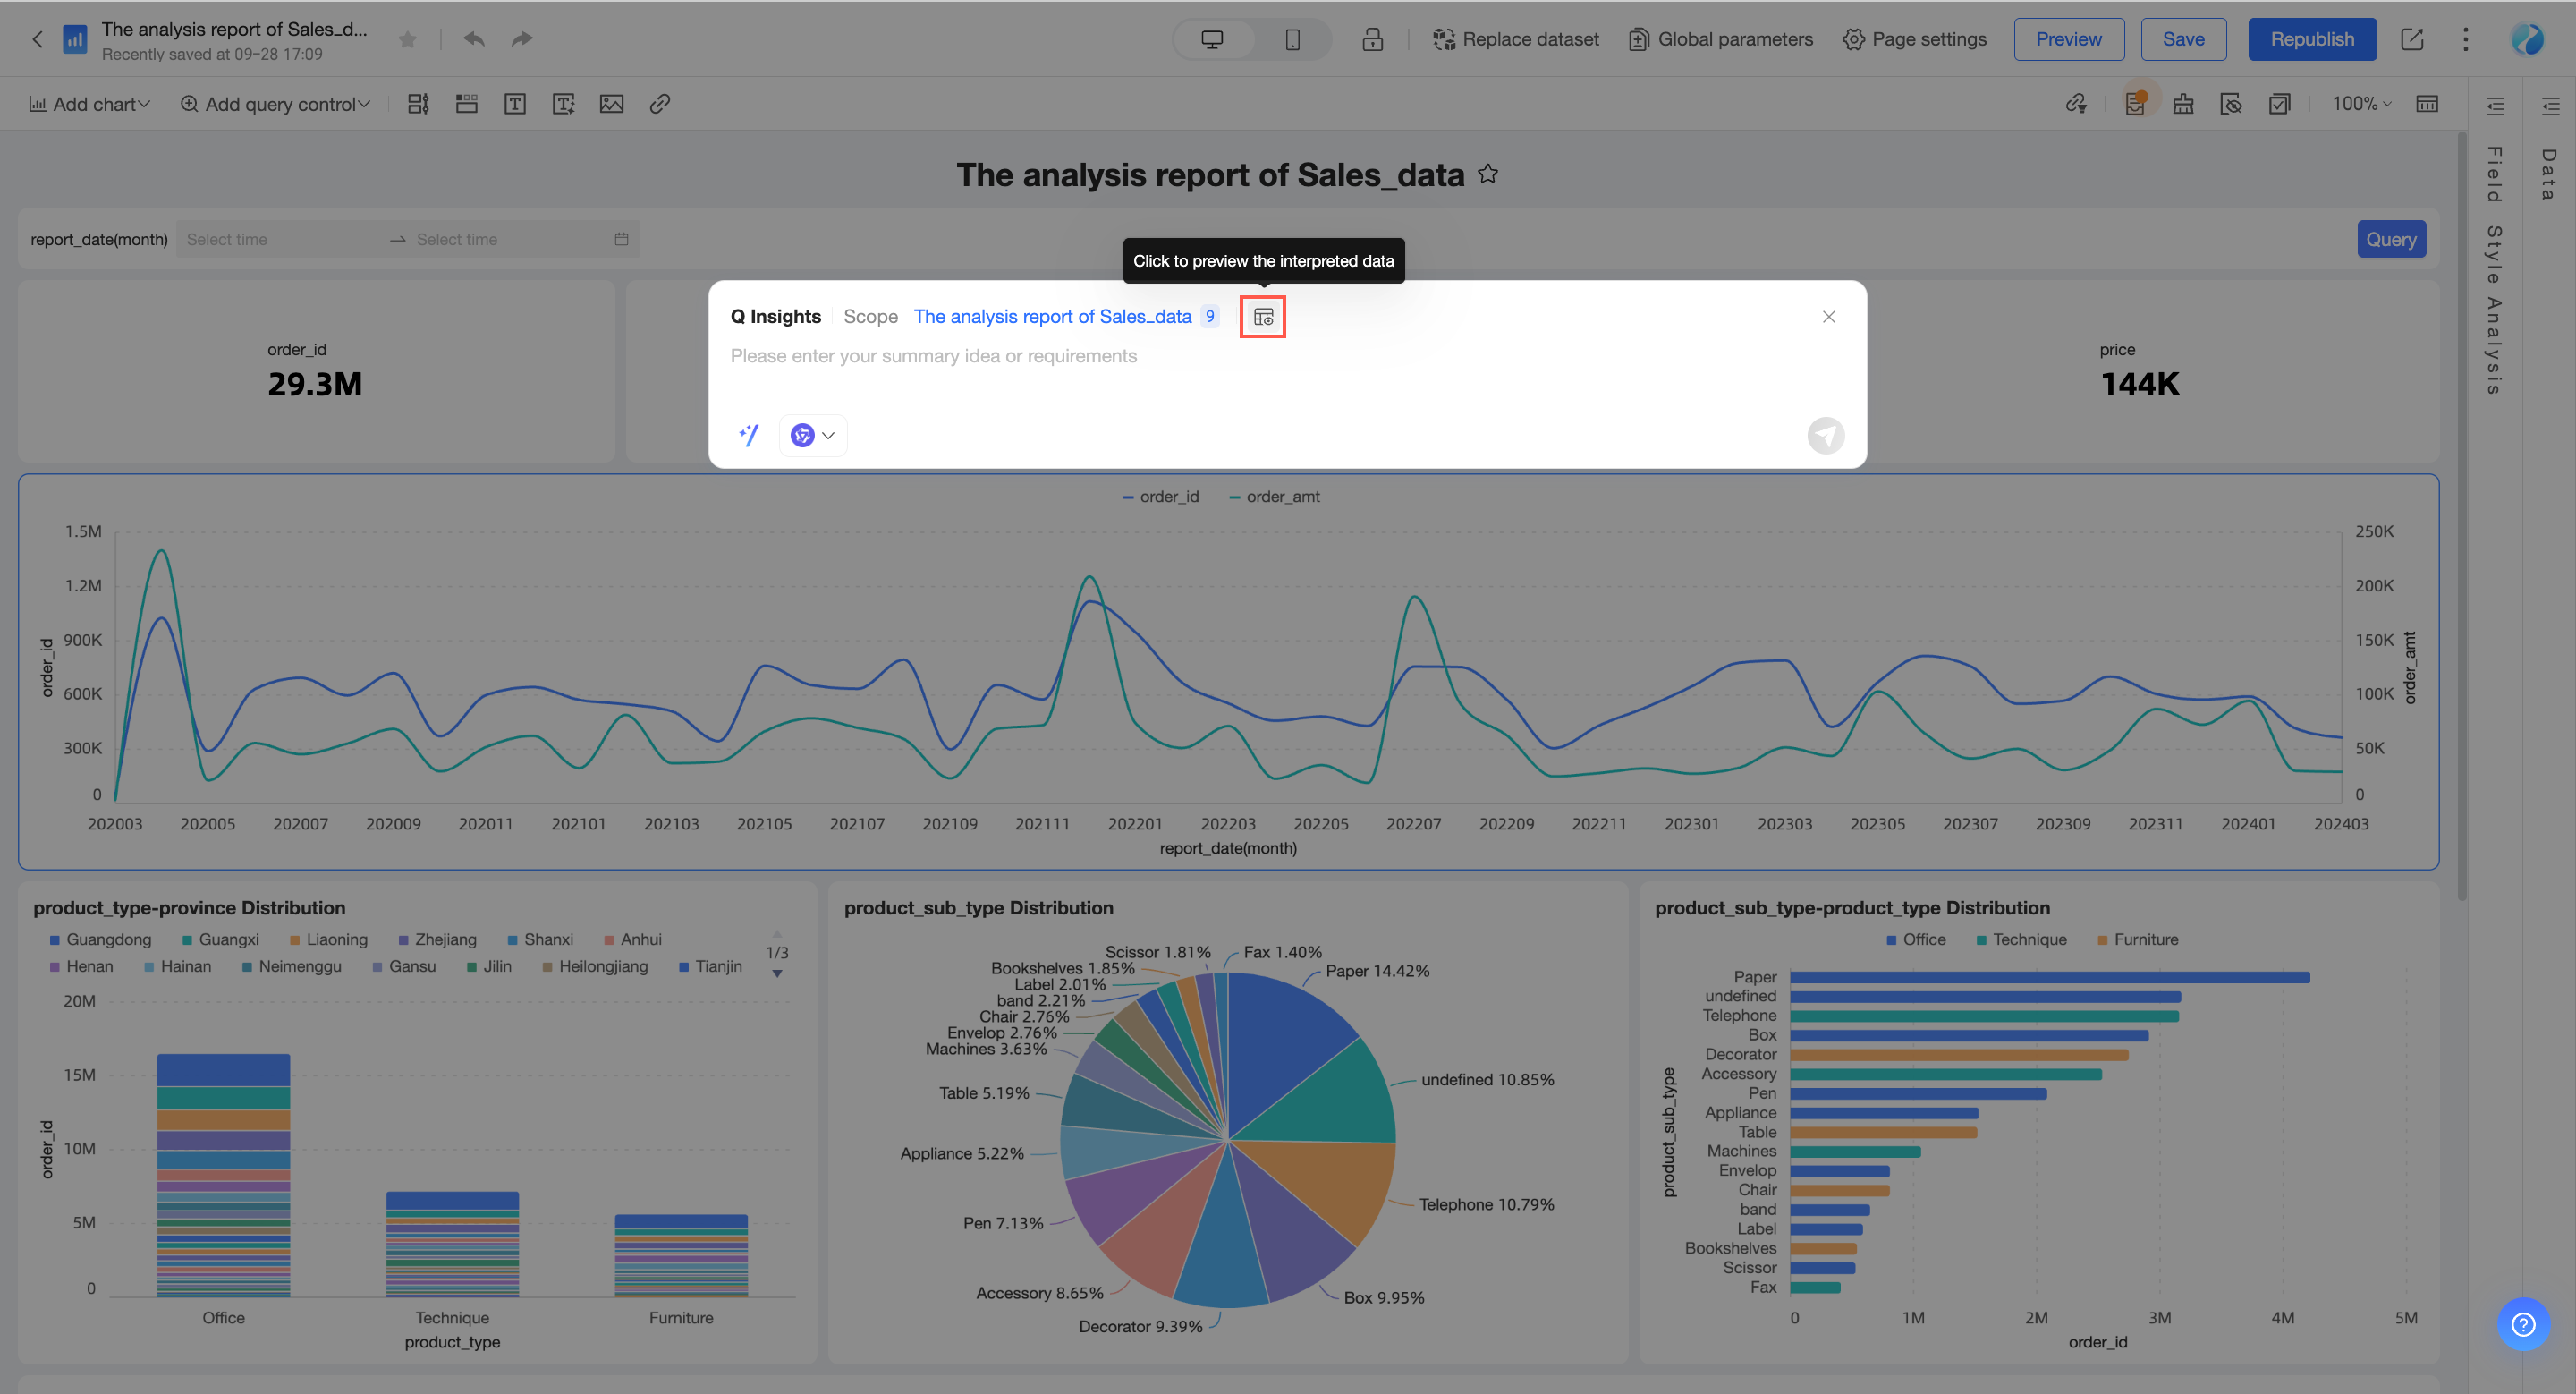
The following image shows a preview.
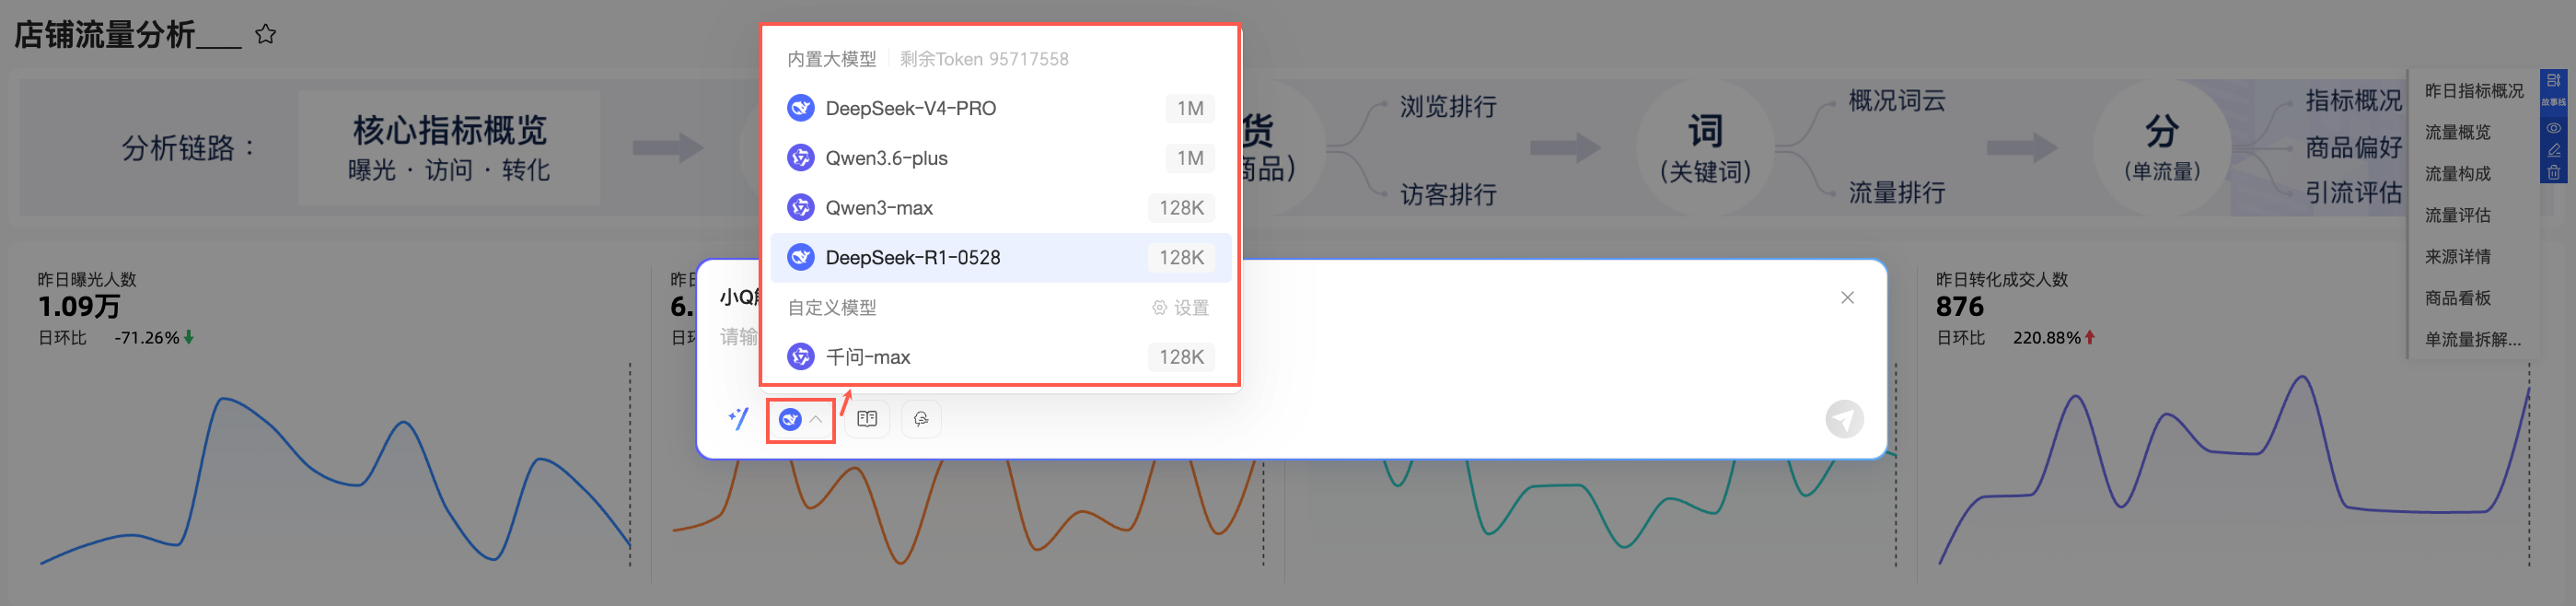
Model selection
You can select a built-in large model or a custom large model.
Knowledge base search
After you enable enterprise knowledge base search, you can select which knowledge bases to associate.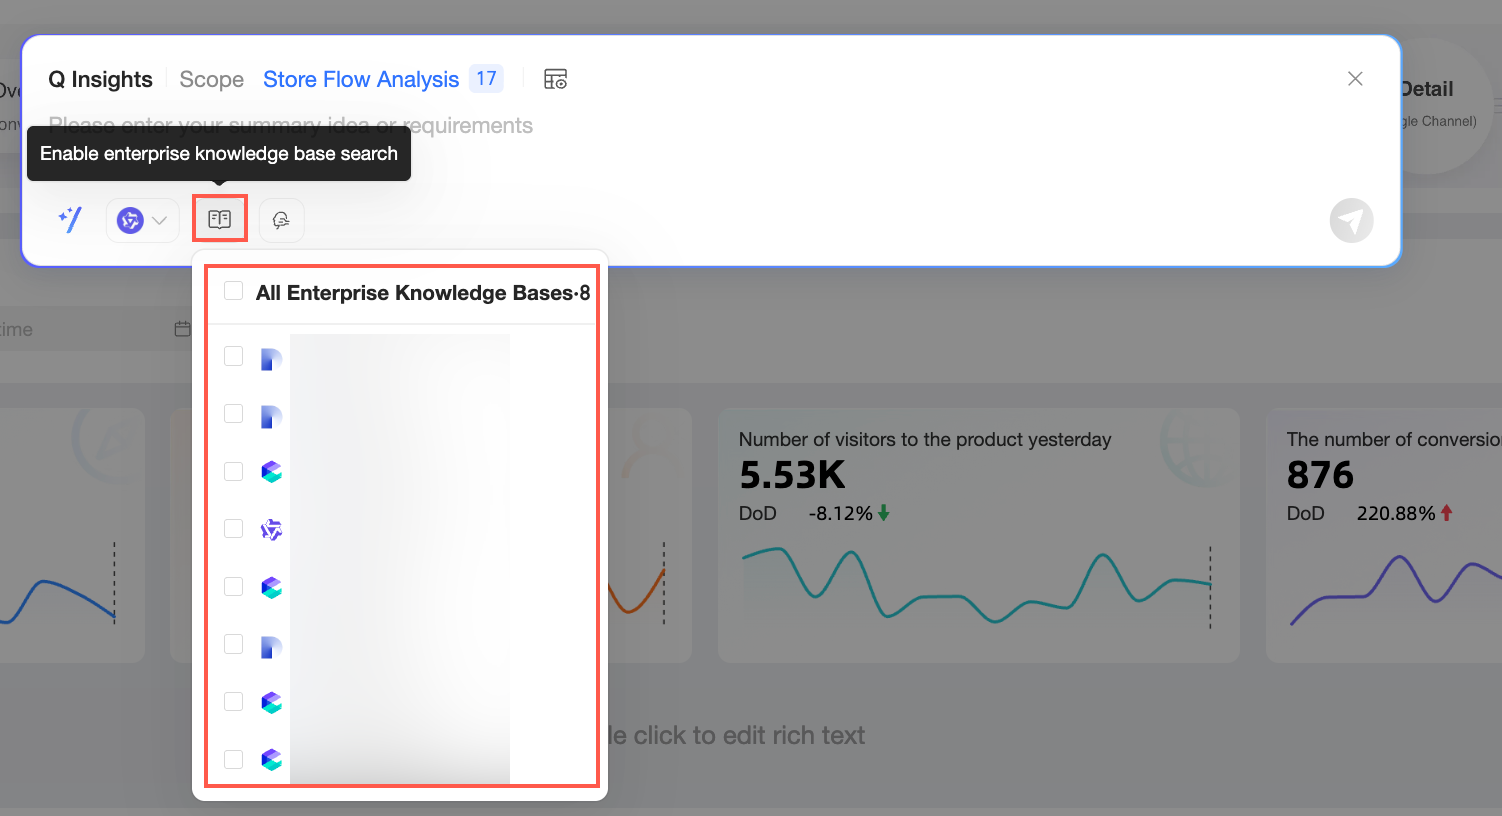
Enabling enterprise knowledge base search allows the large model to use information from the associated knowledge base, generating reports that better align with your company's business context and logic.
An organization administrator must first configure and enable a knowledge base in Organization Management. For more information about how to configure a knowledge base, see Knowledge Base Management.
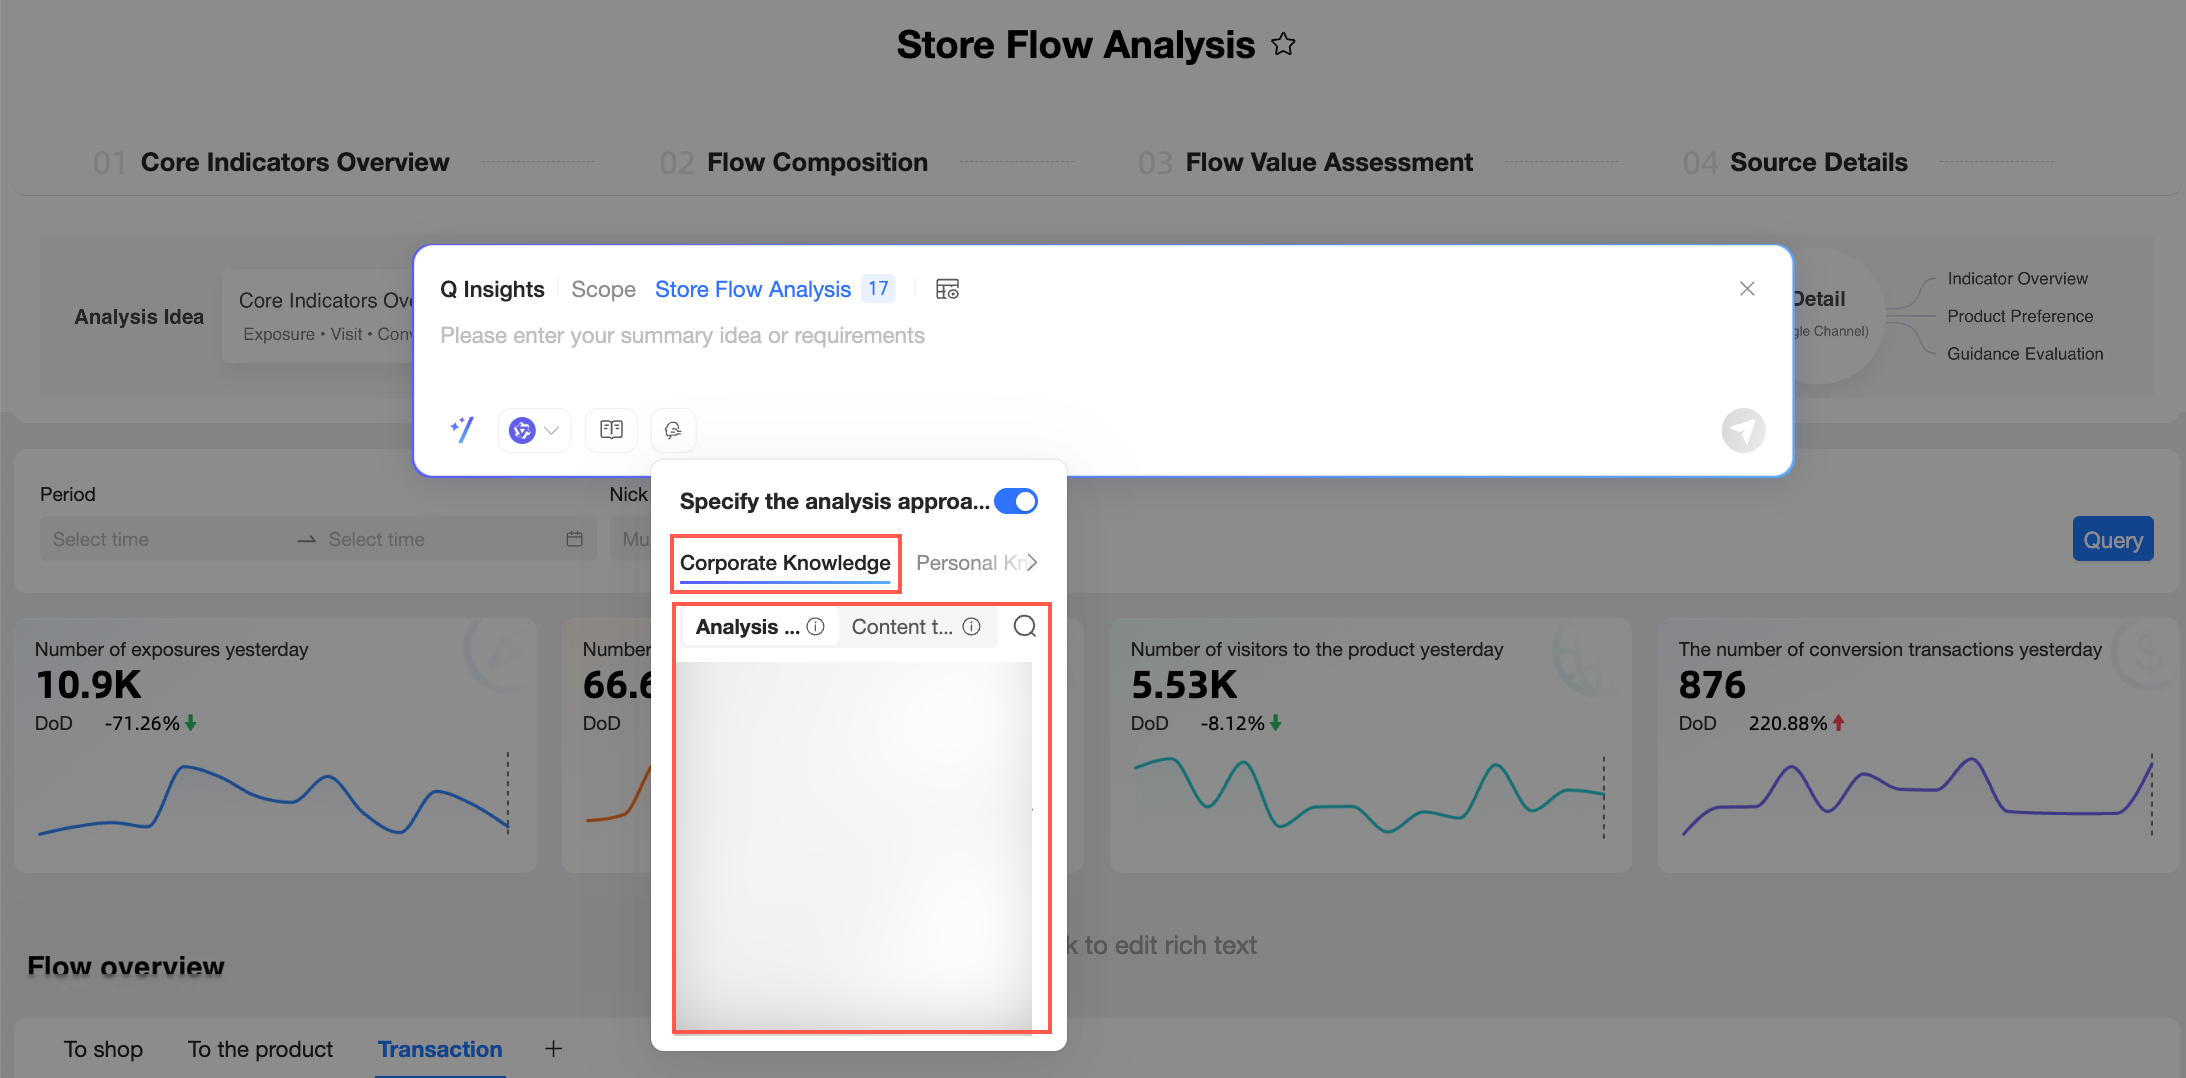
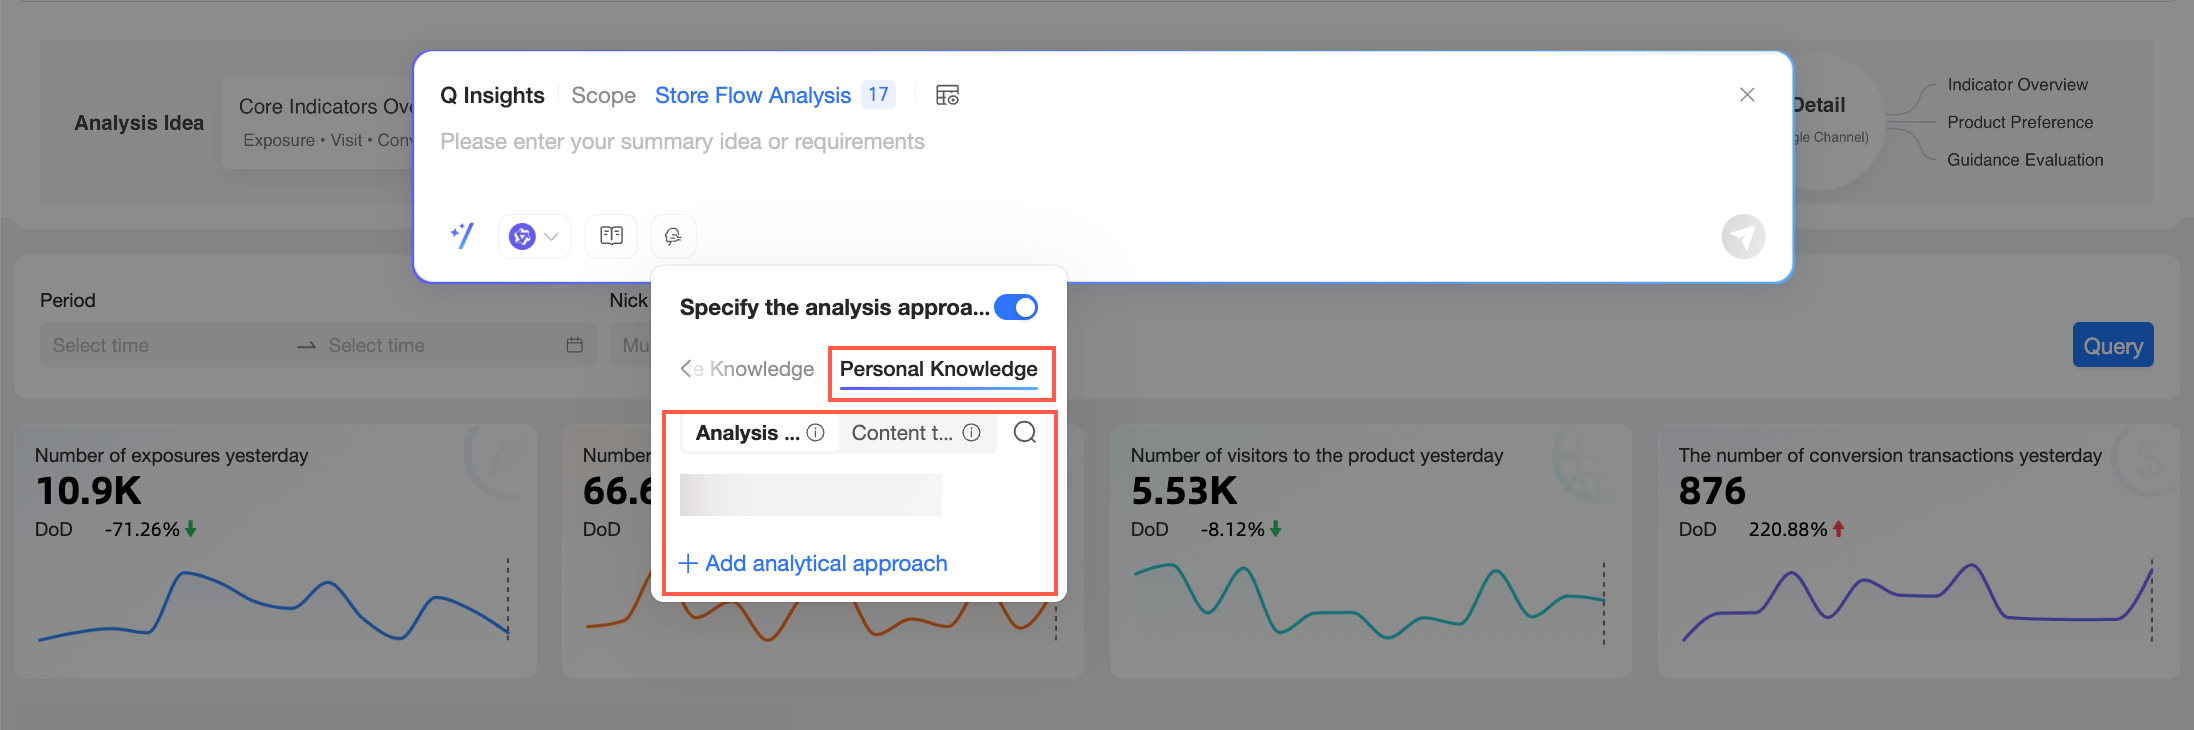
Analysis logic
After you enable **Specify analysis logic**, you can select an analysis logic from your Enterprise Knowledge or Personal Knowledge.
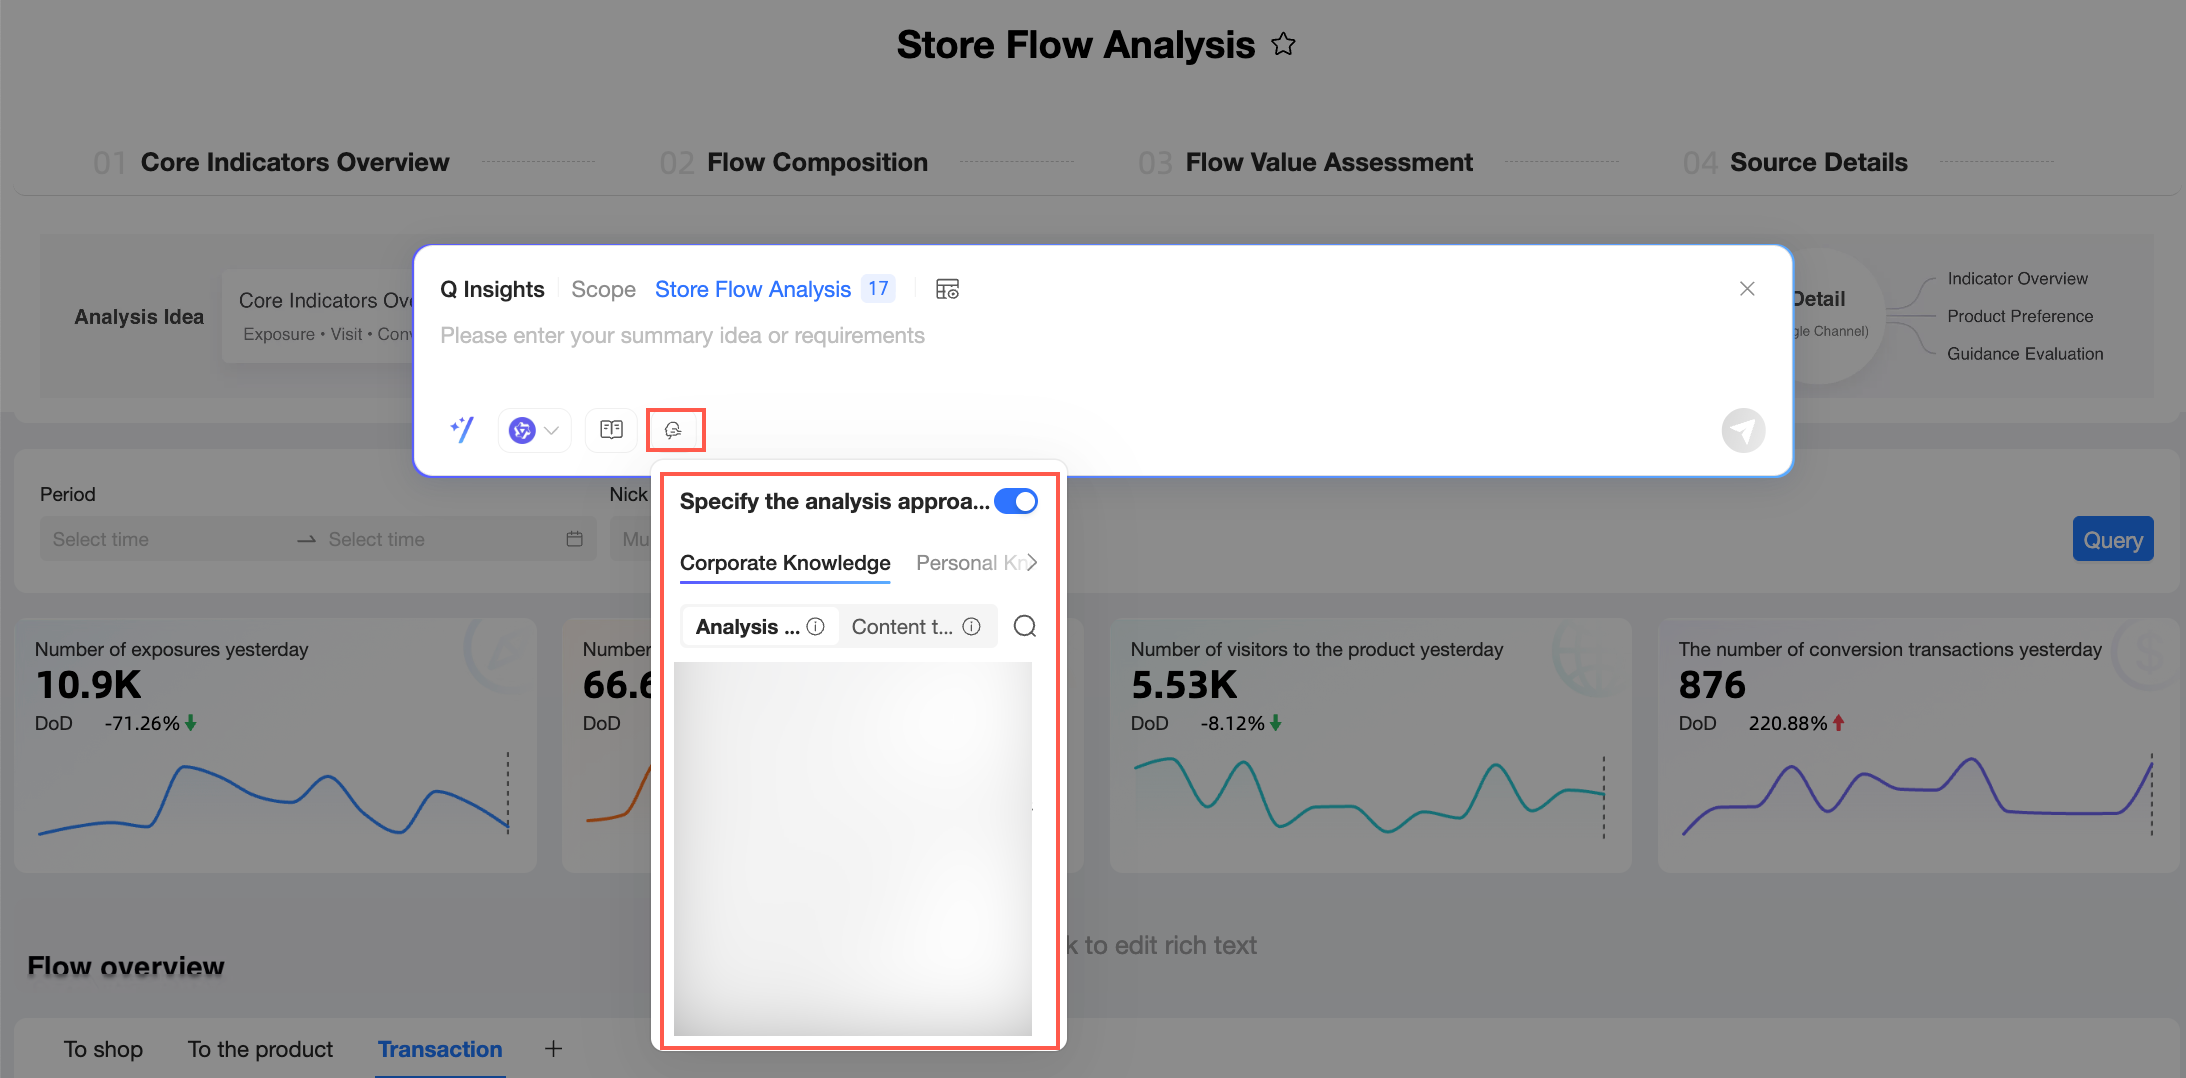
The Enterprise Knowledge tab displays common knowledge content configured and maintained across your organization, ensuring that reports from all team members follow consistent standards for analysis and structure.
Here, you can select an analysis logic or a content template.

Analysis logic: By configuring the analysis logic, you can guide the system to generate content that aligns with your company's analytical framework, avoiding generic results disconnected from your business context.
In this case, the large model generates the report's display structure. If you have specific requirements for the presentation layer, switch to the Content template tab and select a template. You can also define the display structure by using a prompt or uploading an attachment.
Content template: Specify both the analysis logic and the display output structure. By setting up a content template, you can pre-configure standard report frameworks in the system and ensure that the report's analysis logic meets your expectations.
Click the
icon next to an analysis logic or content template to preview its details in the Specify analysis logic dialog box.NoteIf you do not specify an analysis logic, the large model automatically plans the analysis logic based on your prompt.
To select an analysis logic or content template, an organization administrator must first configure and enable it in Organization Management. For more information about how to configure an analysis logic or content template, see Knowledge Base Management.
The Personal Knowledge tab displays private knowledge that you have uploaded. You can upload this knowledge as local files—based on your business role and experience—and apply it when generating reports.
Procedure:
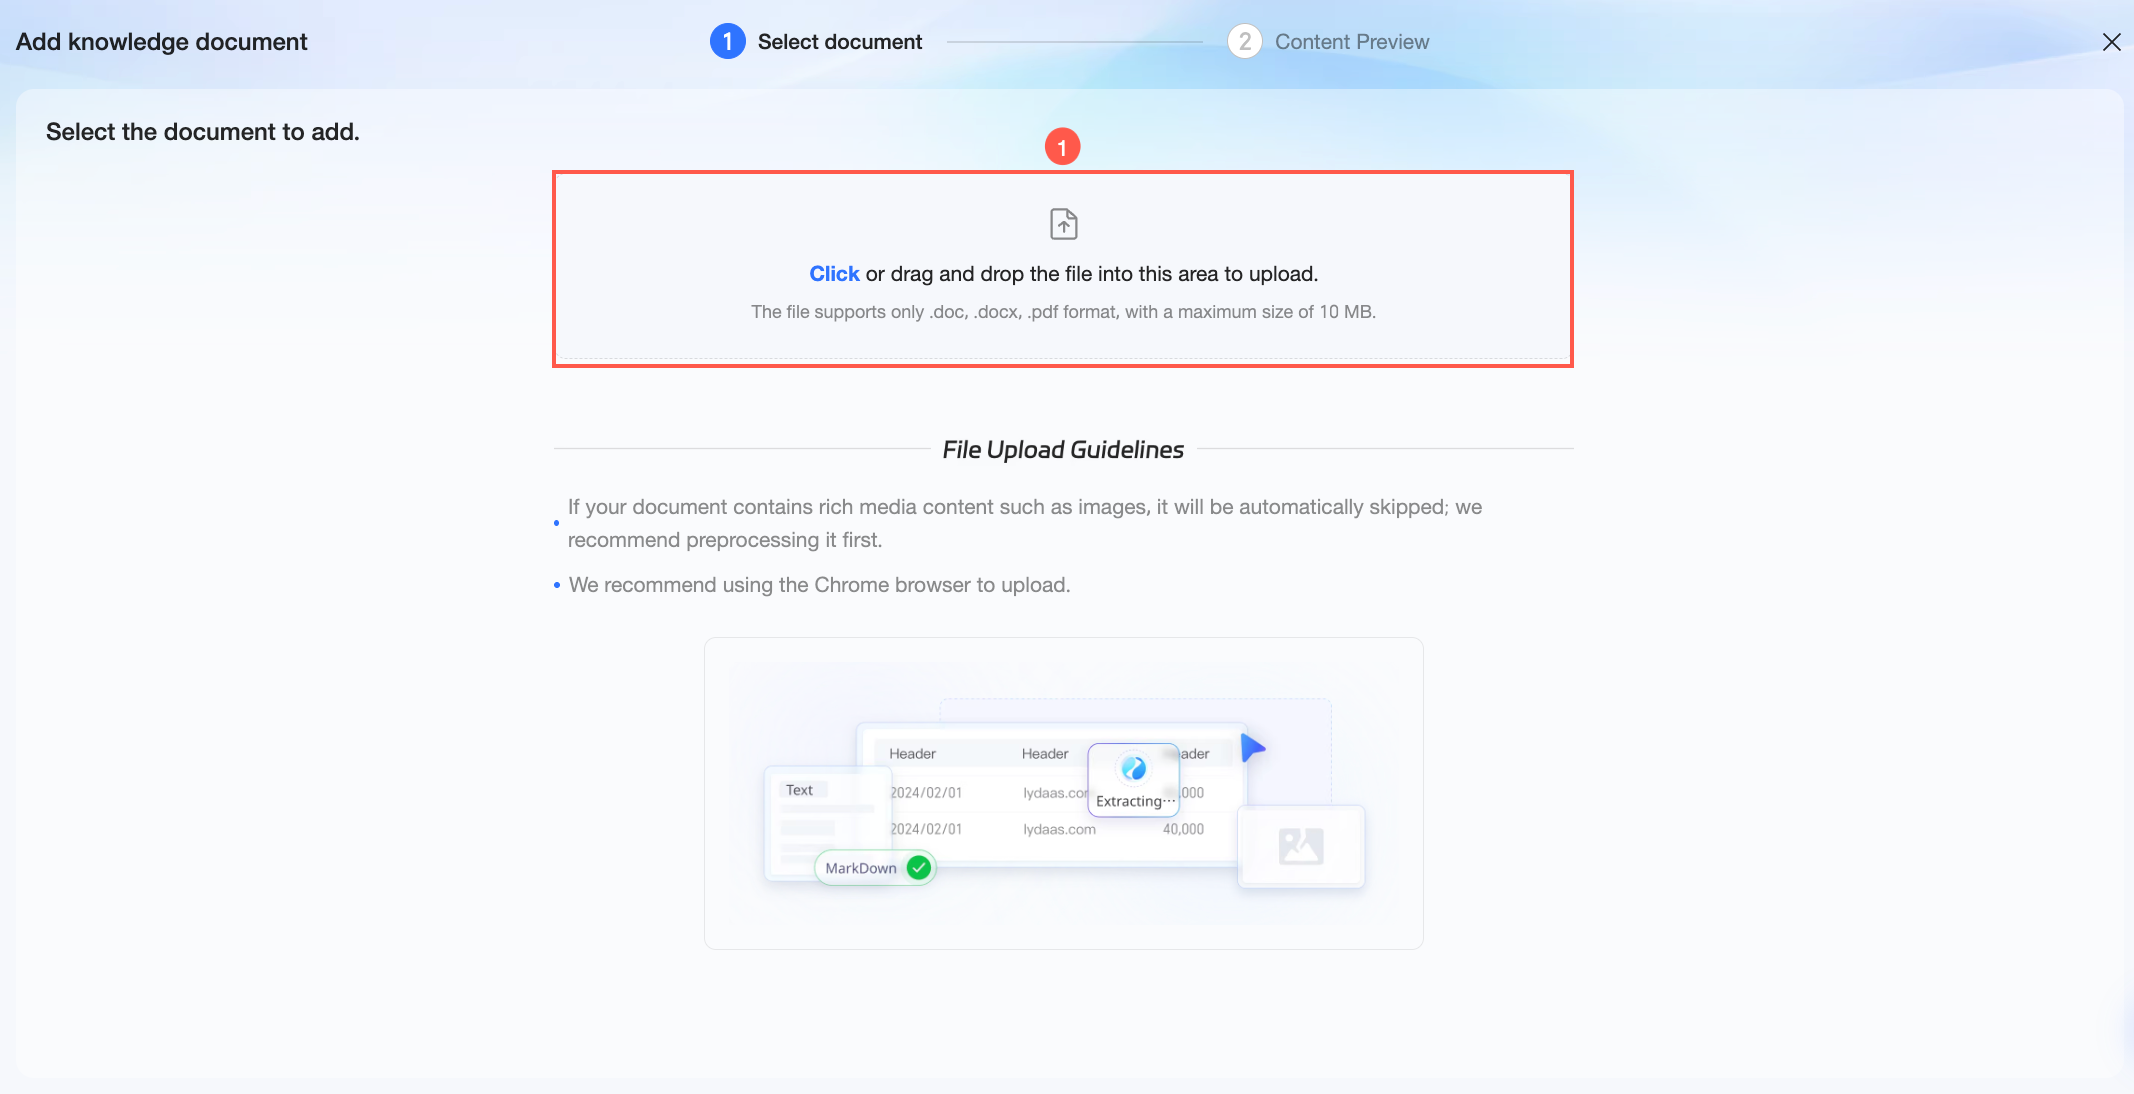
Click Add new personal knowledge. In the Add knowledge document dialog box, click or drag your knowledge file into area ① to upload it.
NoteSupports .doc and .PDF files up to 10 MB.
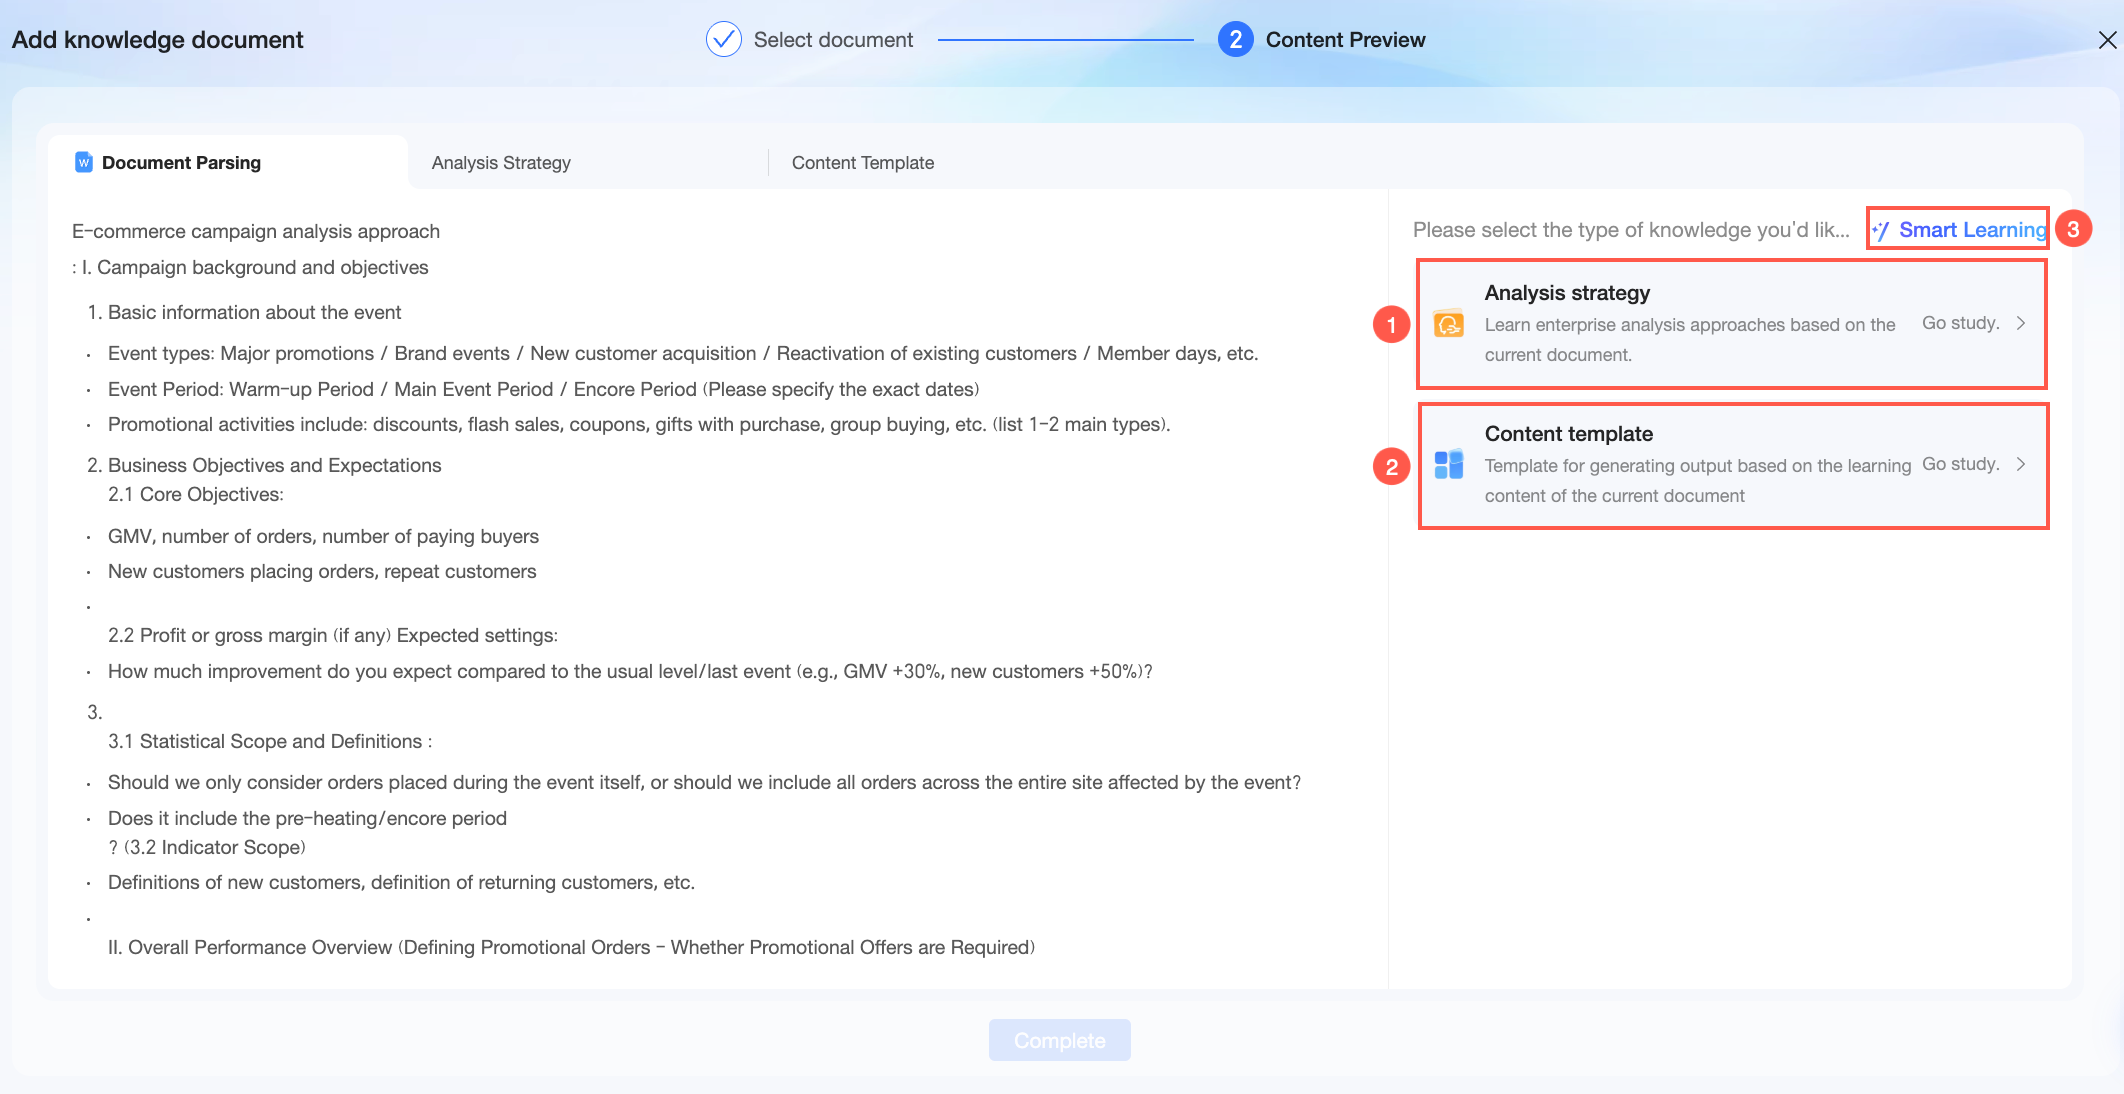
After uploading, you enter the Content preview stage. On the Document parsing tab, you can view the source document information and perform related actions.
① Click Learn in the analysis logic card. The system extracts the analysis logic from the document. After the process is complete, you can view the details on the Analysis logic tab.
The extracted analysis logic is displayed as a mind map. You can double-click the analysis logic name or a node to edit its text. You can also add or delete a node by clicking the icon or using the Delete key.② Click Learn in the content template card. The system learns the content output template from the document. After the process is complete, you can view the details on the Content template tab.
The content template extracted by the system is displayed here as a document. You can edit the text, adjust its format, or use AI to help you refine the existing content.③ Click Smart learning. Quick BI automatically learns from the document and extracts the corresponding type of knowledge.
Click Done. After the knowledge is added, you can see it in your personal knowledge list. You can perform the following actions:
Select a knowledge item to apply it during report generation.
Click the
icon and enter keywords in the search box to quickly find a specific knowledge item.Click the
icon to delete unneeded knowledge items.Click the
icon to preview the knowledge item's details in the Specify analysis logic dialog box.
NotePersonal knowledge can only be used by the person who uploaded it. It is not visible to other members of the organization and is not synchronized with the enterprise knowledge base under Organization Management.
If a report creator shares a report that uses personal knowledge and grants editing permissions to another user, the authorized user can update data and regenerate the report within the shared report. However, they cannot use the creator's personal knowledge when performing actions like one-click report generation outside of the report.
 icon next to an analysis logic or content template to preview its details in the Specify analysis logic dialog box.
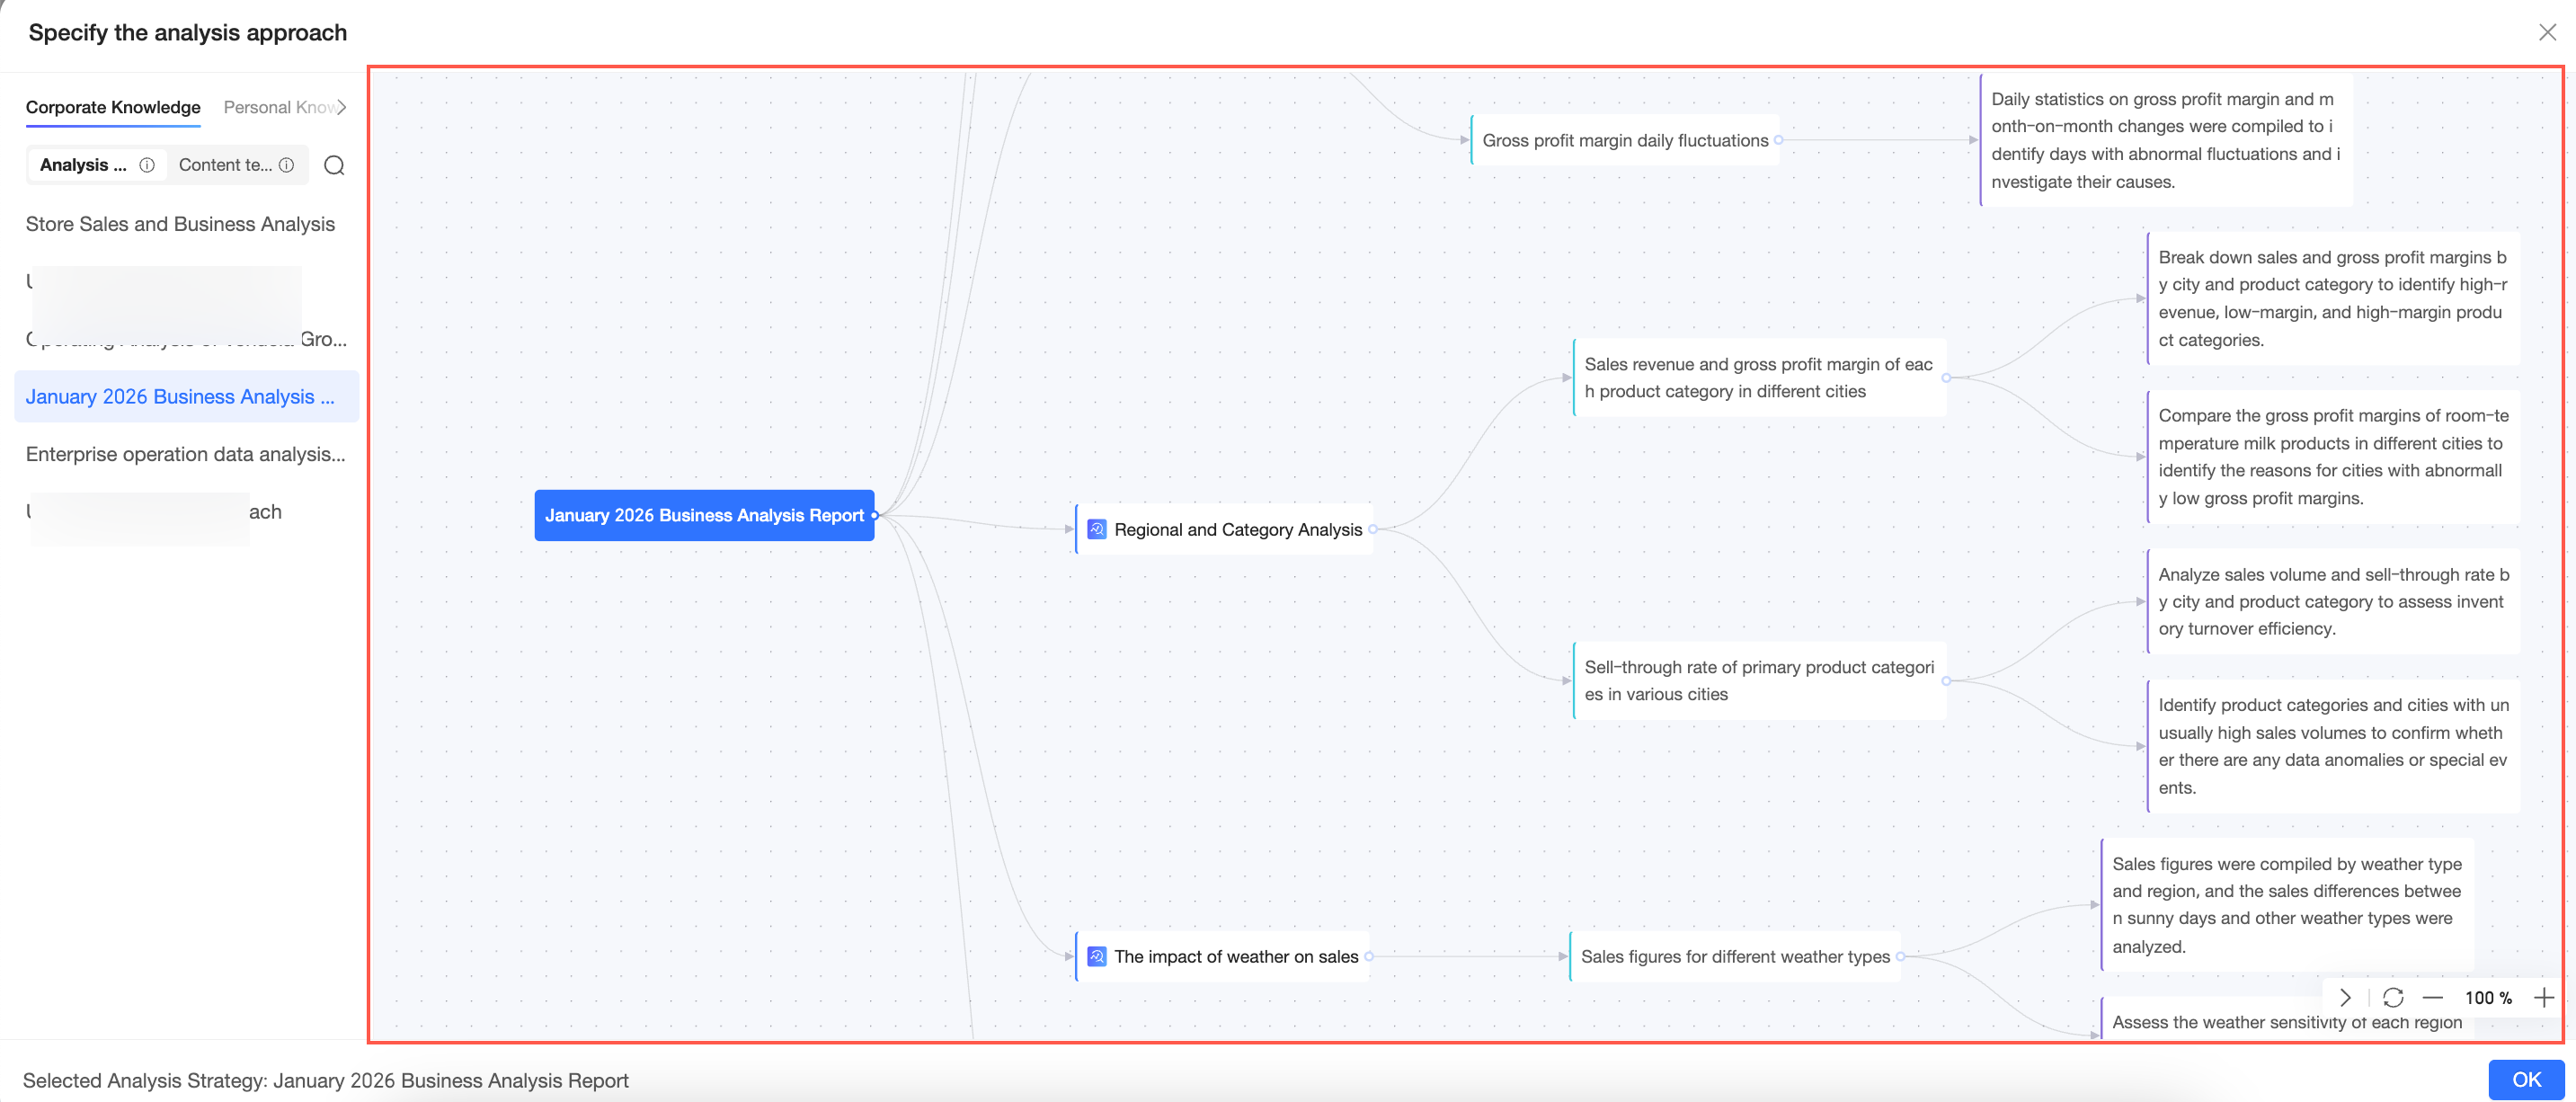
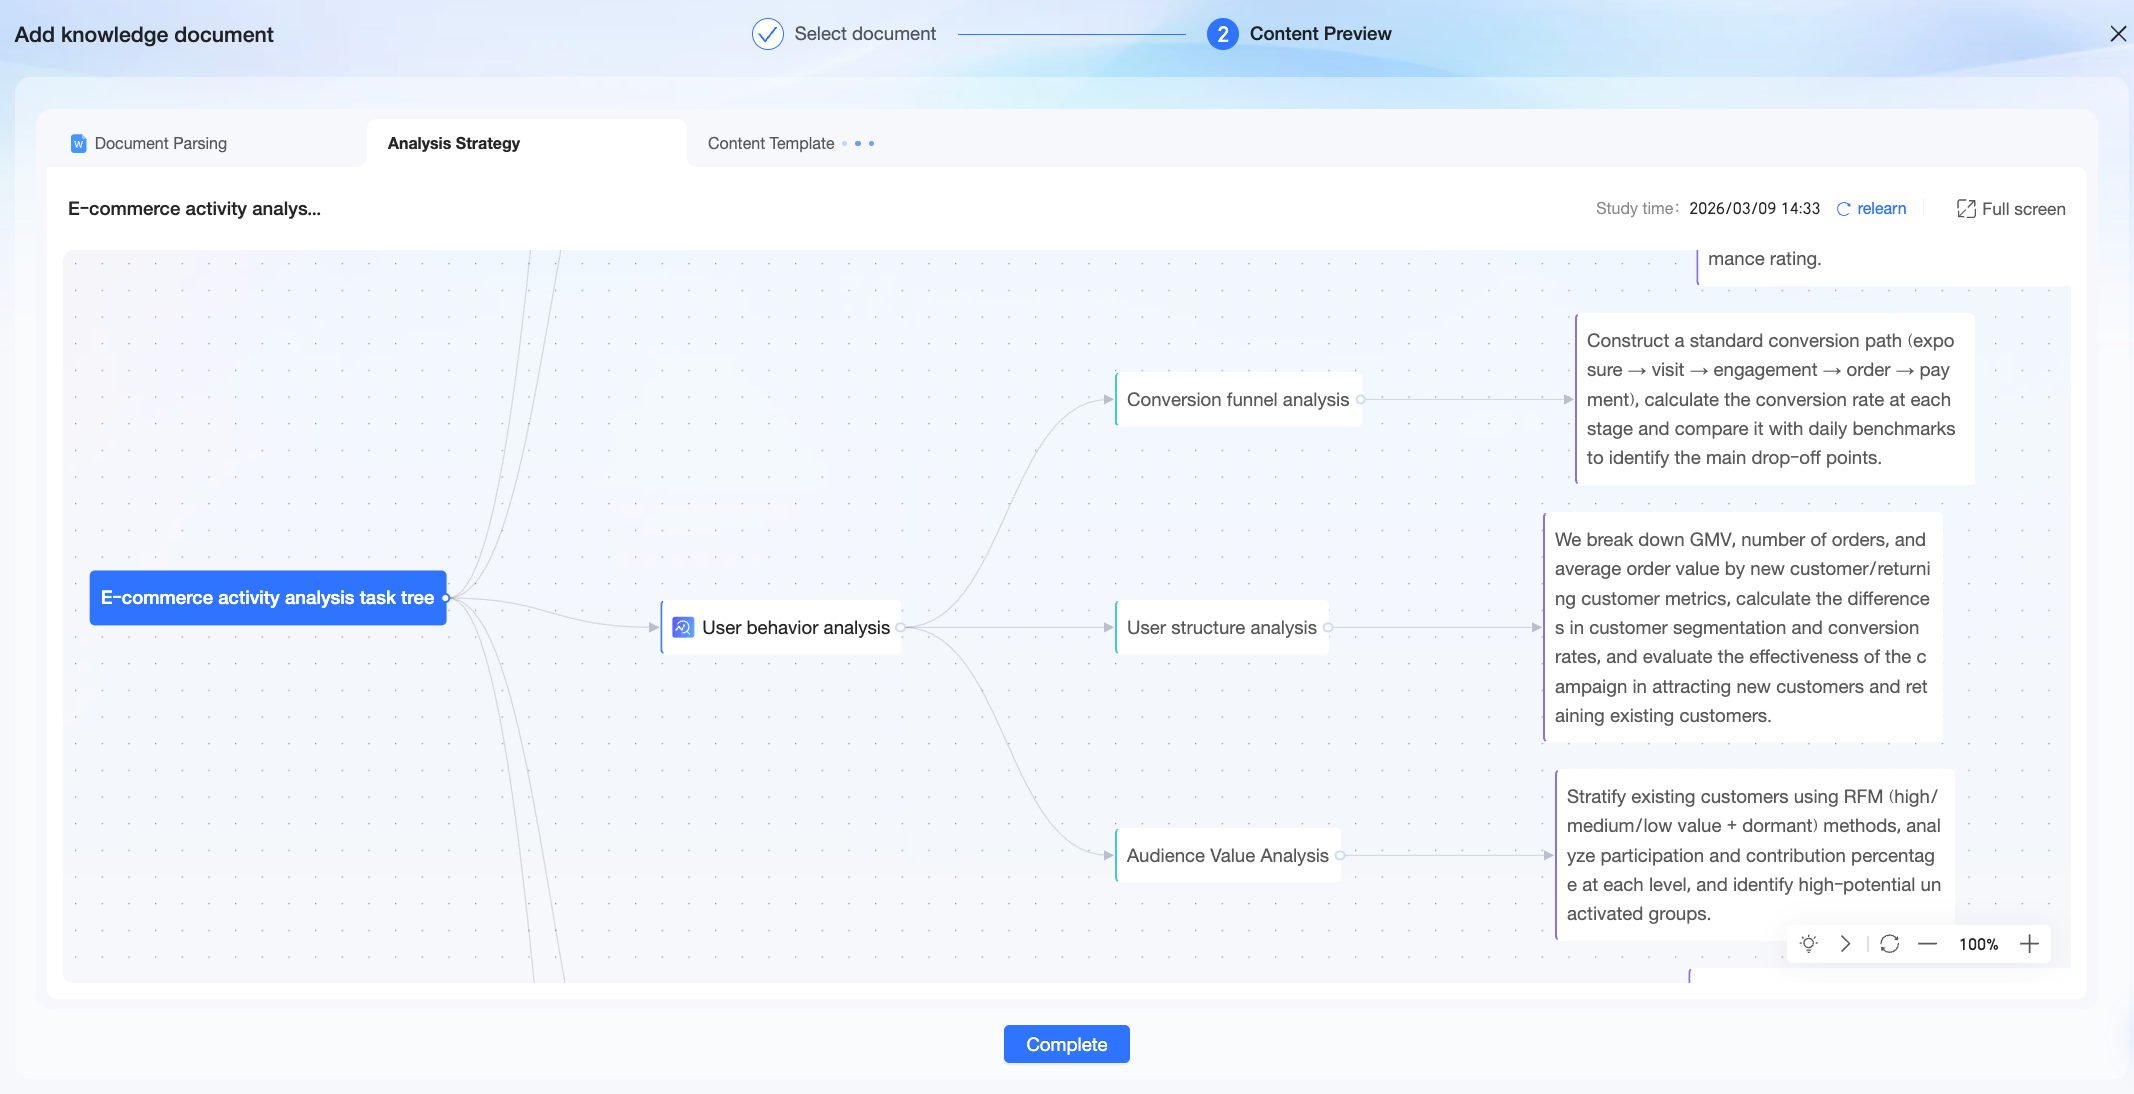 The extracted analysis logic is displayed as a mind map. You can double-click the analysis logic name or a node to edit its text. You can also add or delete a node by clicking the
  icon or using the Delete key.
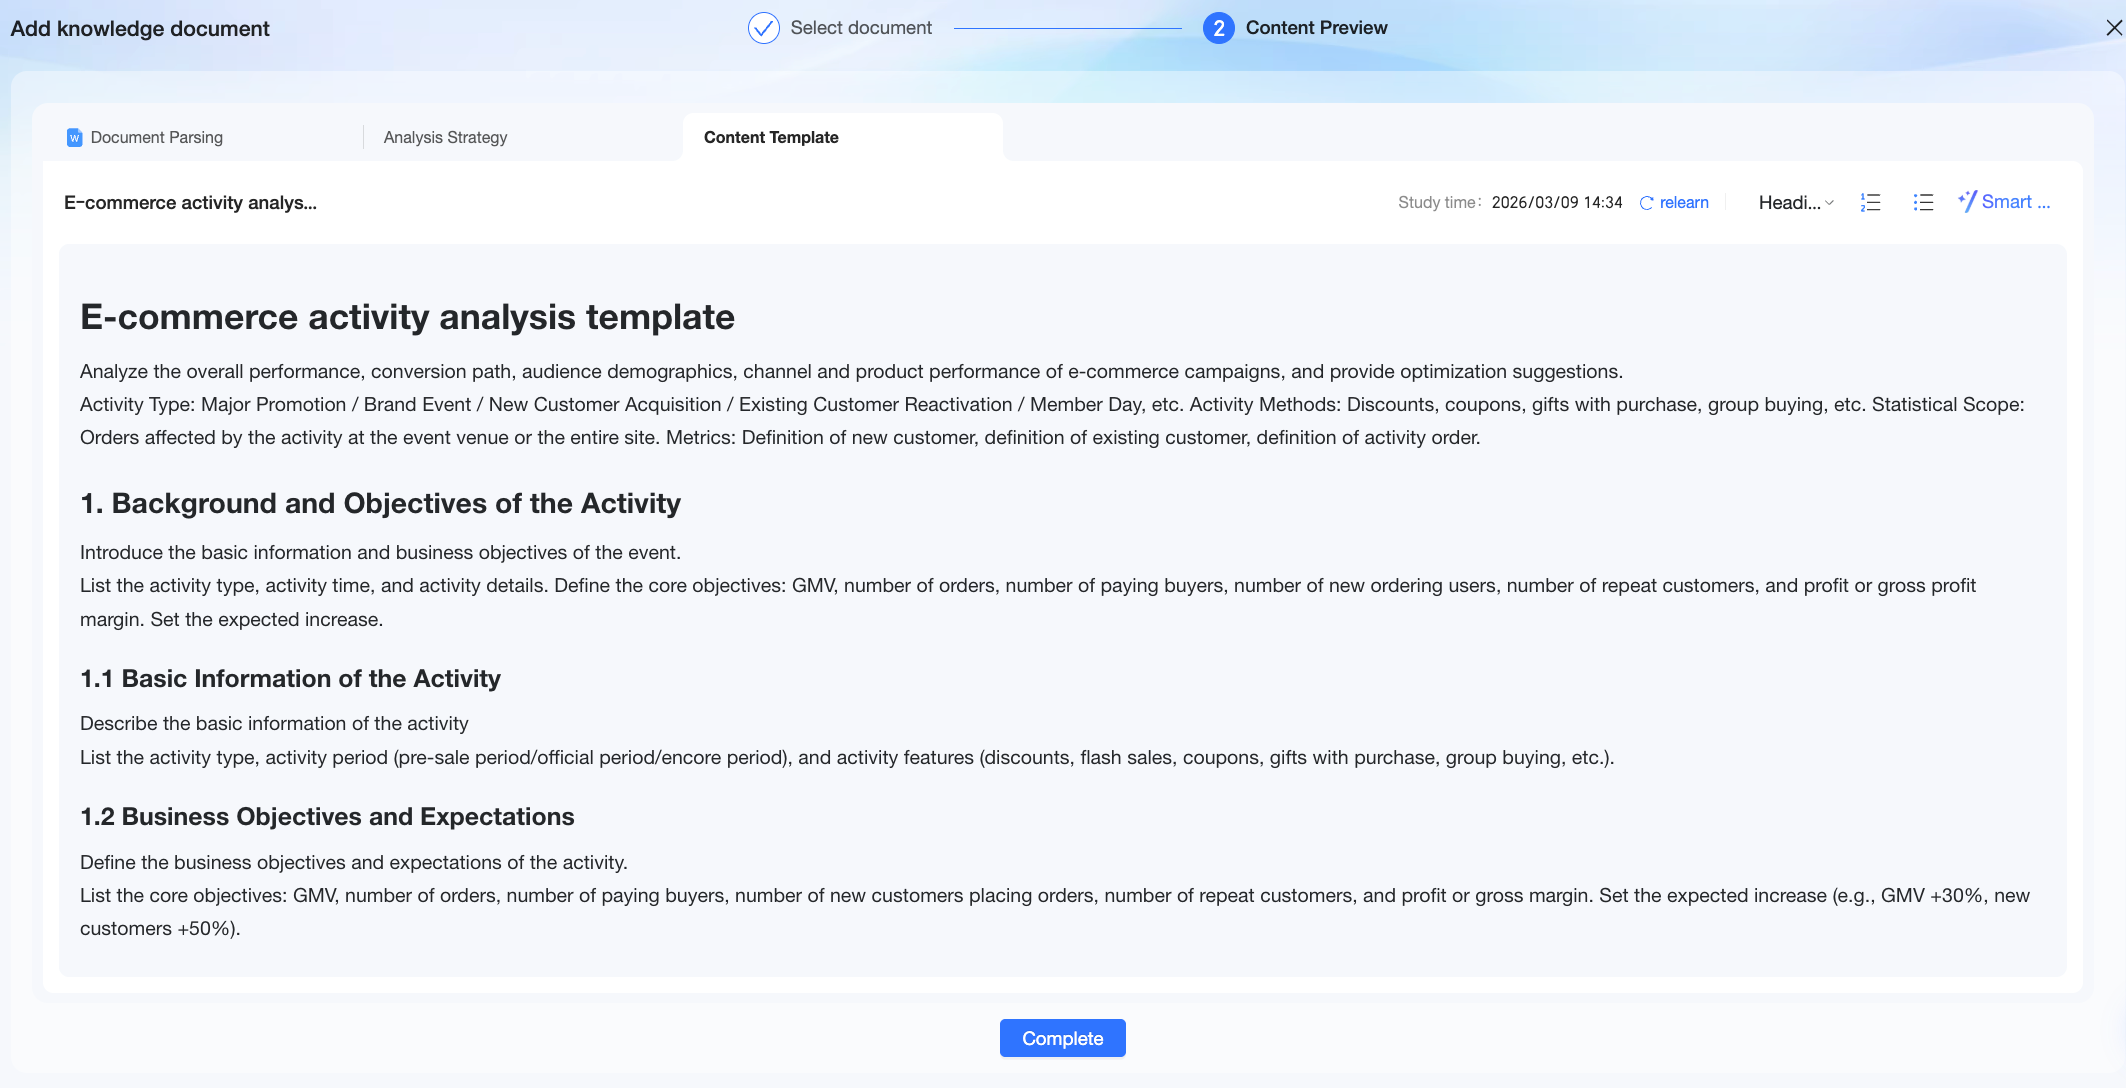 The content template extracted by the system is displayed here as a document. You can edit the text, adjust its format, or use AI to help you refine the existing content.
Interpretation approach
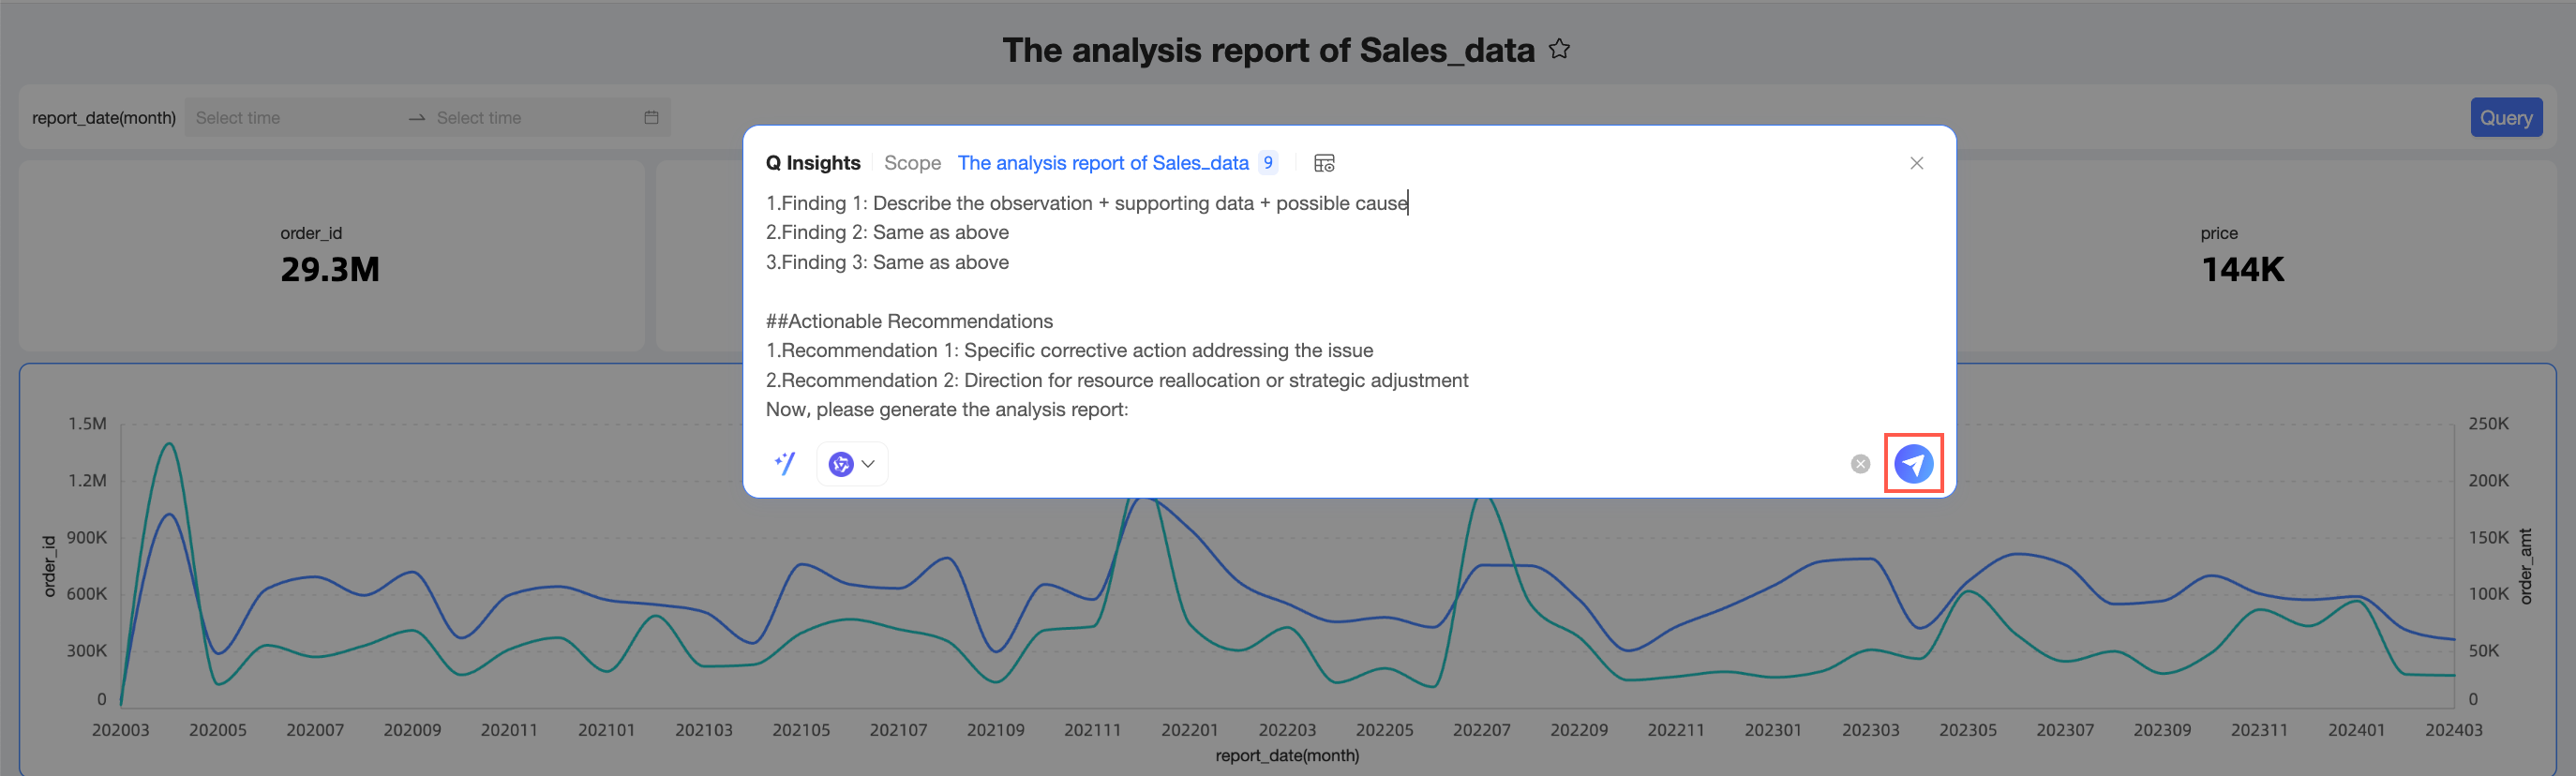
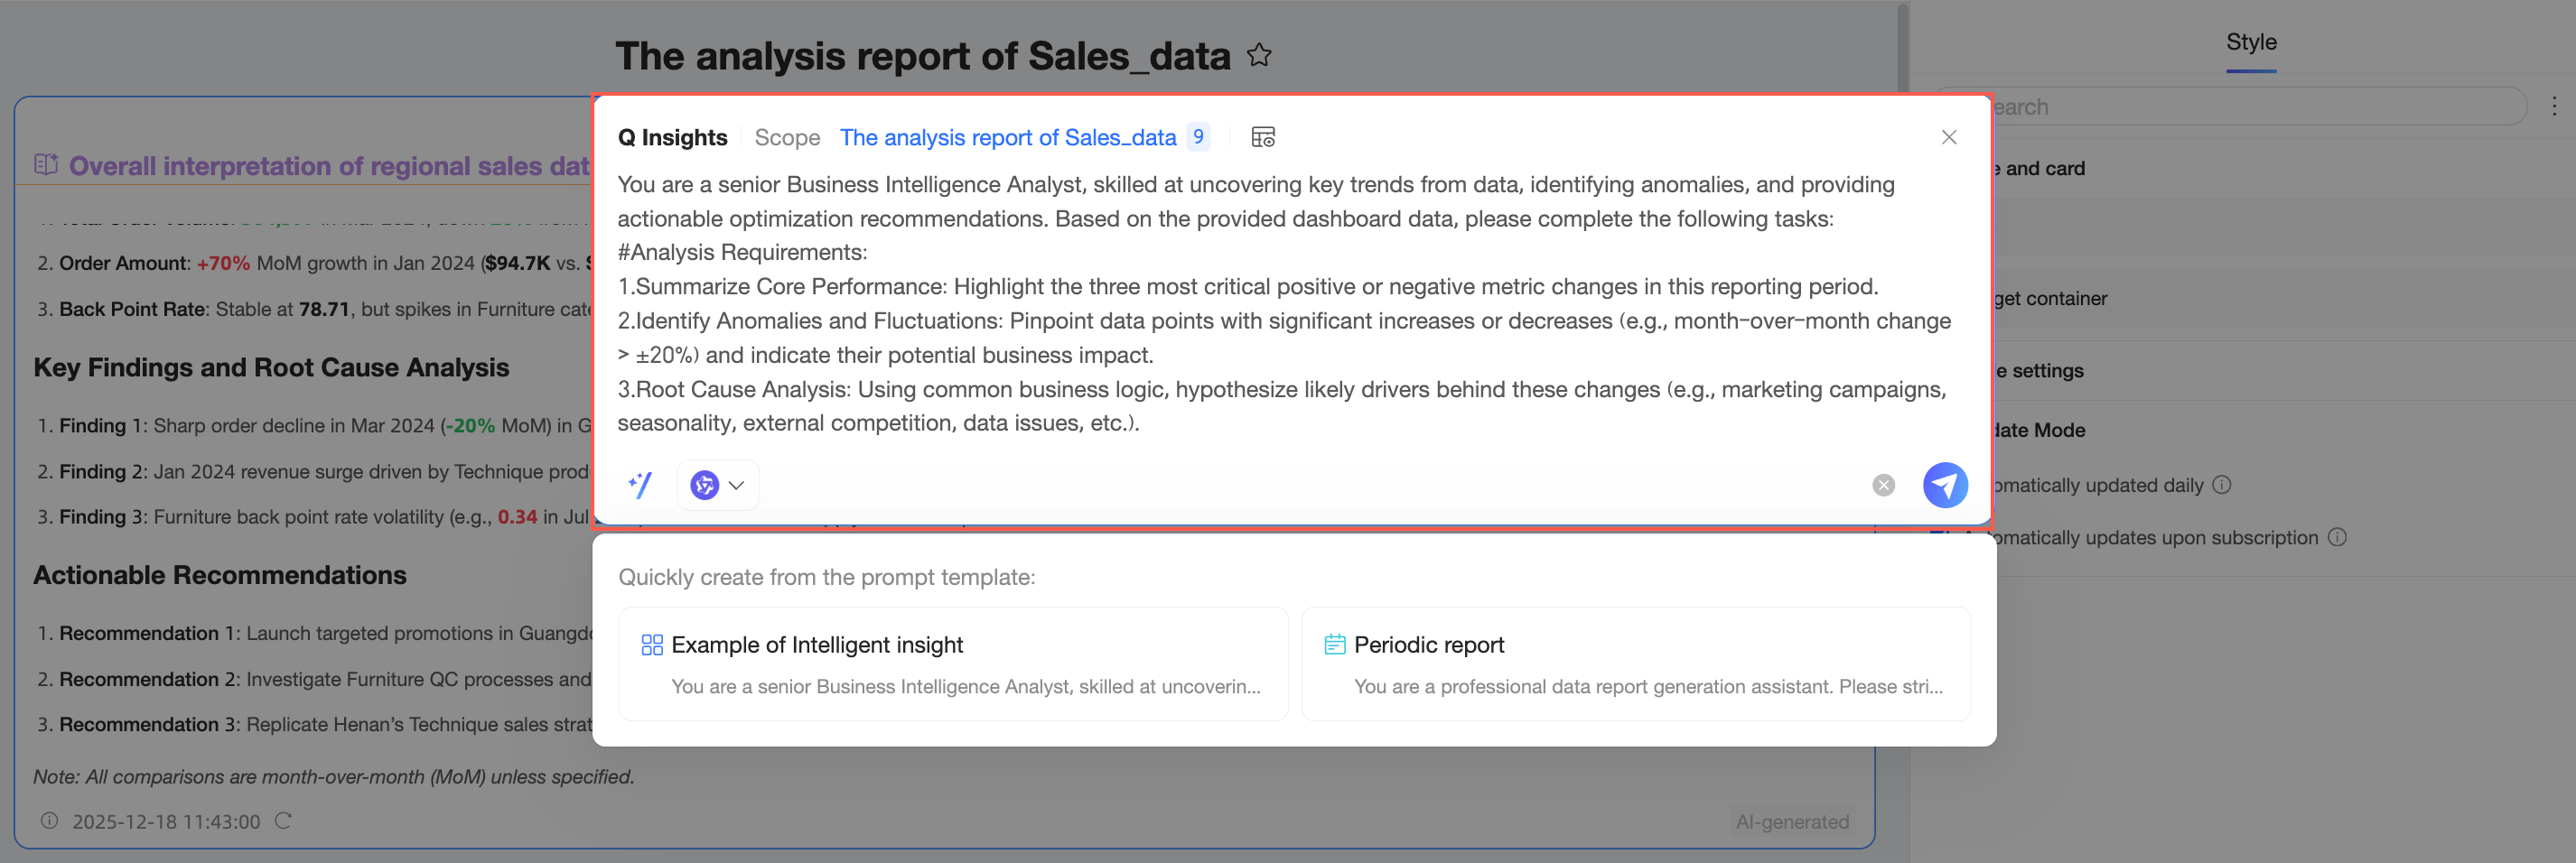
Enter a summary of your analysis approach or requirements.
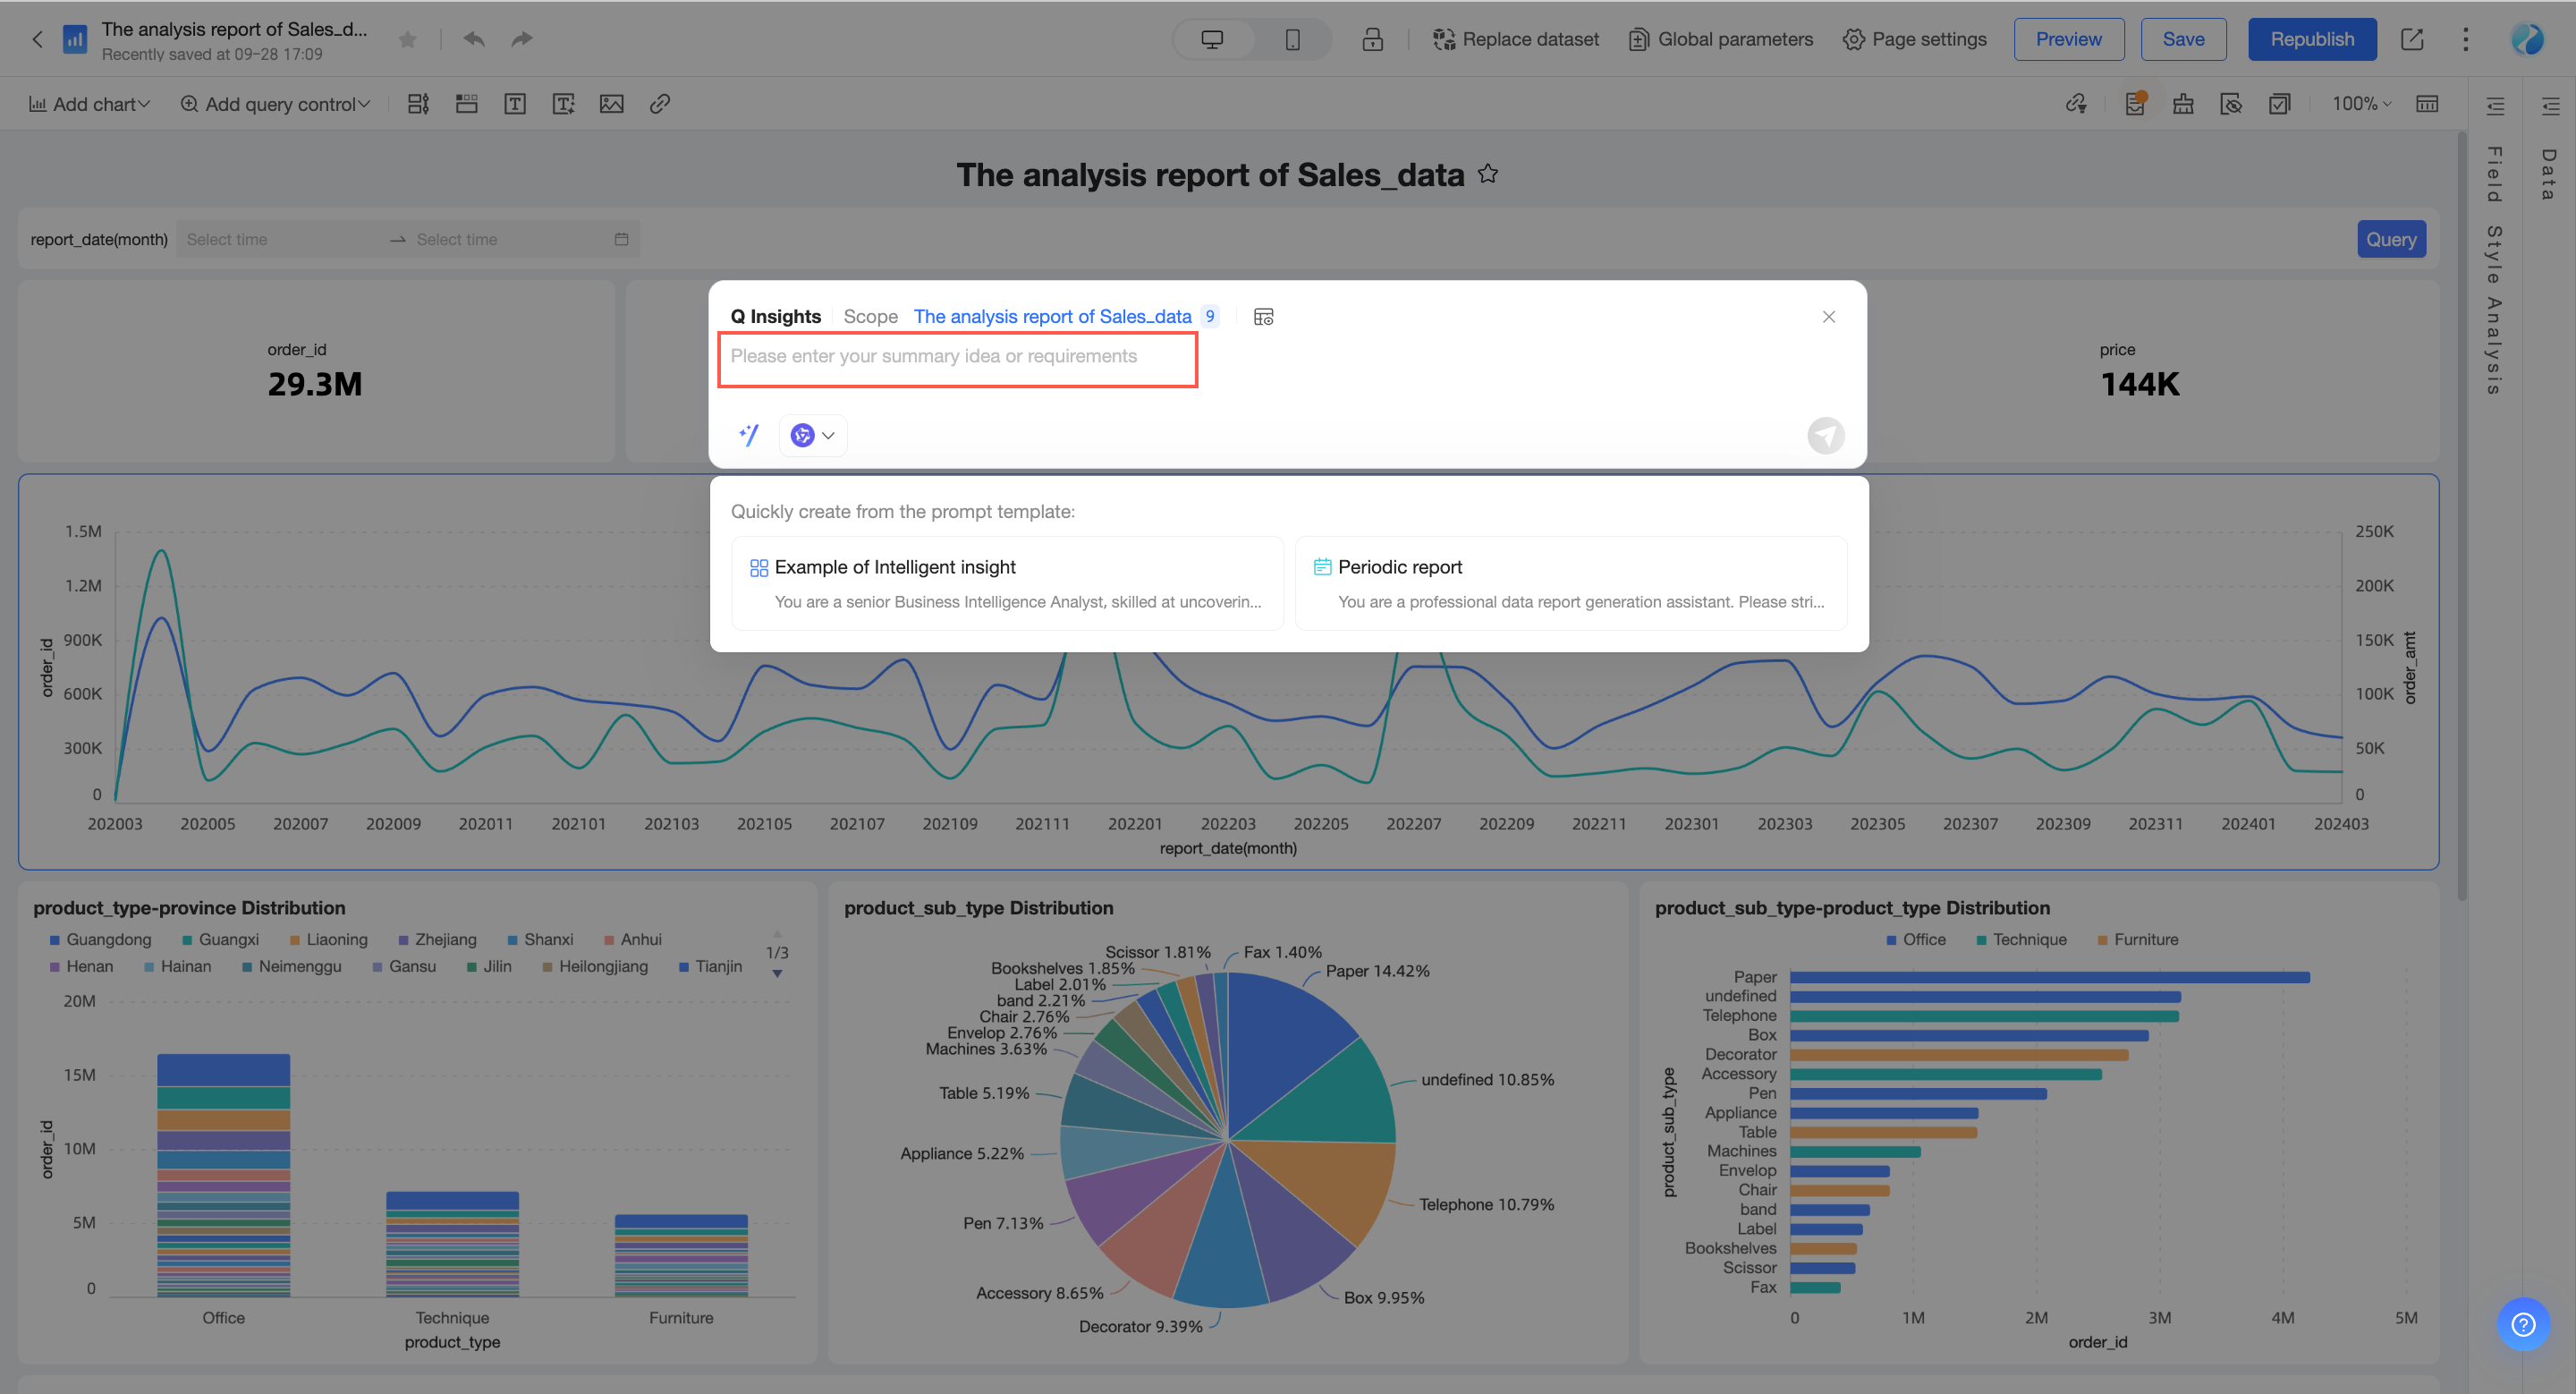
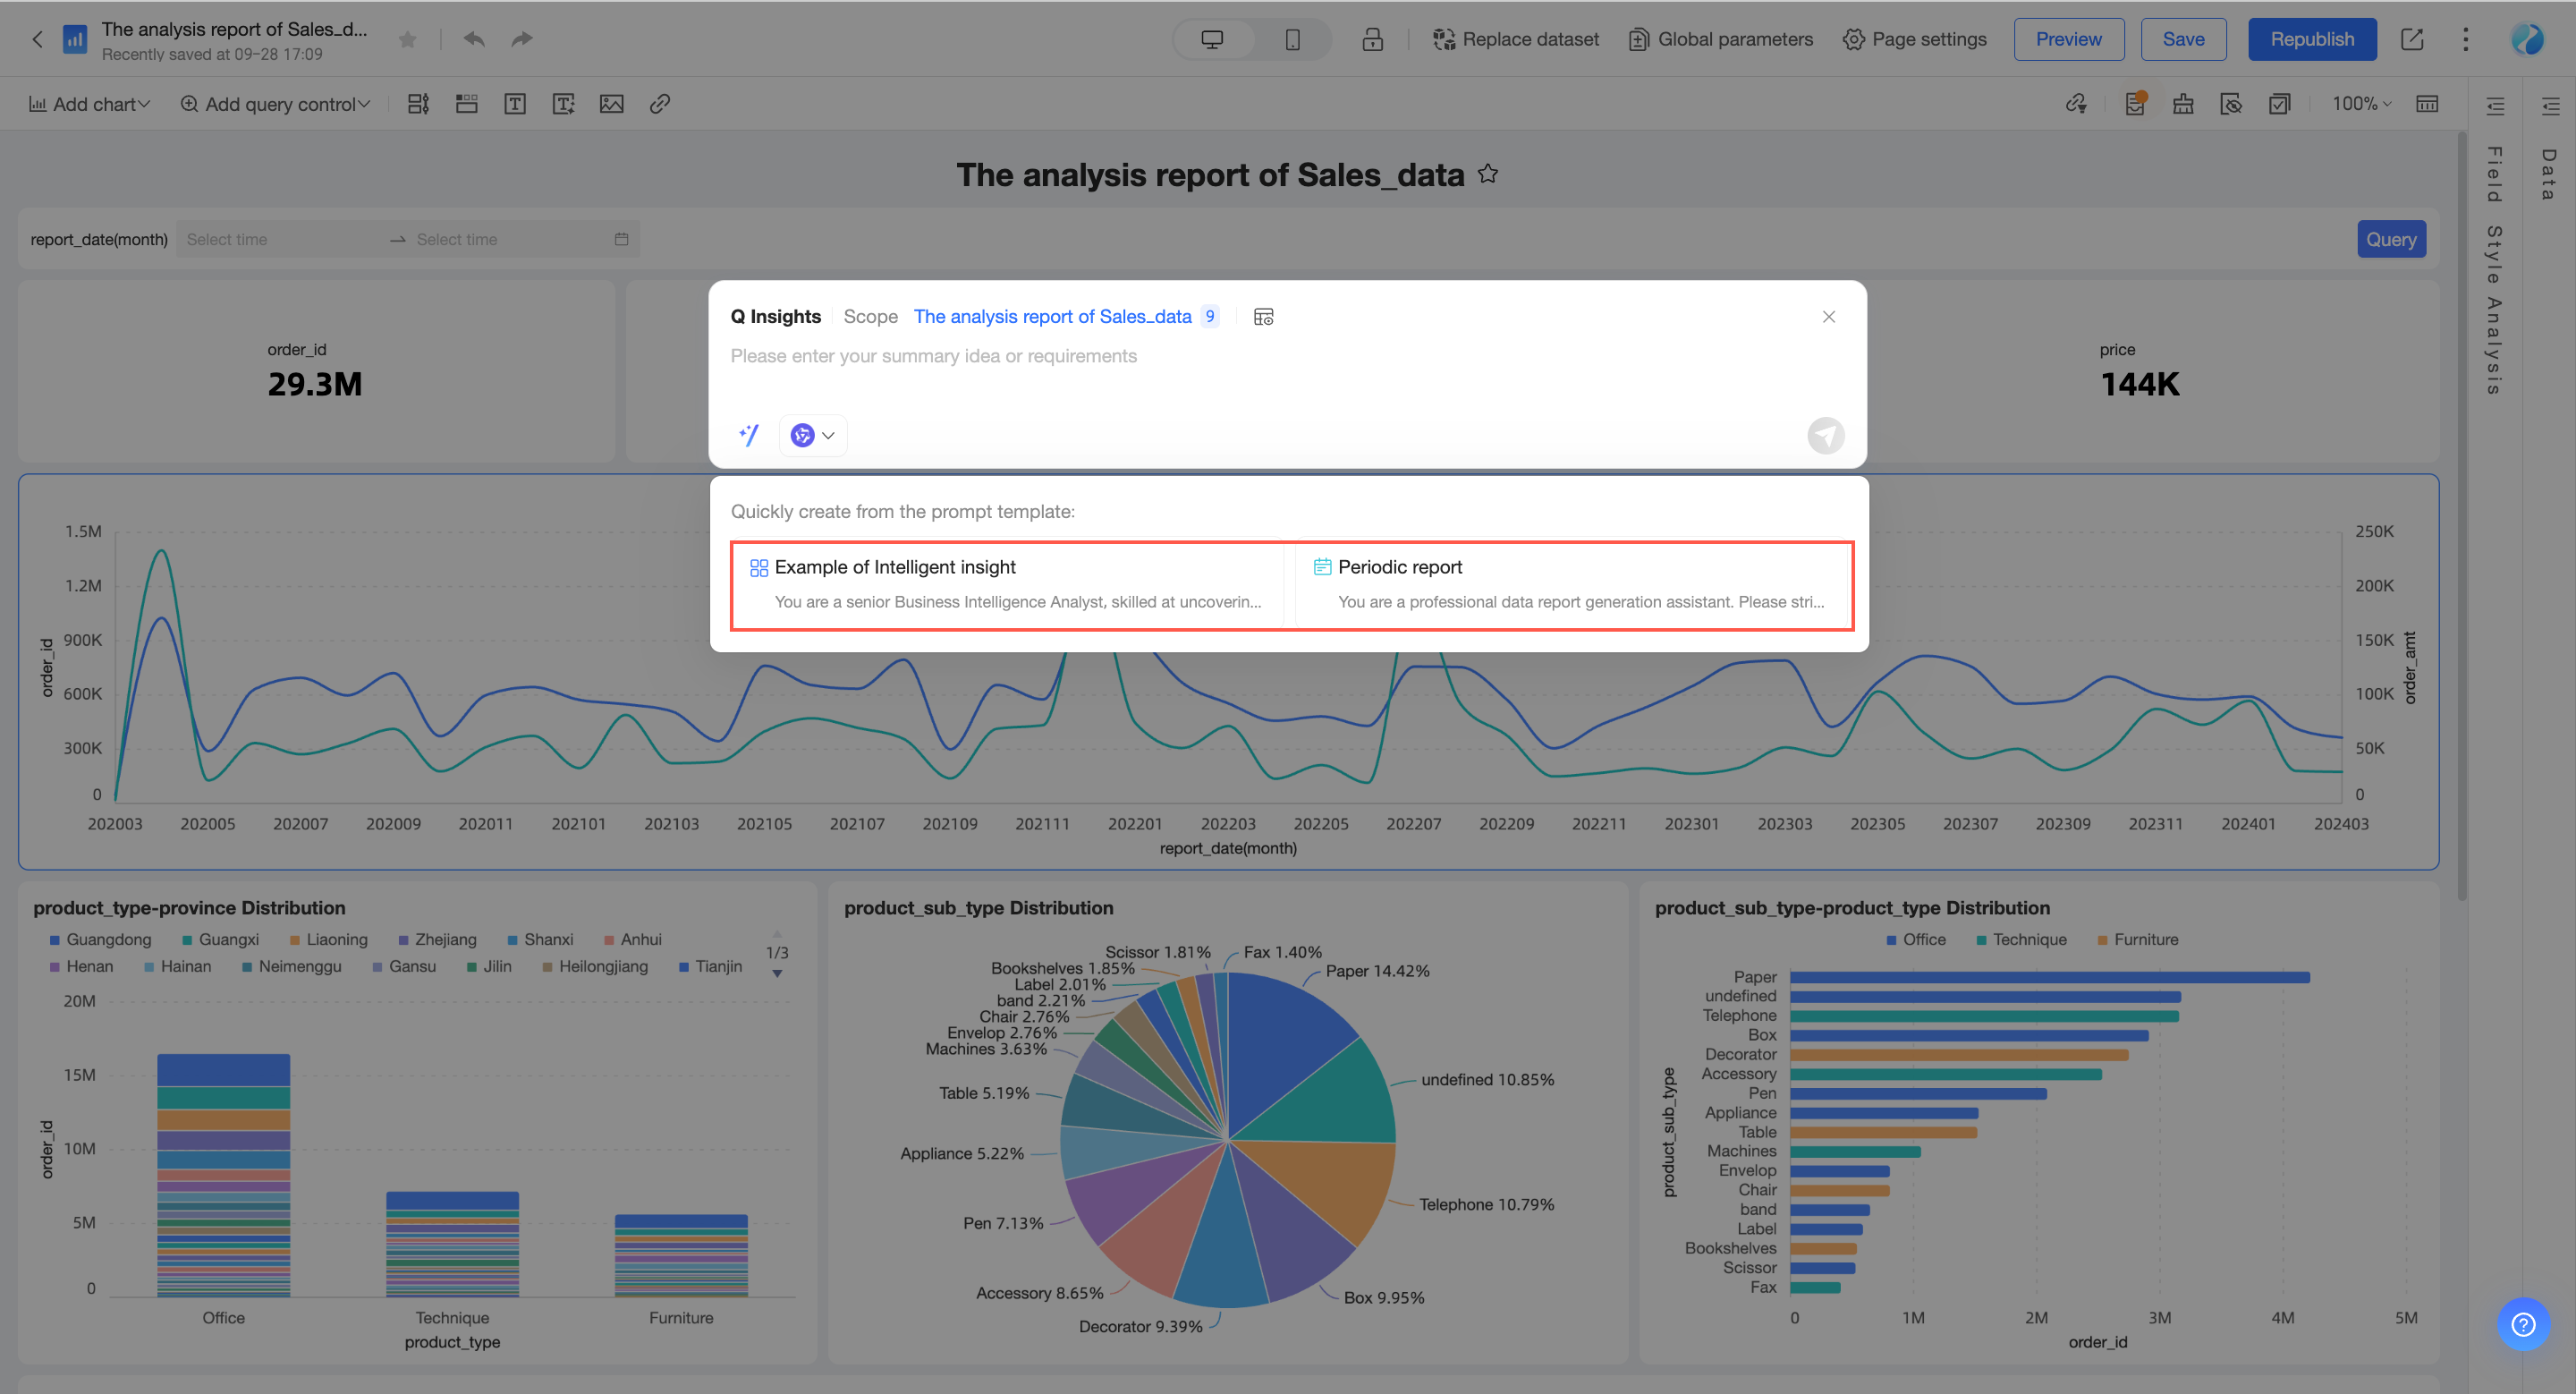
You can also Create from prompt template.
Analysis result
Click the ![]() icon in the lower-right corner or press Enter to send. The system returns the analysis result.
icon in the lower-right corner or press Enter to send. The system returns the analysis result.
You can Stop generating during the interpretation process.
Apply result
Below the generated Intelligent Q interpretation result, you can Copy Trace_ID, Regenerate, Discard, or Apply the result.
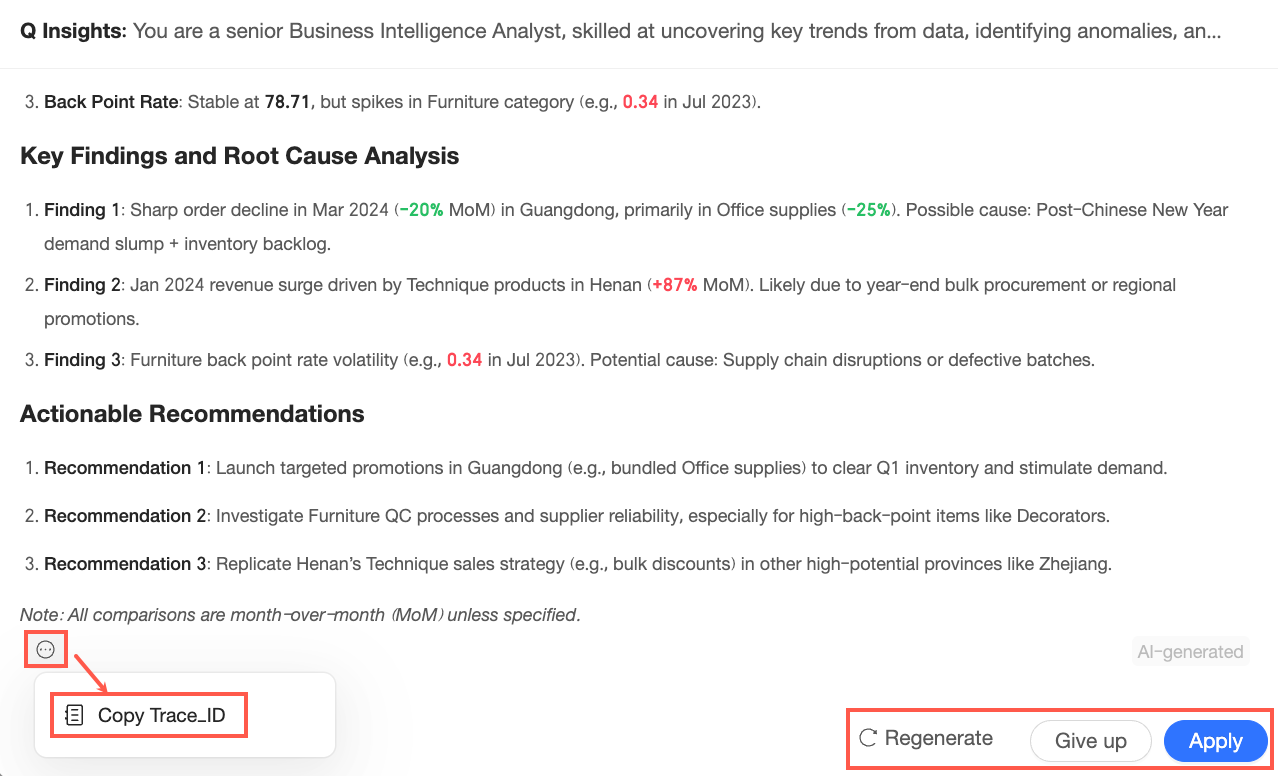
If the generated result meets your expectations, click Apply to add it to the dashboard or the corresponding chart.
If you are performing a global dashboard interpretation, the result is applied to the dashboard.
If you are performing a single chart component interpretation, the result is applied to the corresponding chart.
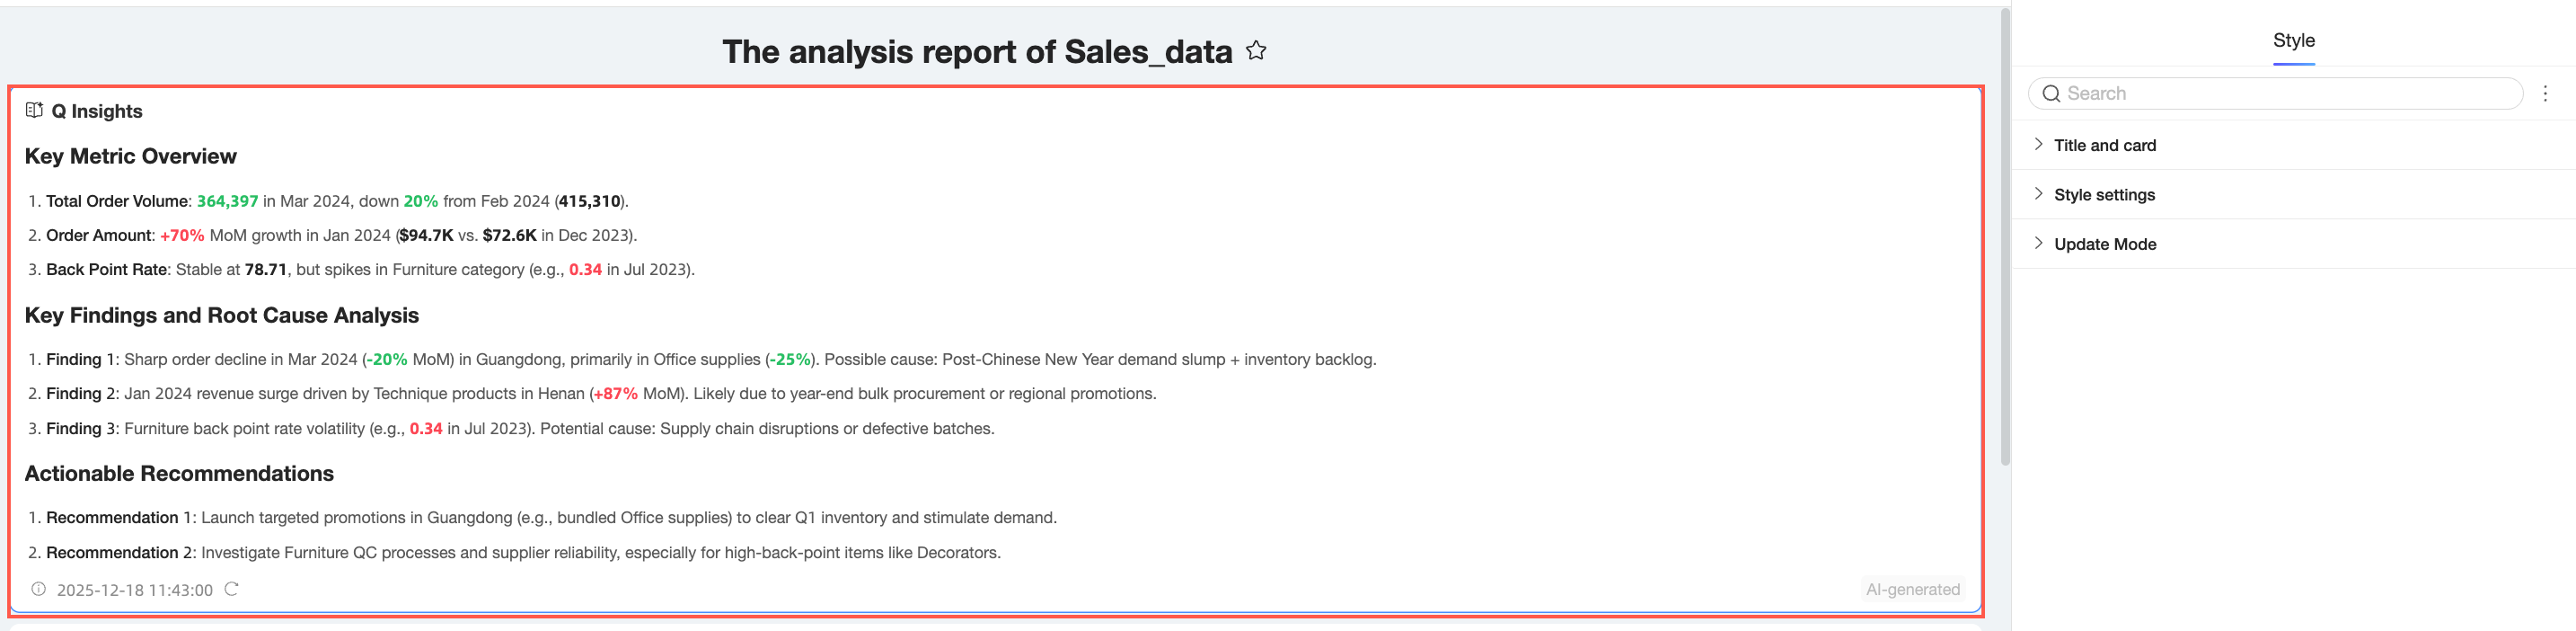
Interpretation component configuration
Select the interpretation component to configure its Quick Templates, Title and Card, Style Settings, and Update Mode.
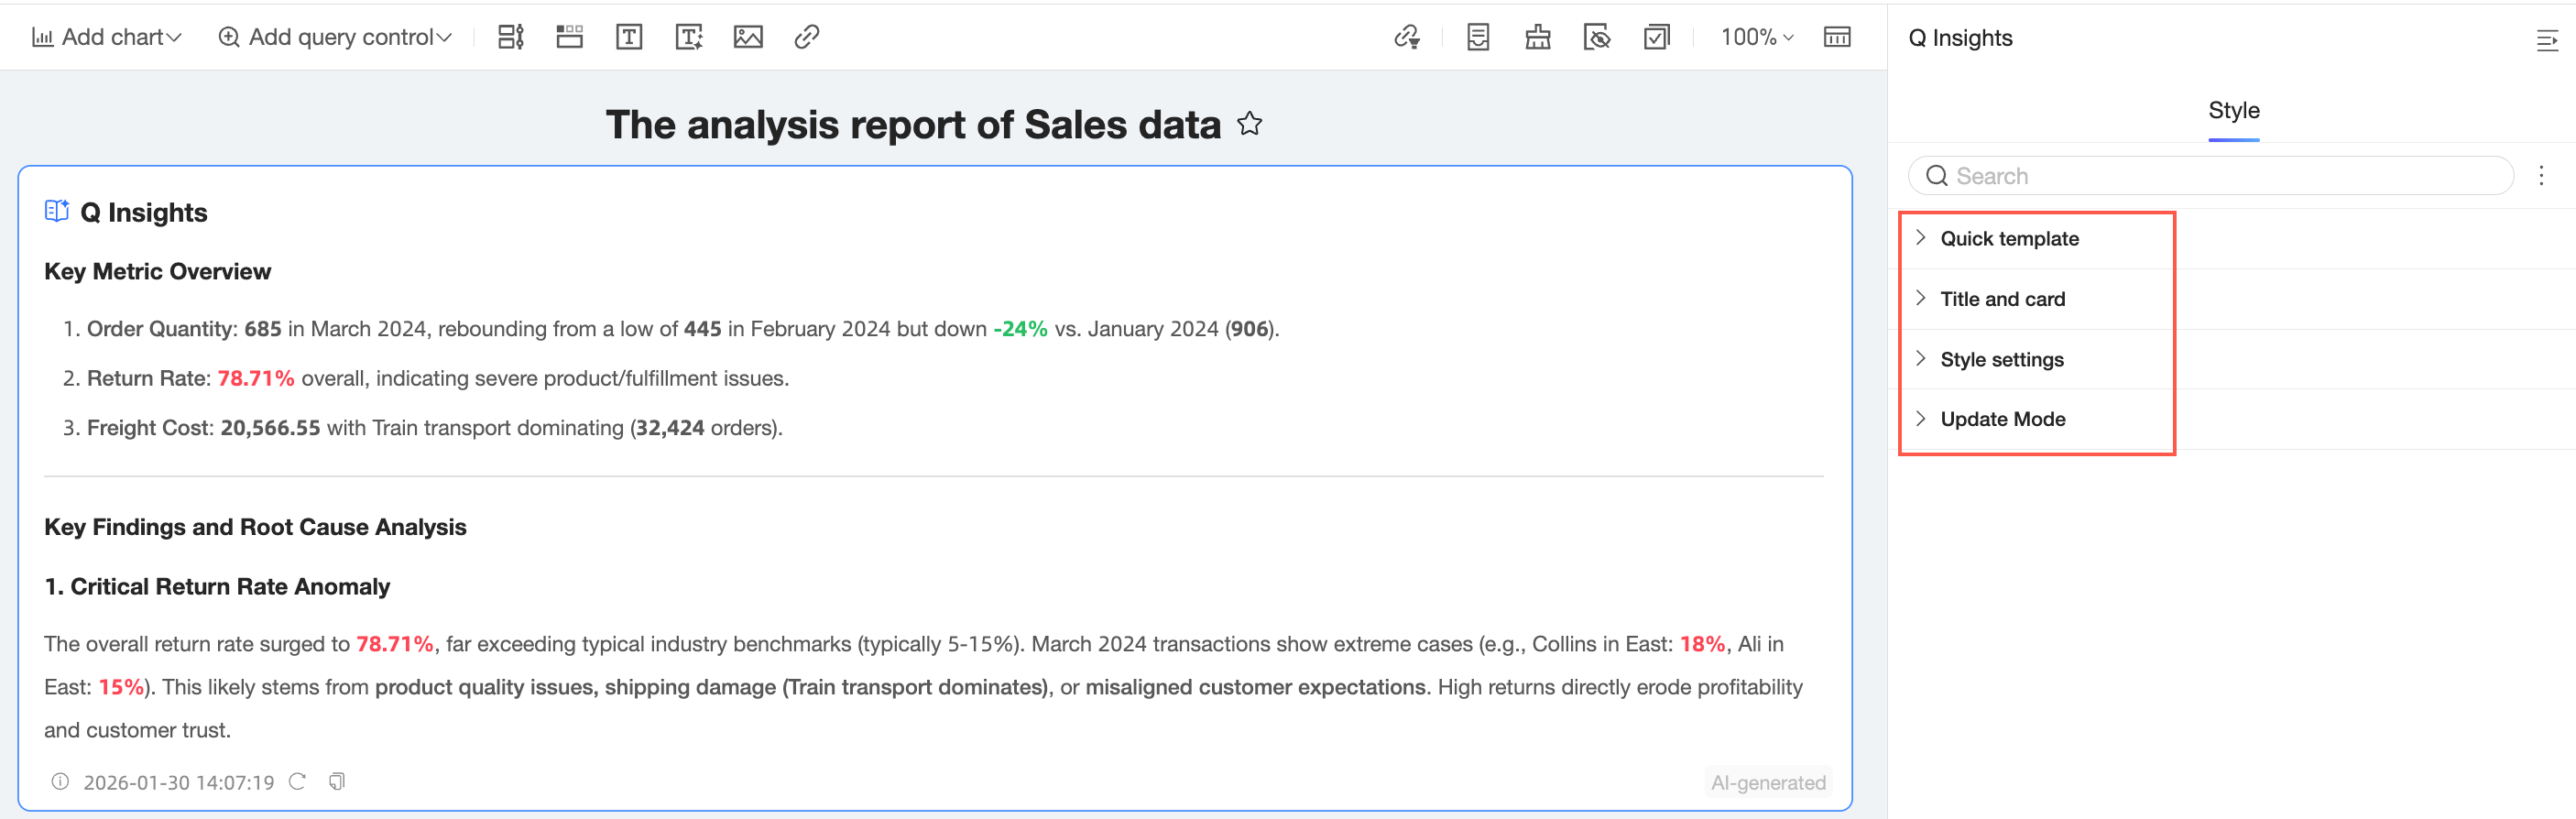
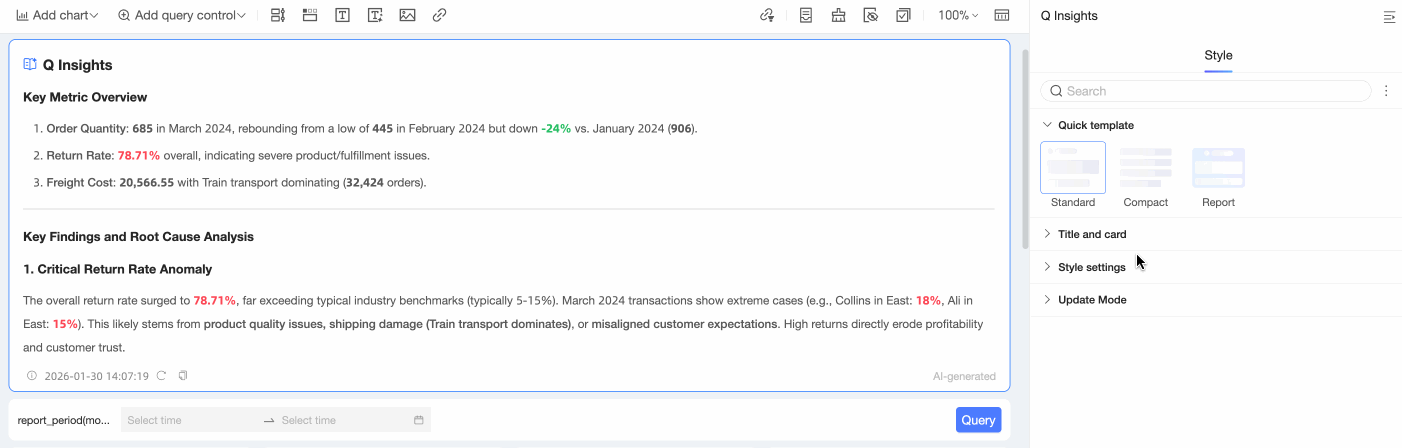
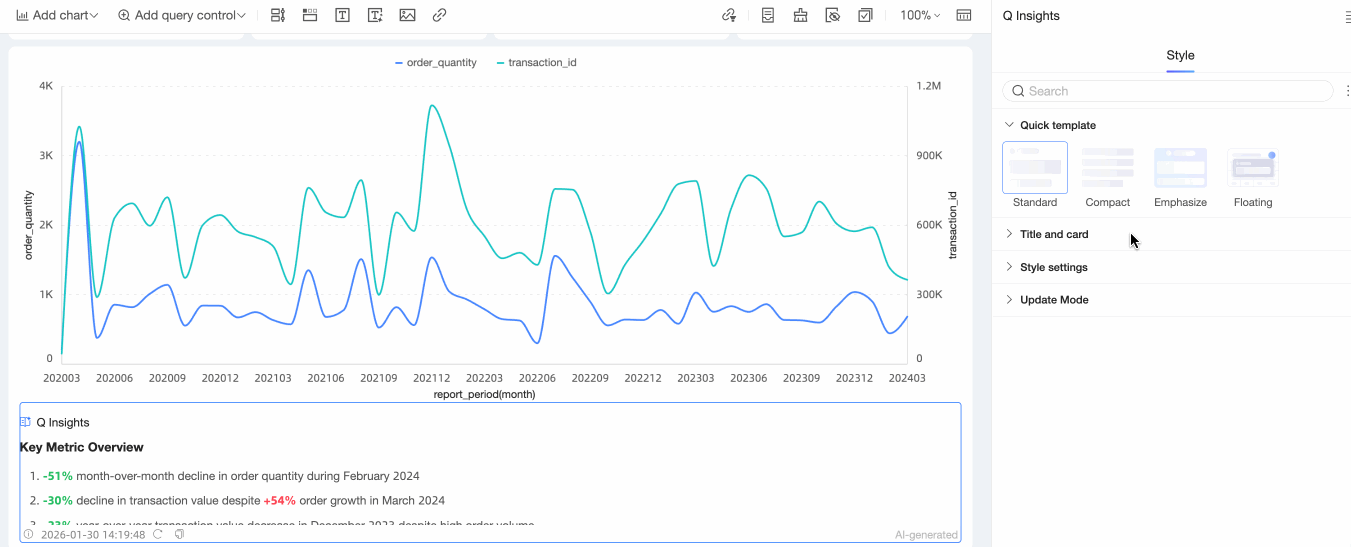
Quick templates
Global interpretation components and single chart interpretation components have different templates.
A global interpretation component supports the Standard, Compact, and Report templates.
A single chart interpretation component supports the Standard, Compact, Emphasis, and Right of title templates.
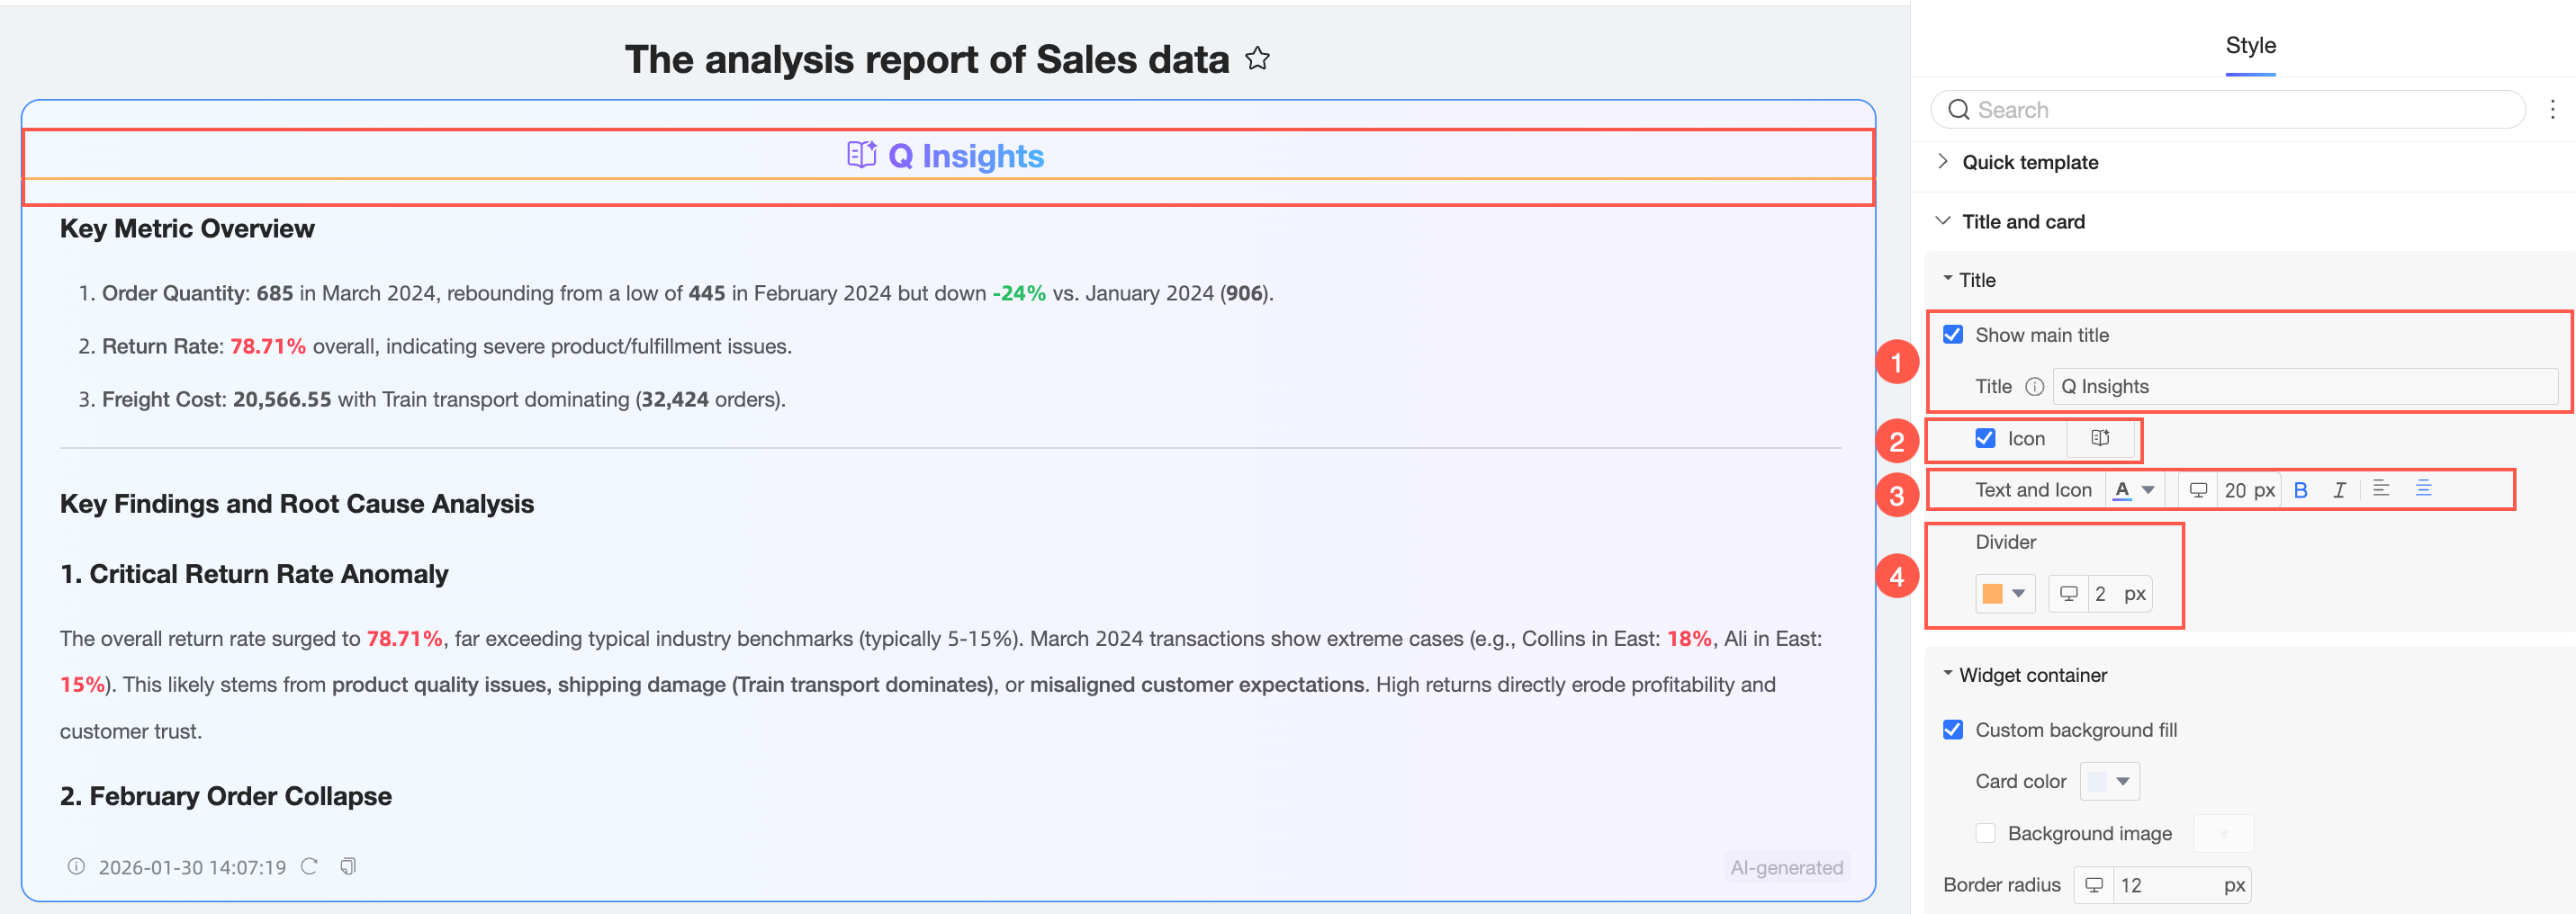
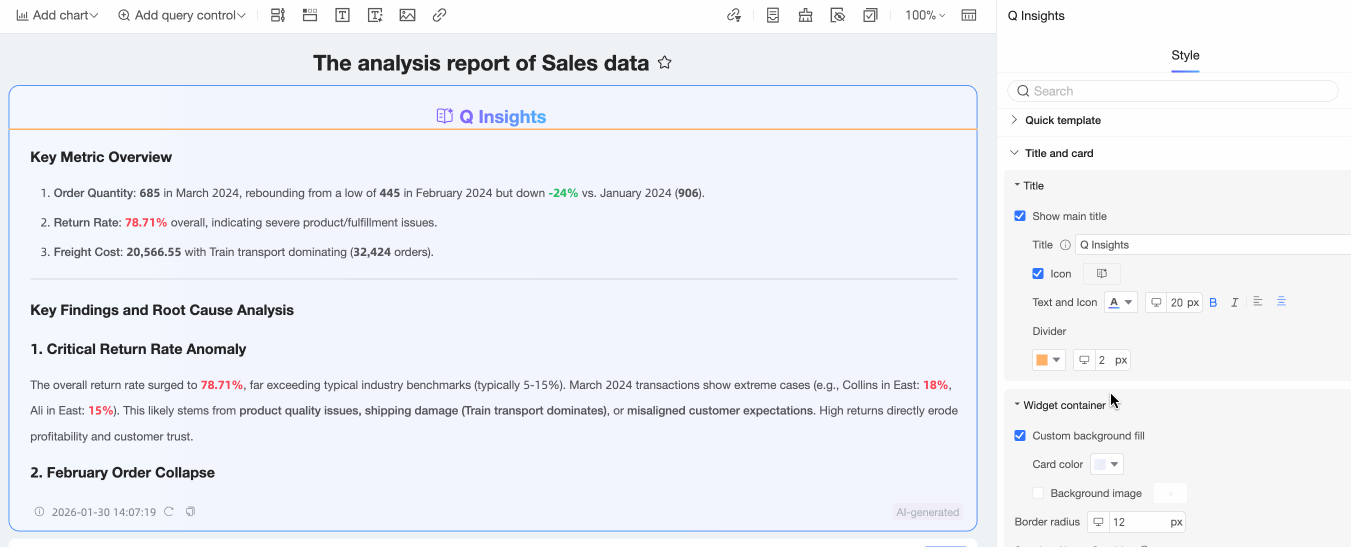
Title and card
In the Title and Card section, configure the Title and Component container.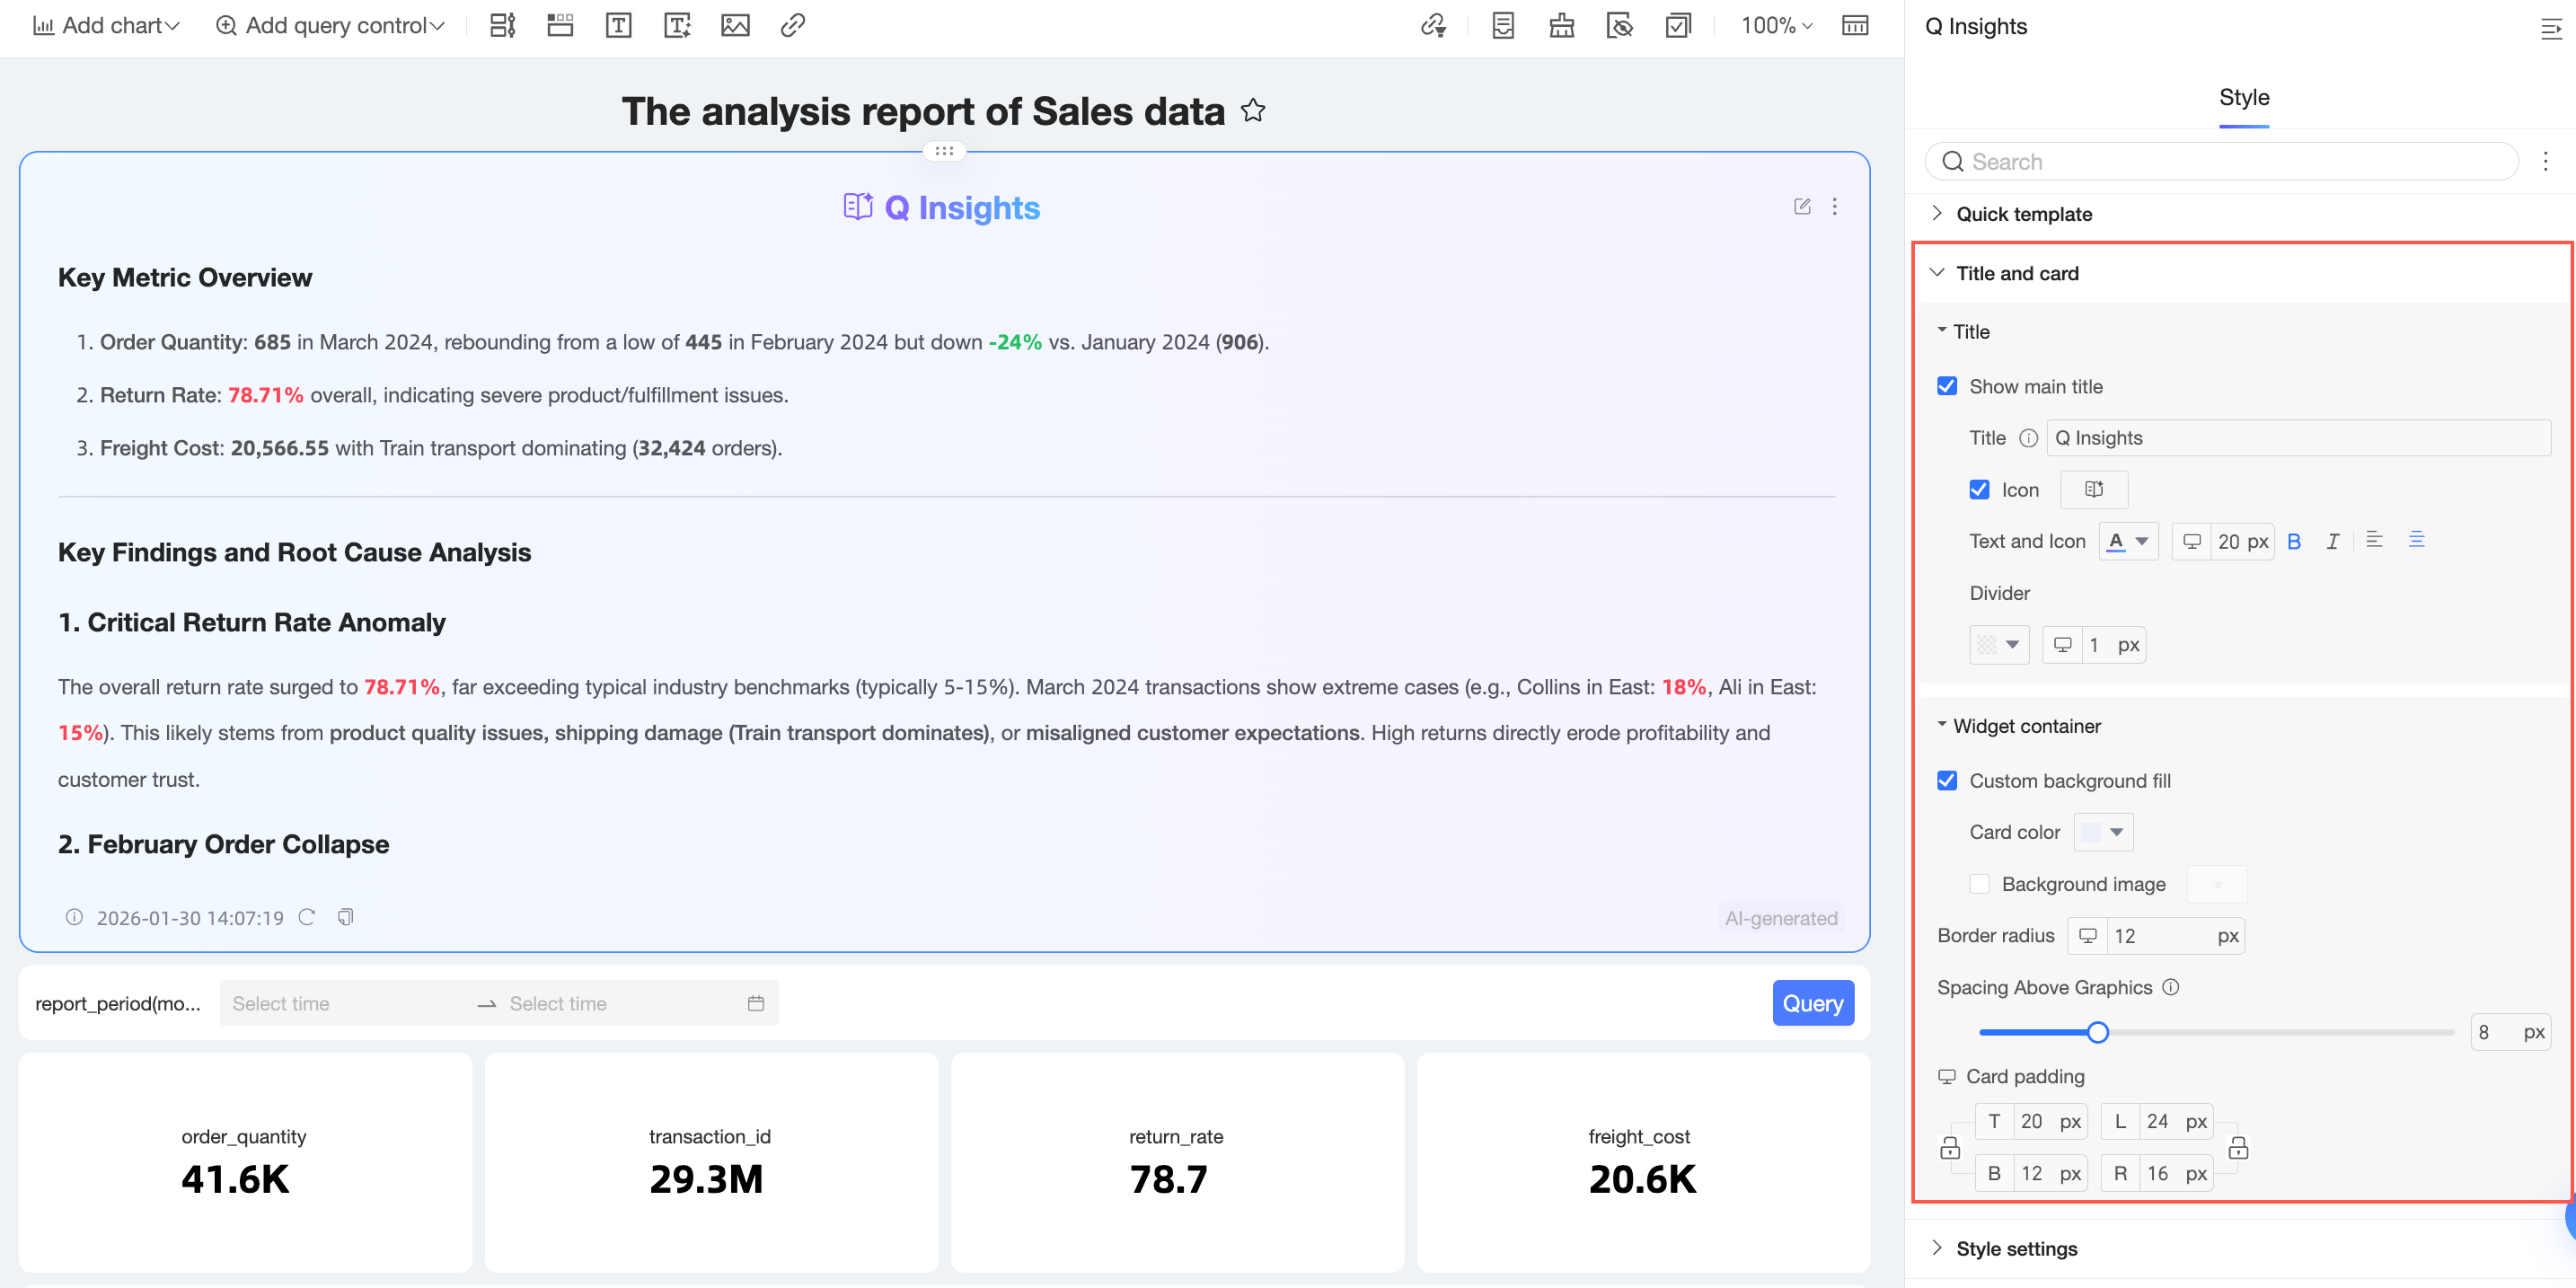
In the Title section, you can enable the Main title, configure the style of the title and icon, and set whether to show the icon.
Enable Show main title to configure the Title, Text and icon, and Divider.
① Title: Enter a title for the interpretation component, for example: Overall Interpretation of Regional Sales Data.
② Icon: Show or hide the icon and set its shape and color.
You can Use assets or upload a Custom image.
When you Use assets, you can use Custom color settings.
When you select Custom image, you can choose to Upload a local image or Upload by image link.
NoteOnly JPG, JPEG, PNG, GIF, and SVG images are supported. The maximum file size is 20 MB.
③ Text and icon: Set the style for the component title and icon.
④ Divider: Set the color and thickness of the divider line.
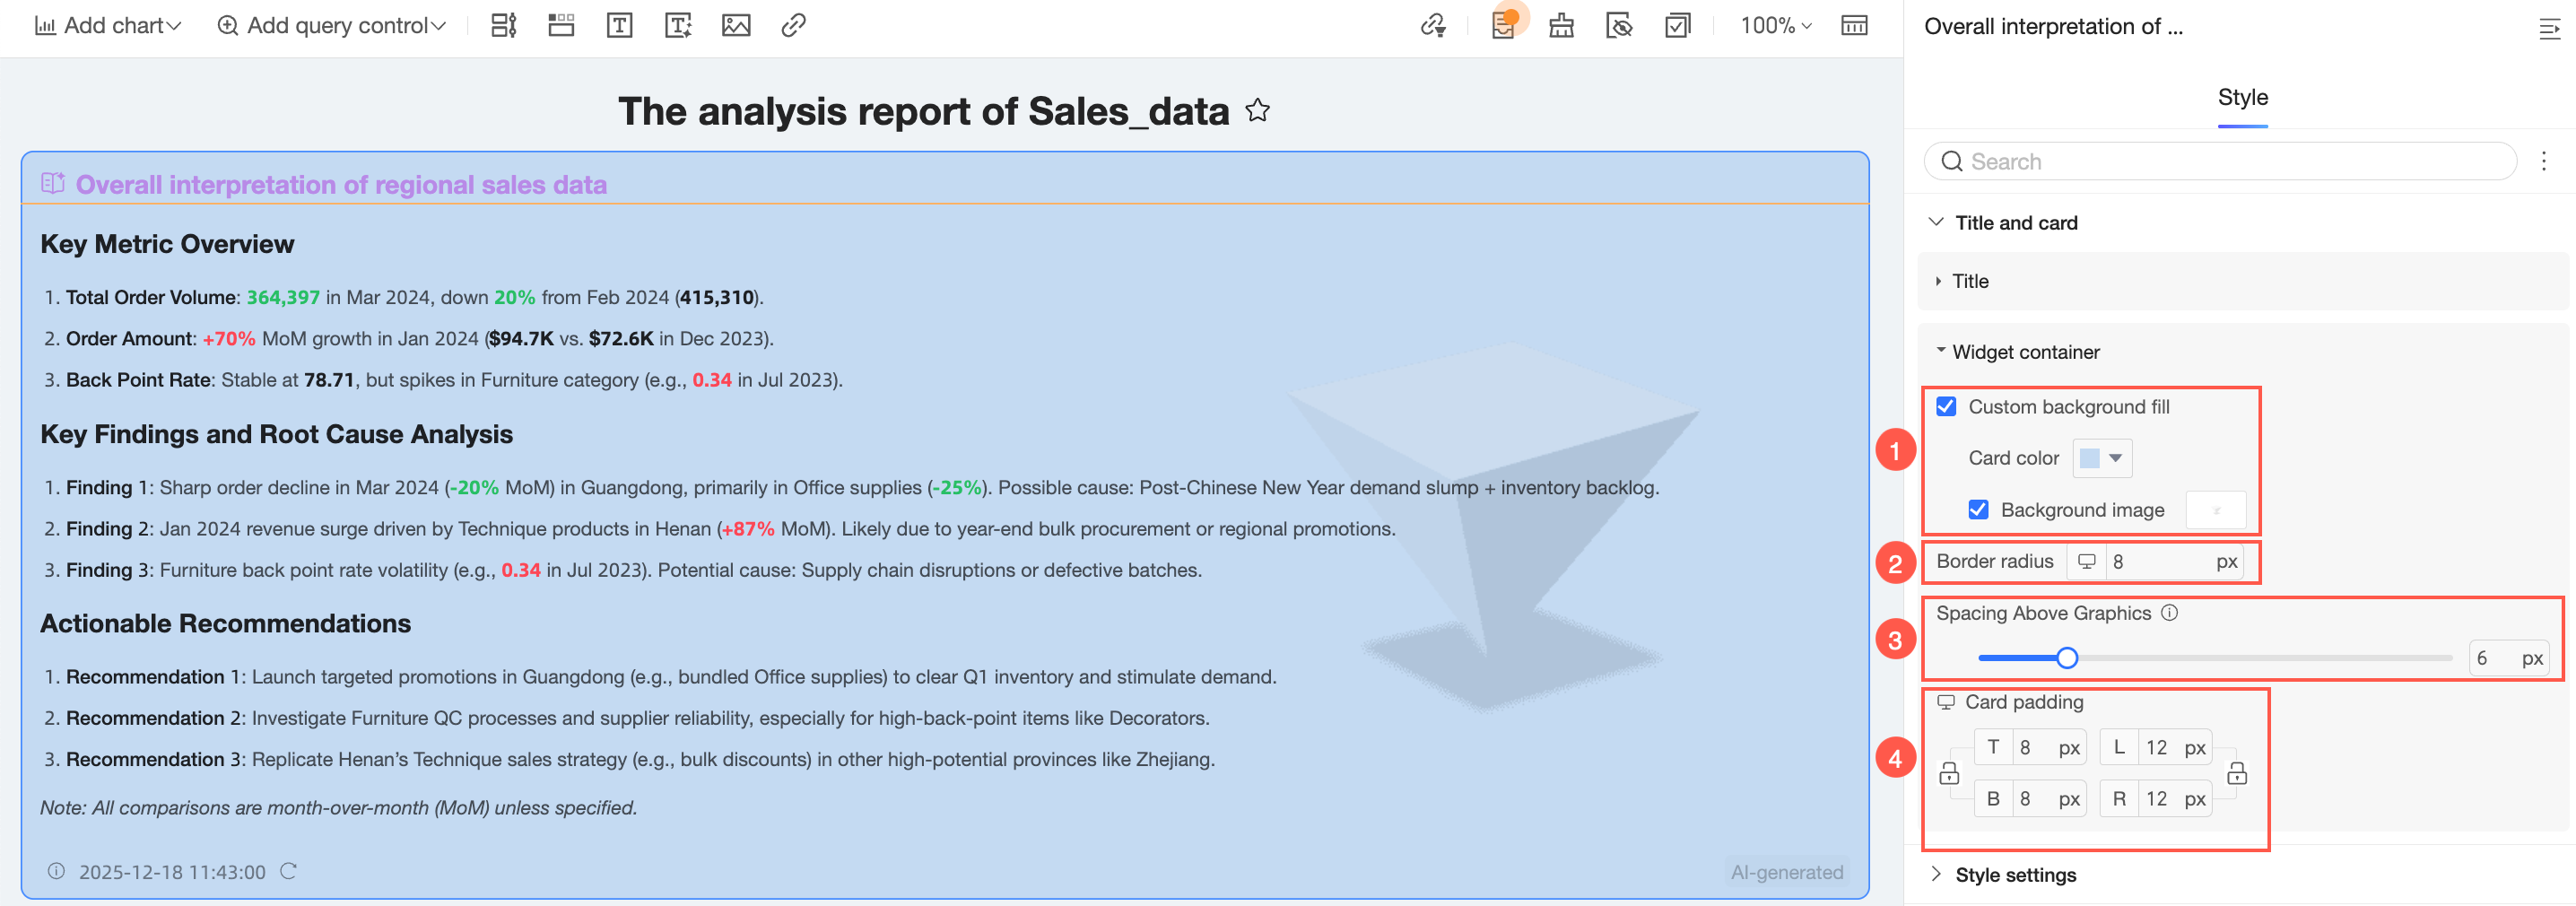
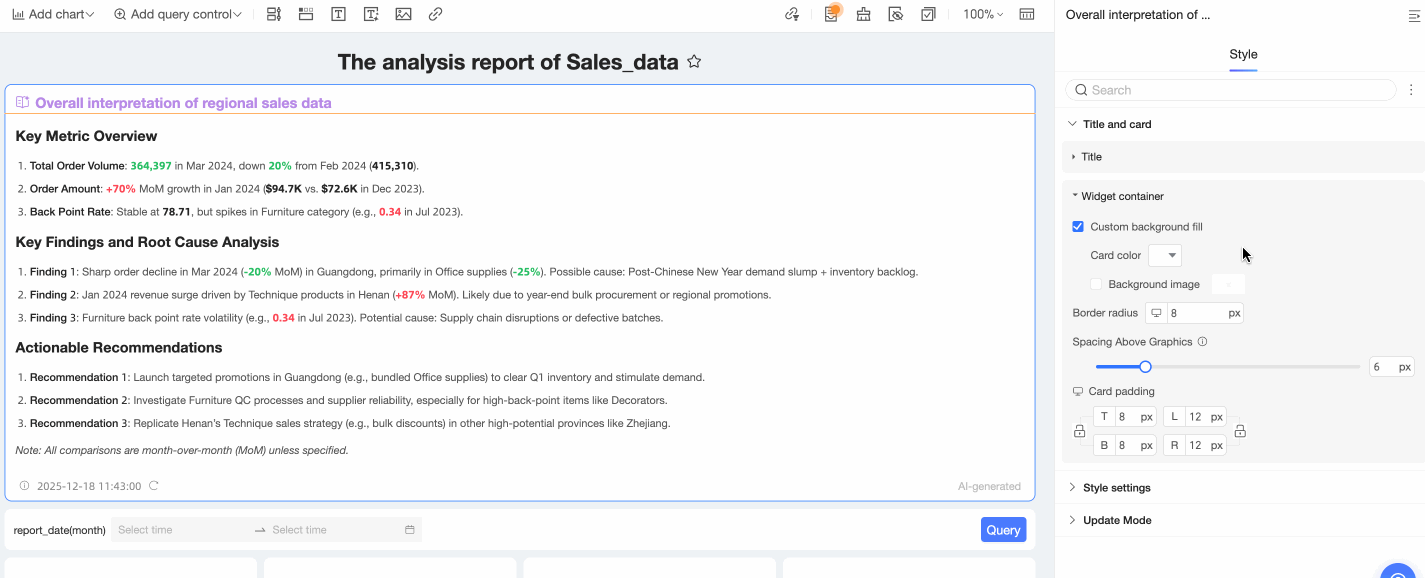
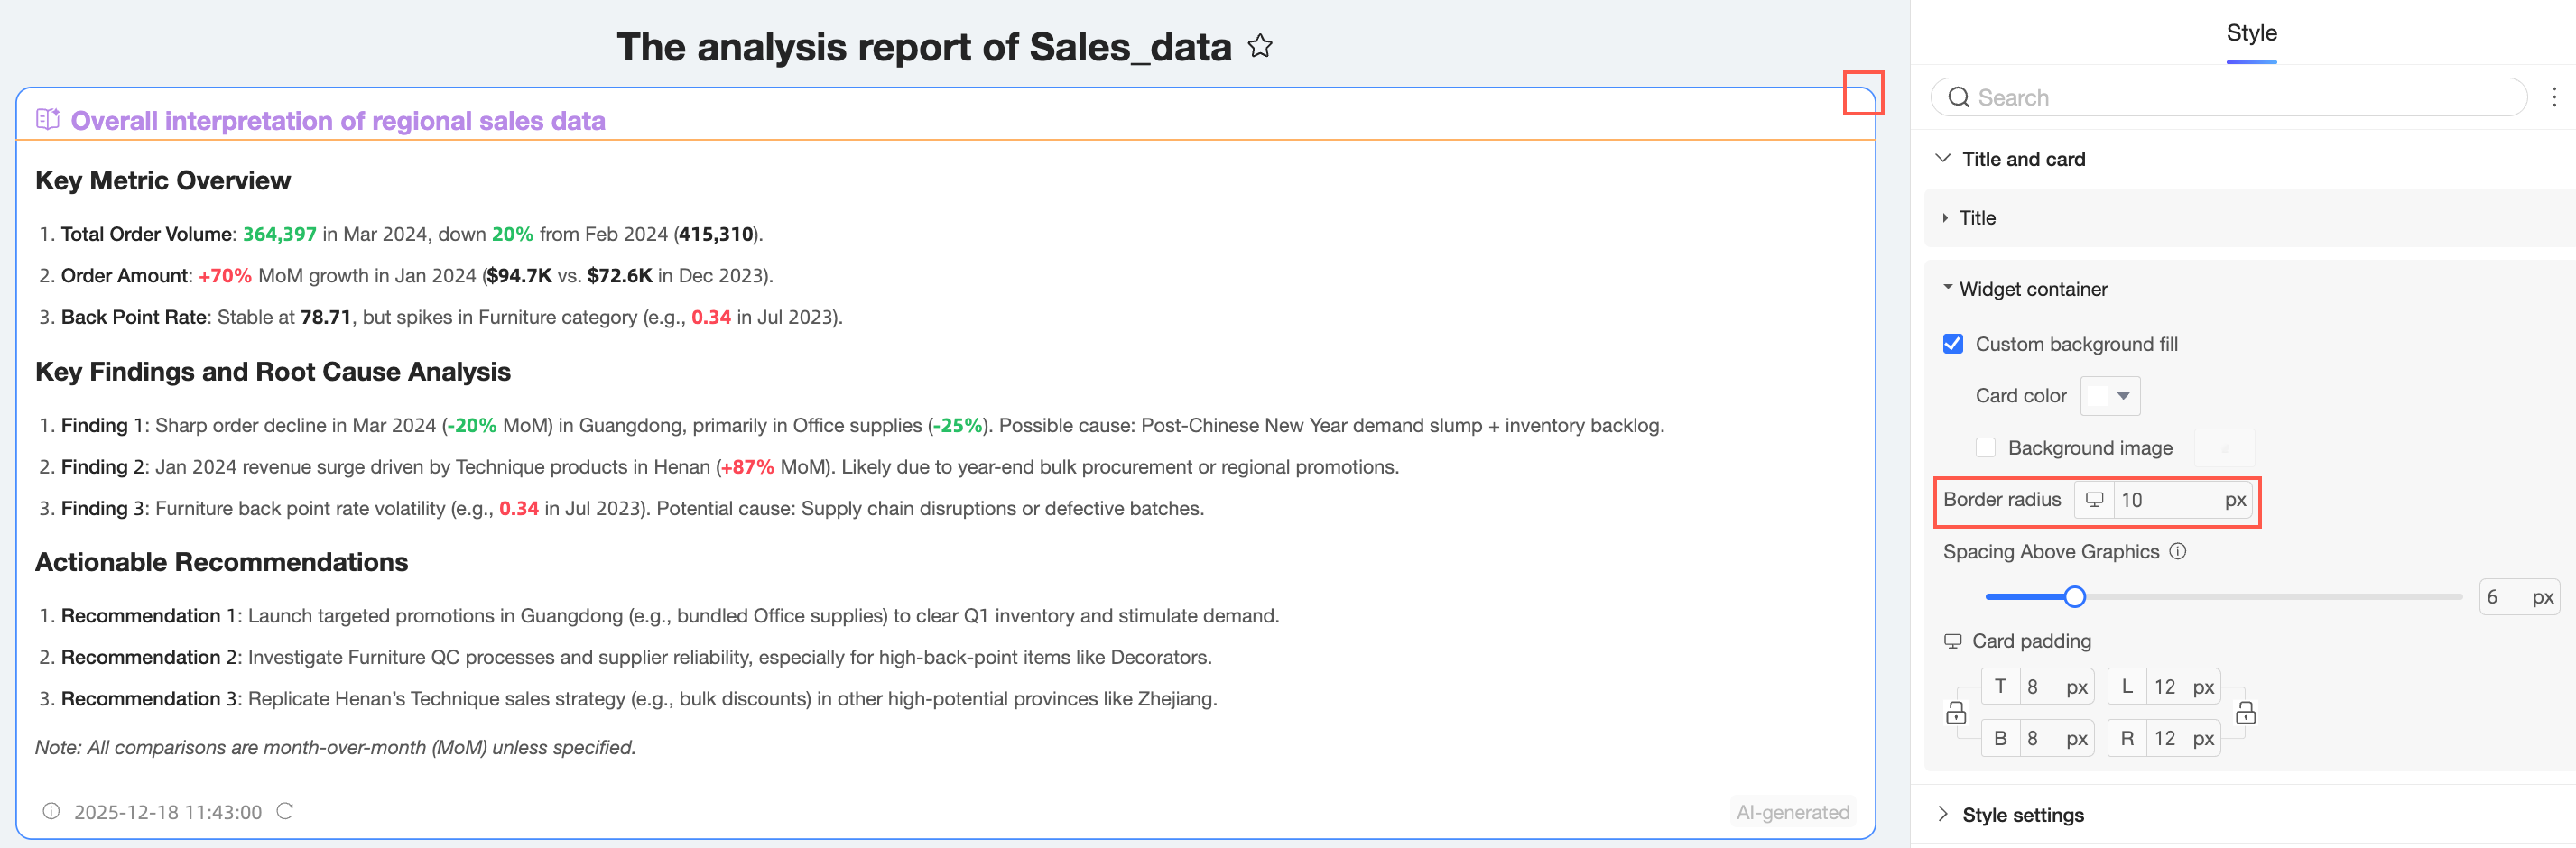
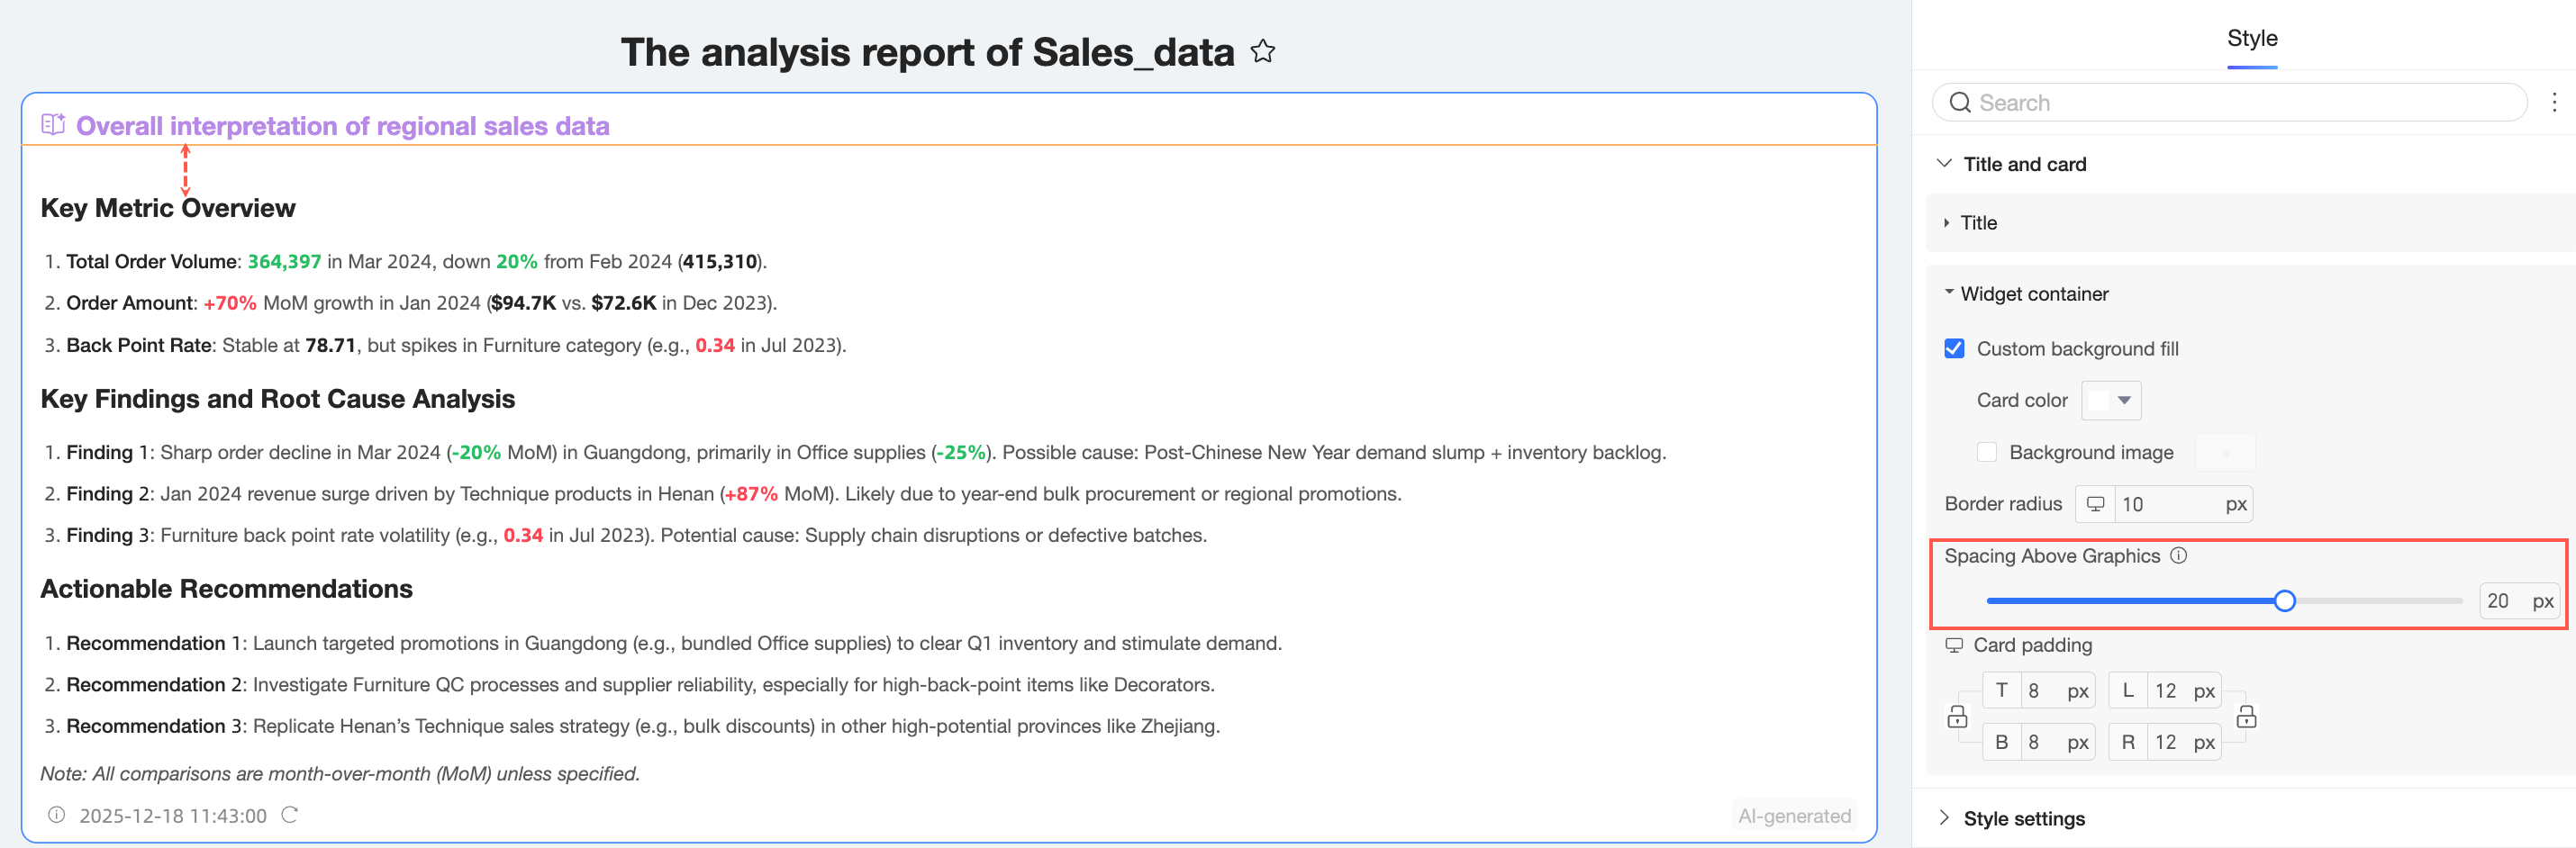
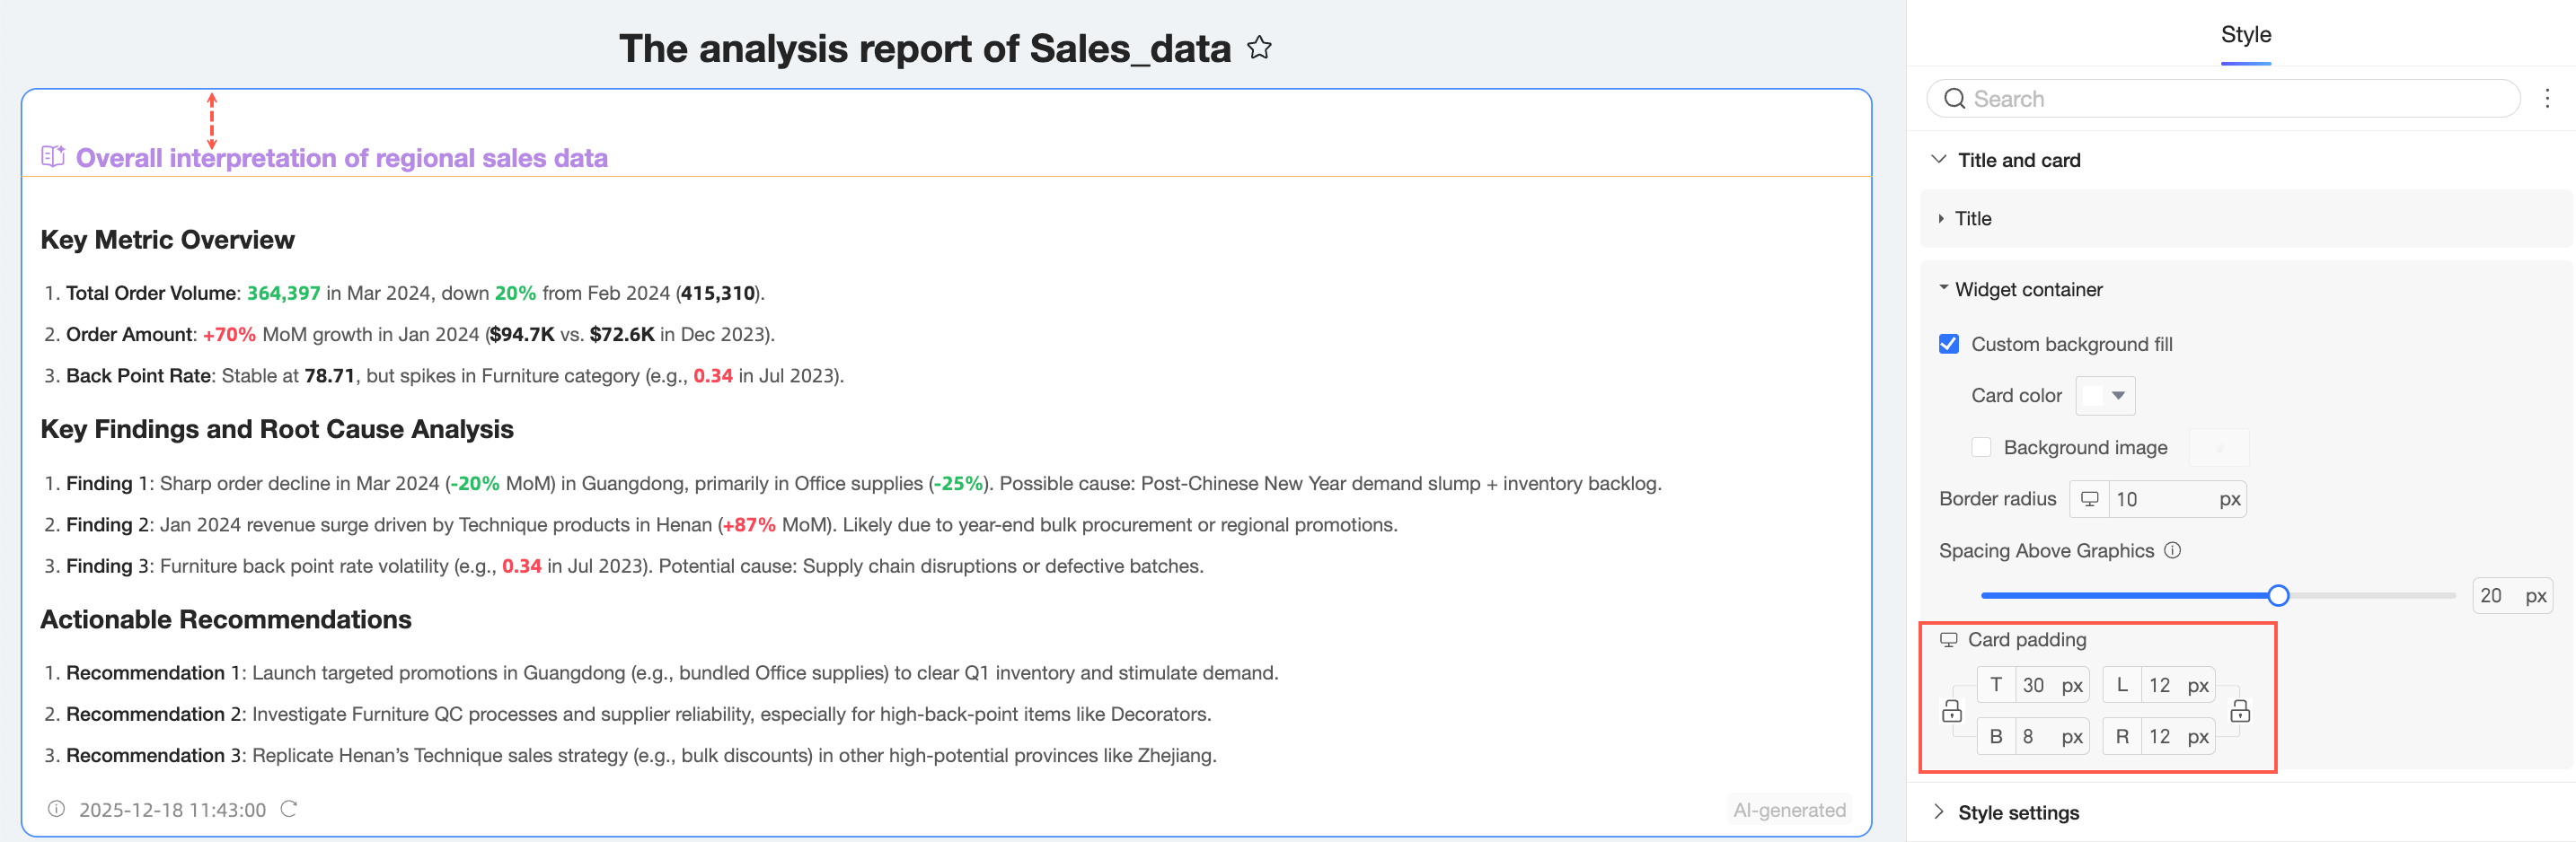
In the Component container section, configure the Custom background fill (①), corner radius (②), spacing between top edge and chart area (③), and card padding (④).
① Custom background fill: Select Custom background fill to customize the background color and image style of the current interpretation component to match your company's branding. You can use system-provided images or upload your own.
② Corner radius: Set the corner radius value for the interpretation component.
③ Spacing between graphics area and top: The spacing between the non-chart area and the chart area.
④ Card padding: Sets the padding between the content and the card's border.
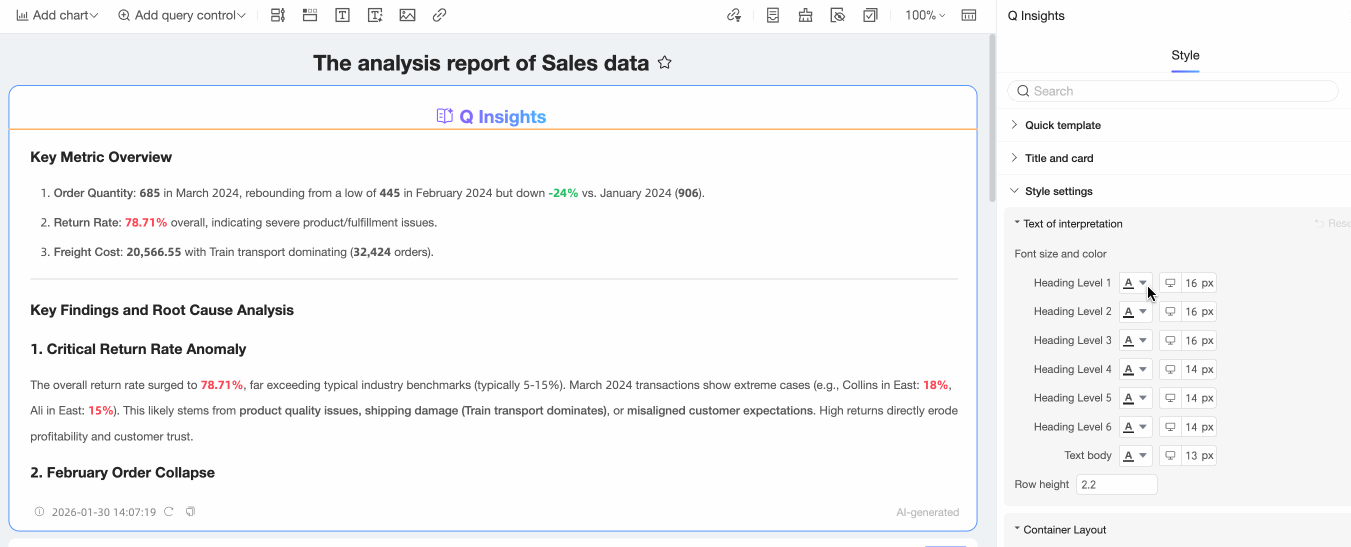
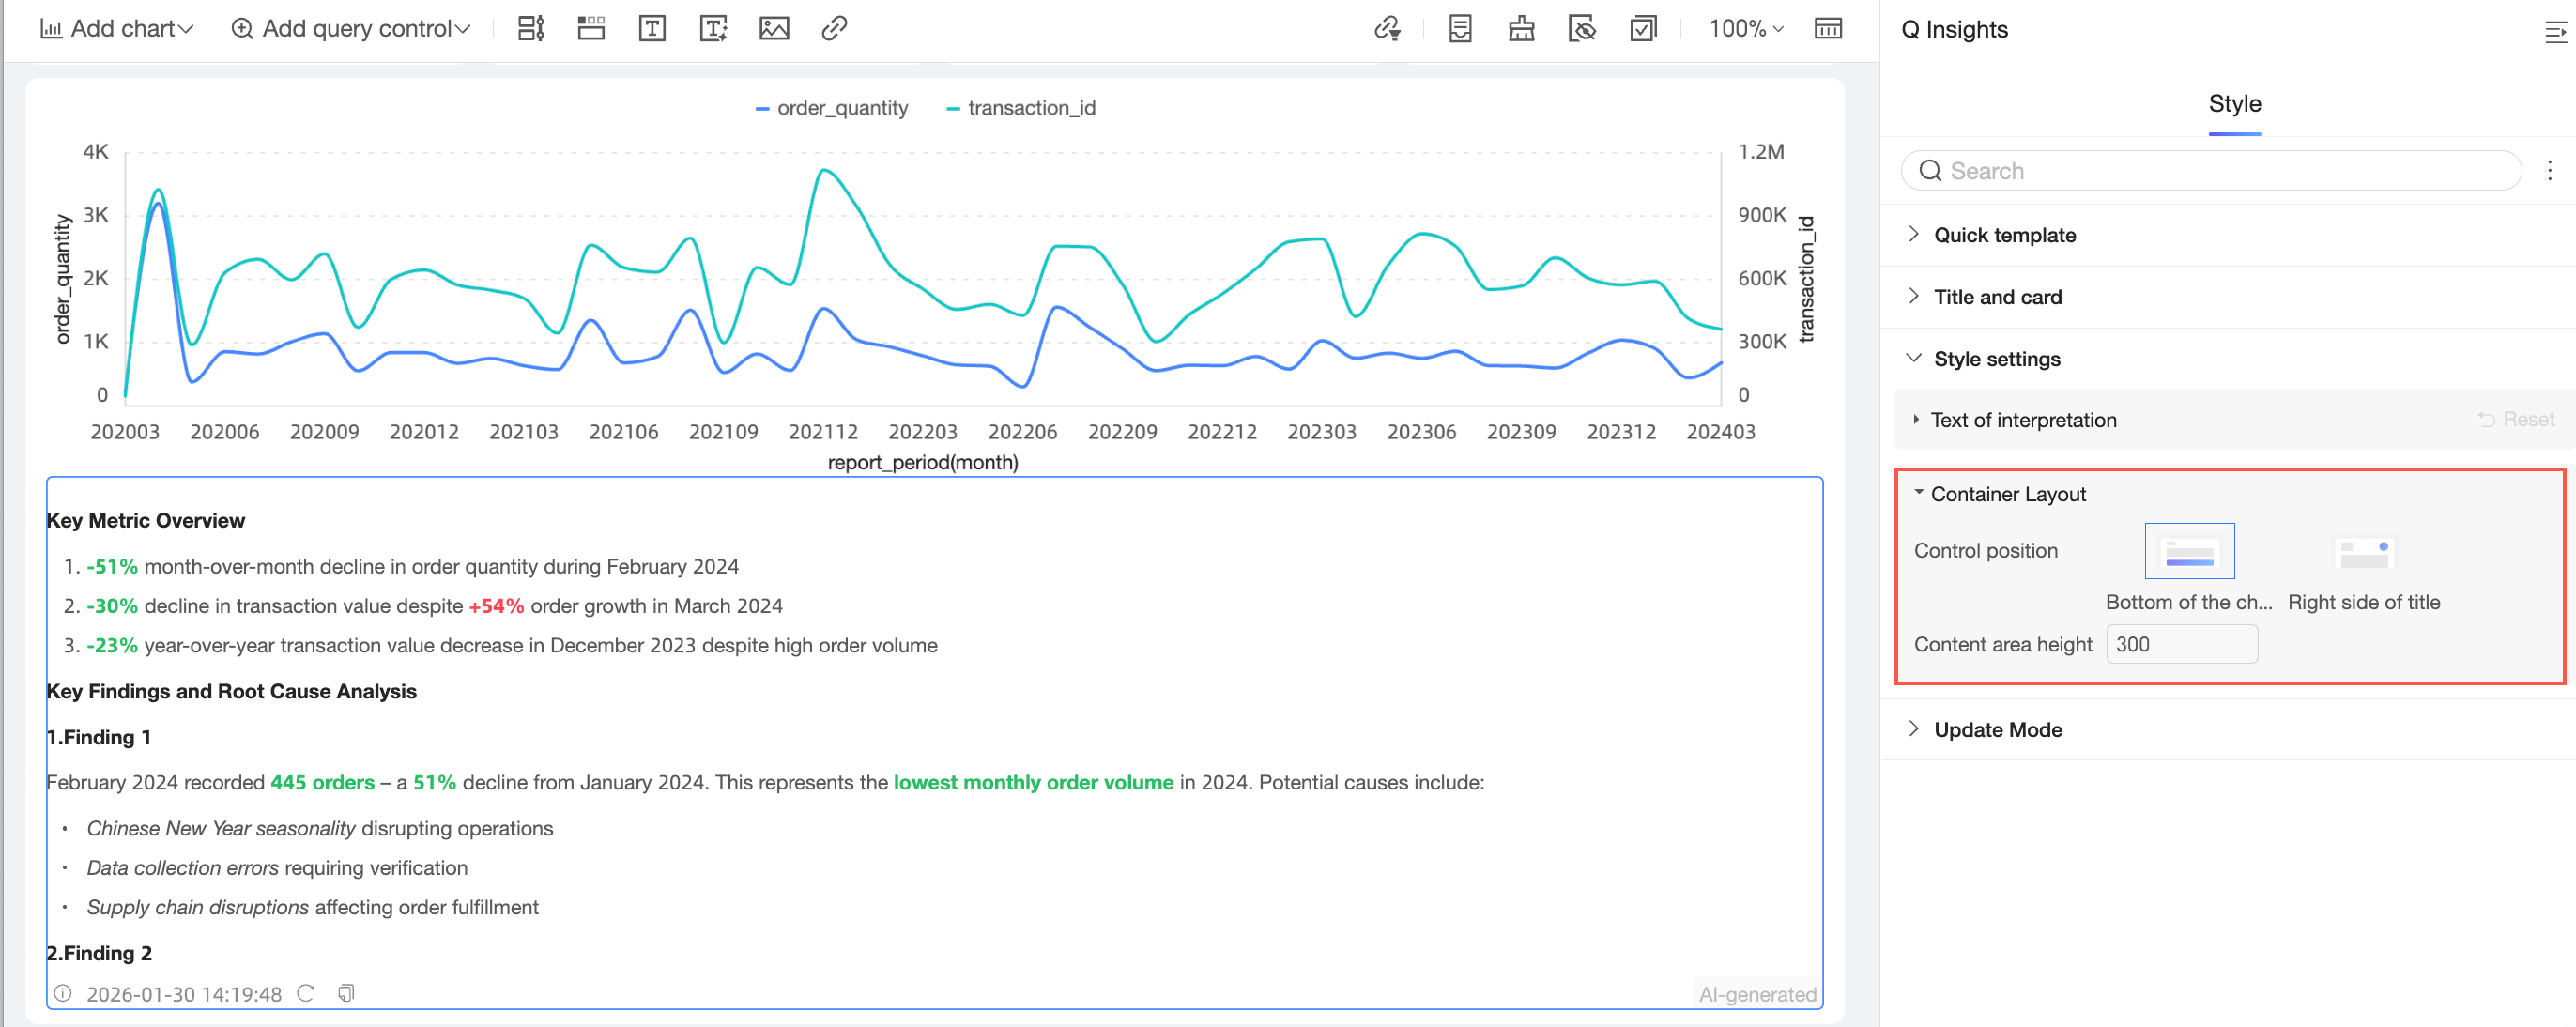
Style settings
In the Style settings section, configure the Font size, Color, line height, and Container layout for the interpretation text.
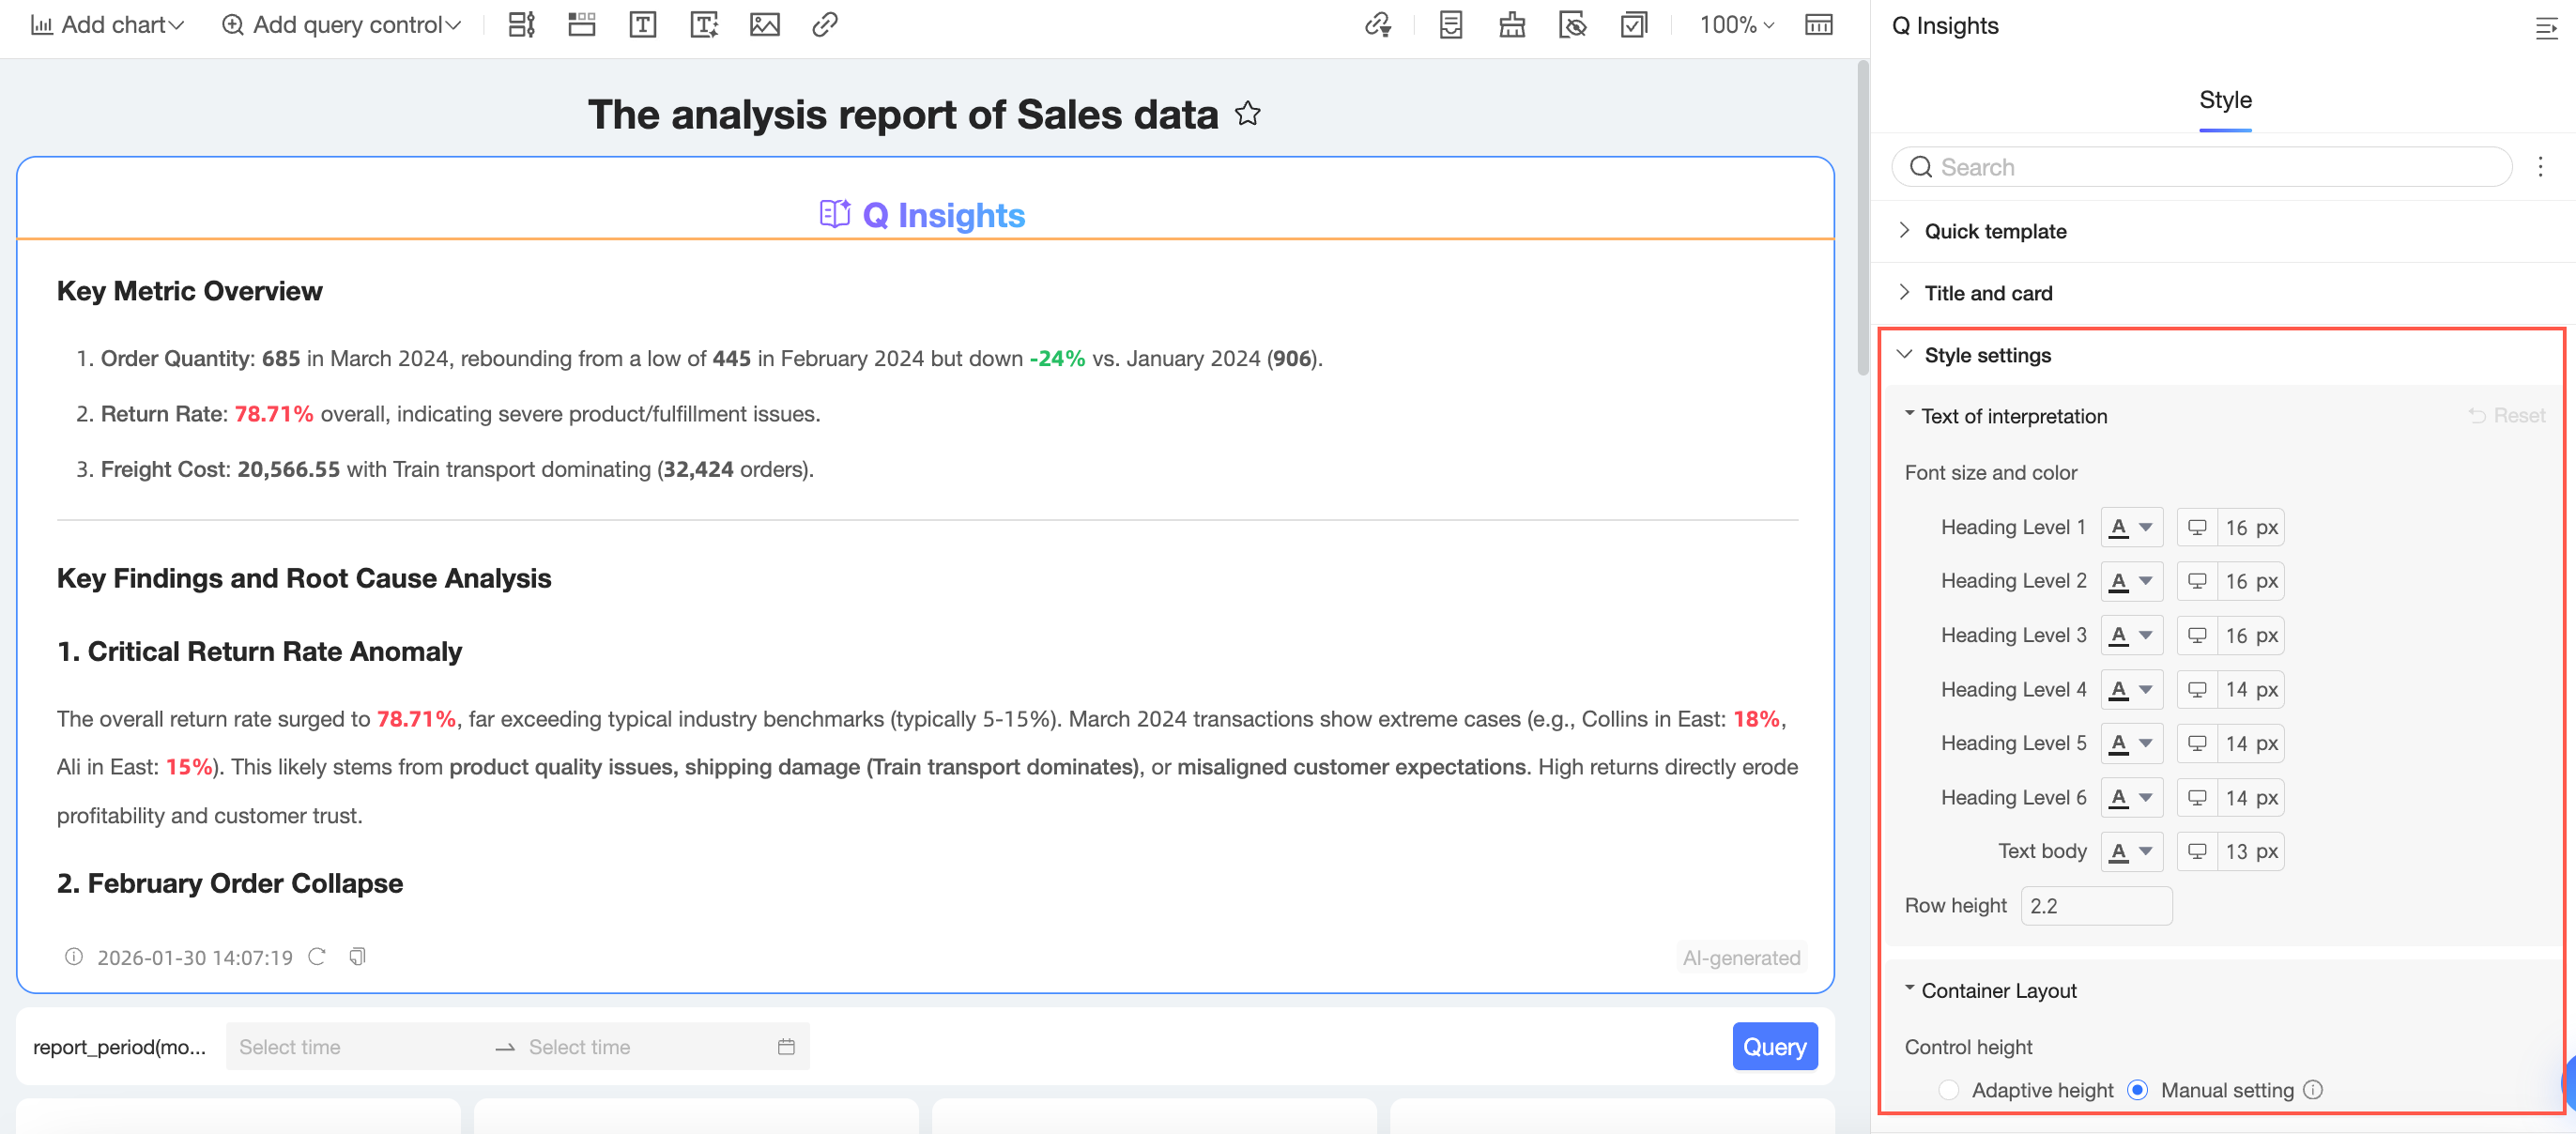
You can set the font size and color for the title and body text.
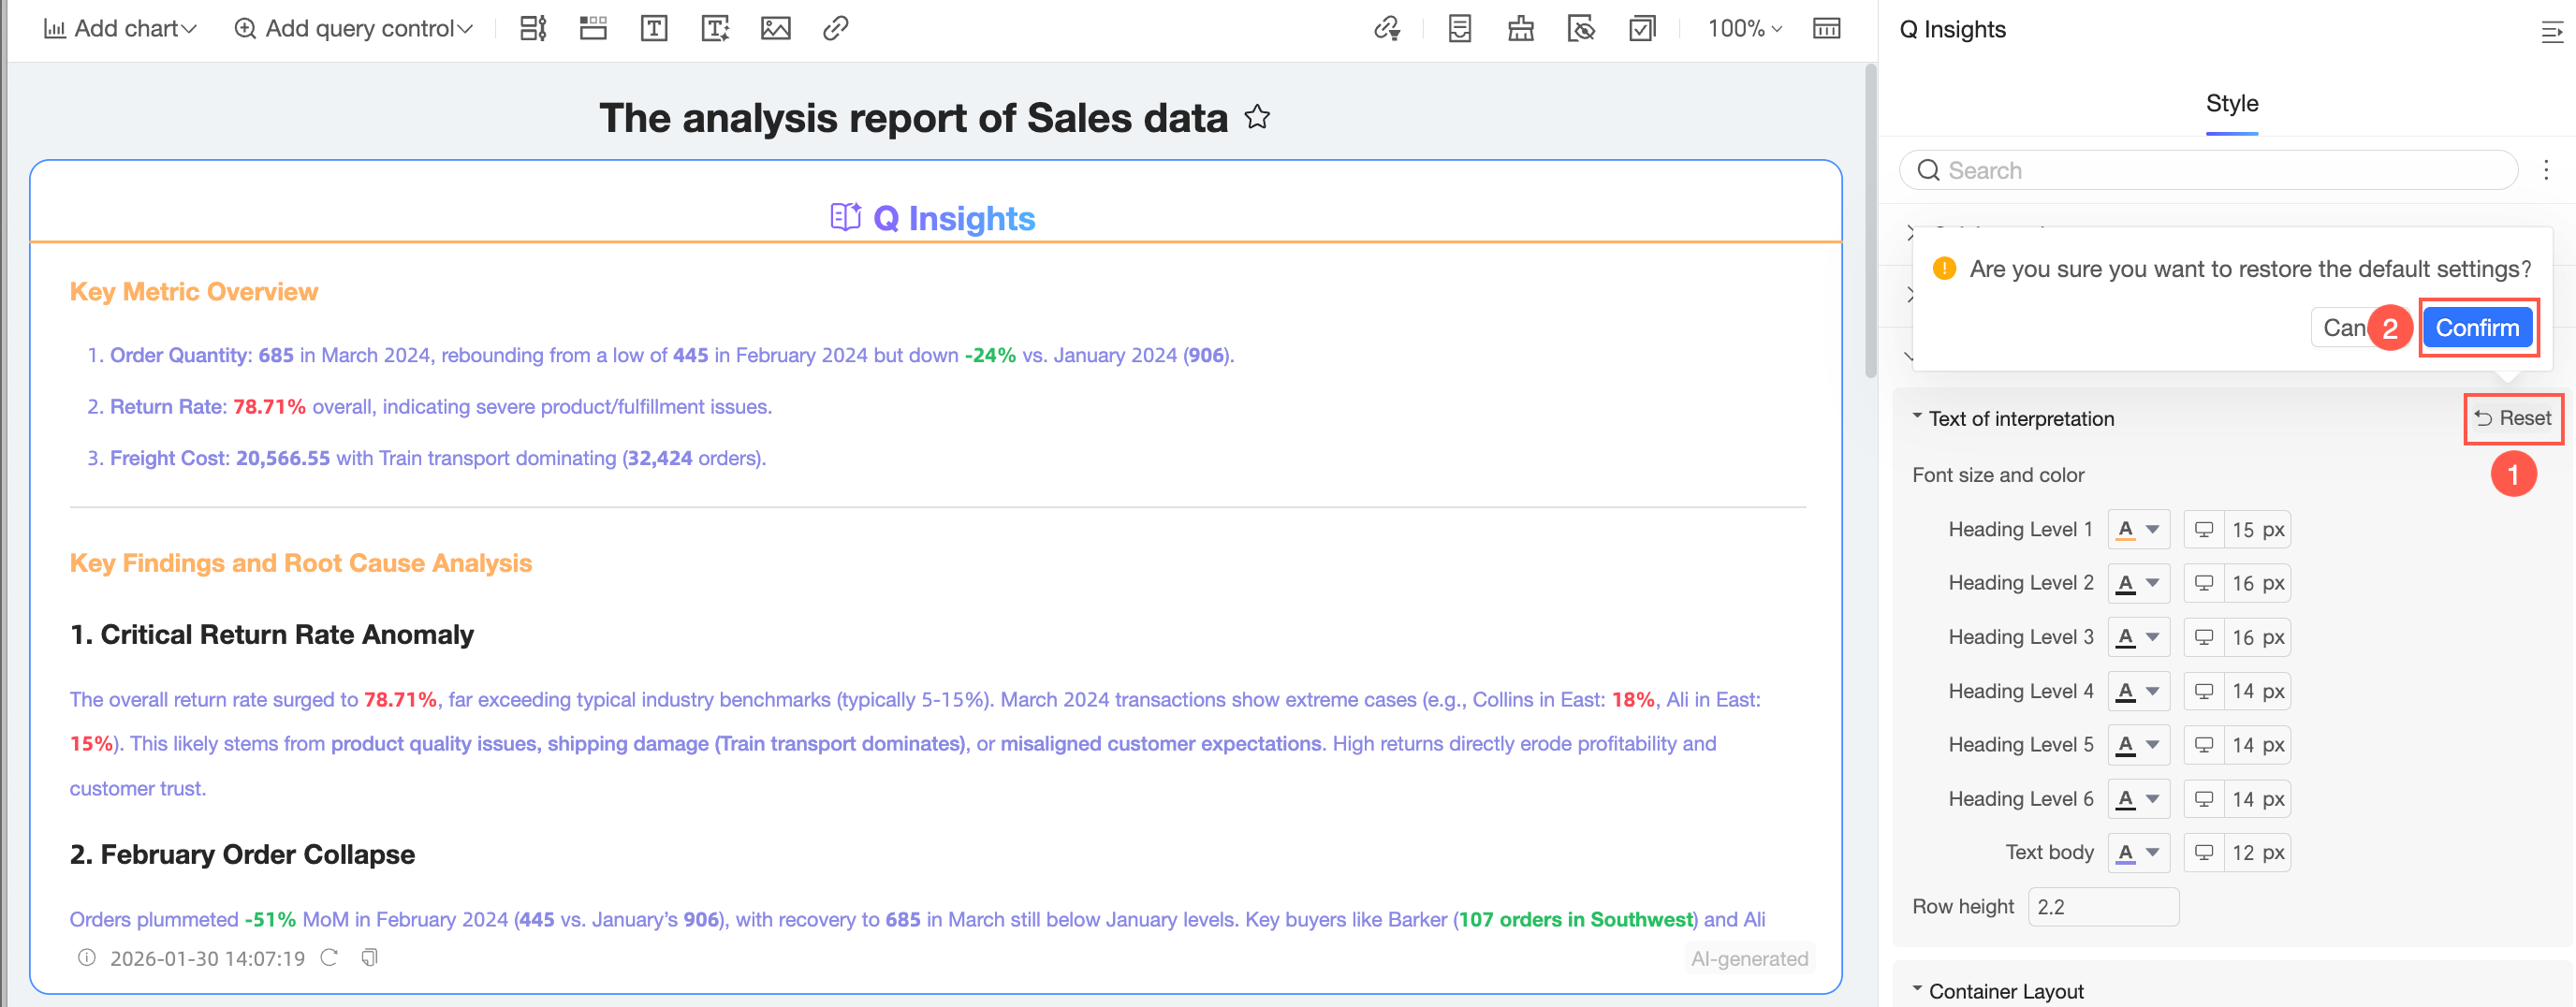
If you are not satisfied with the font size and color settings, you can click the Restore defaults button to revert to the default settings.
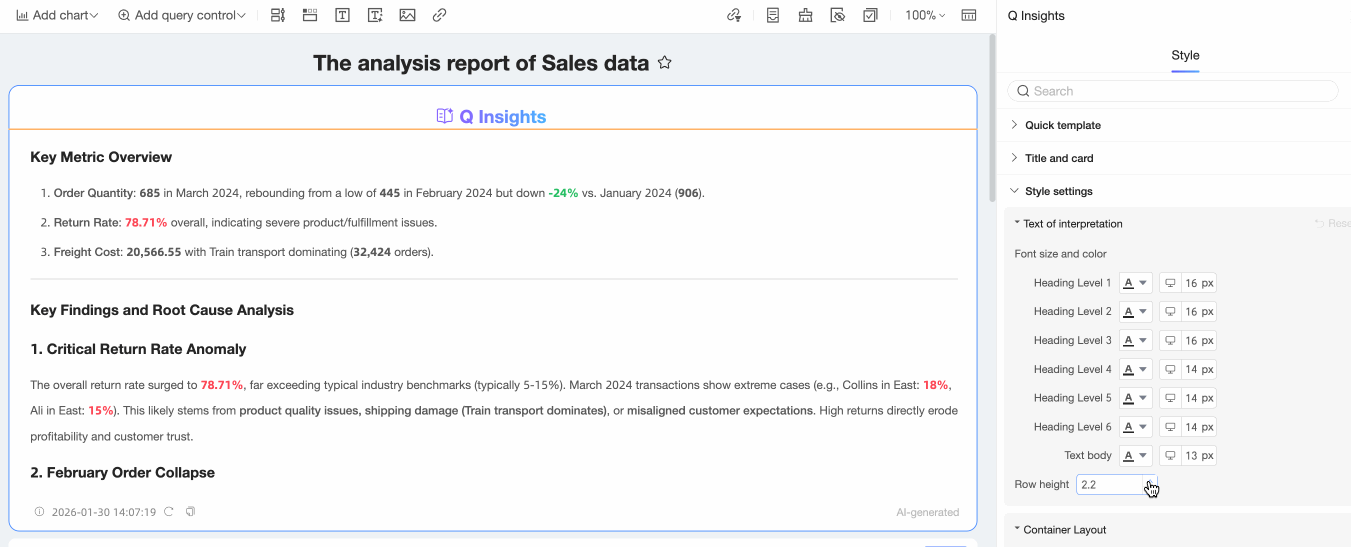
You can set the line height from 1.0 to 6.0.
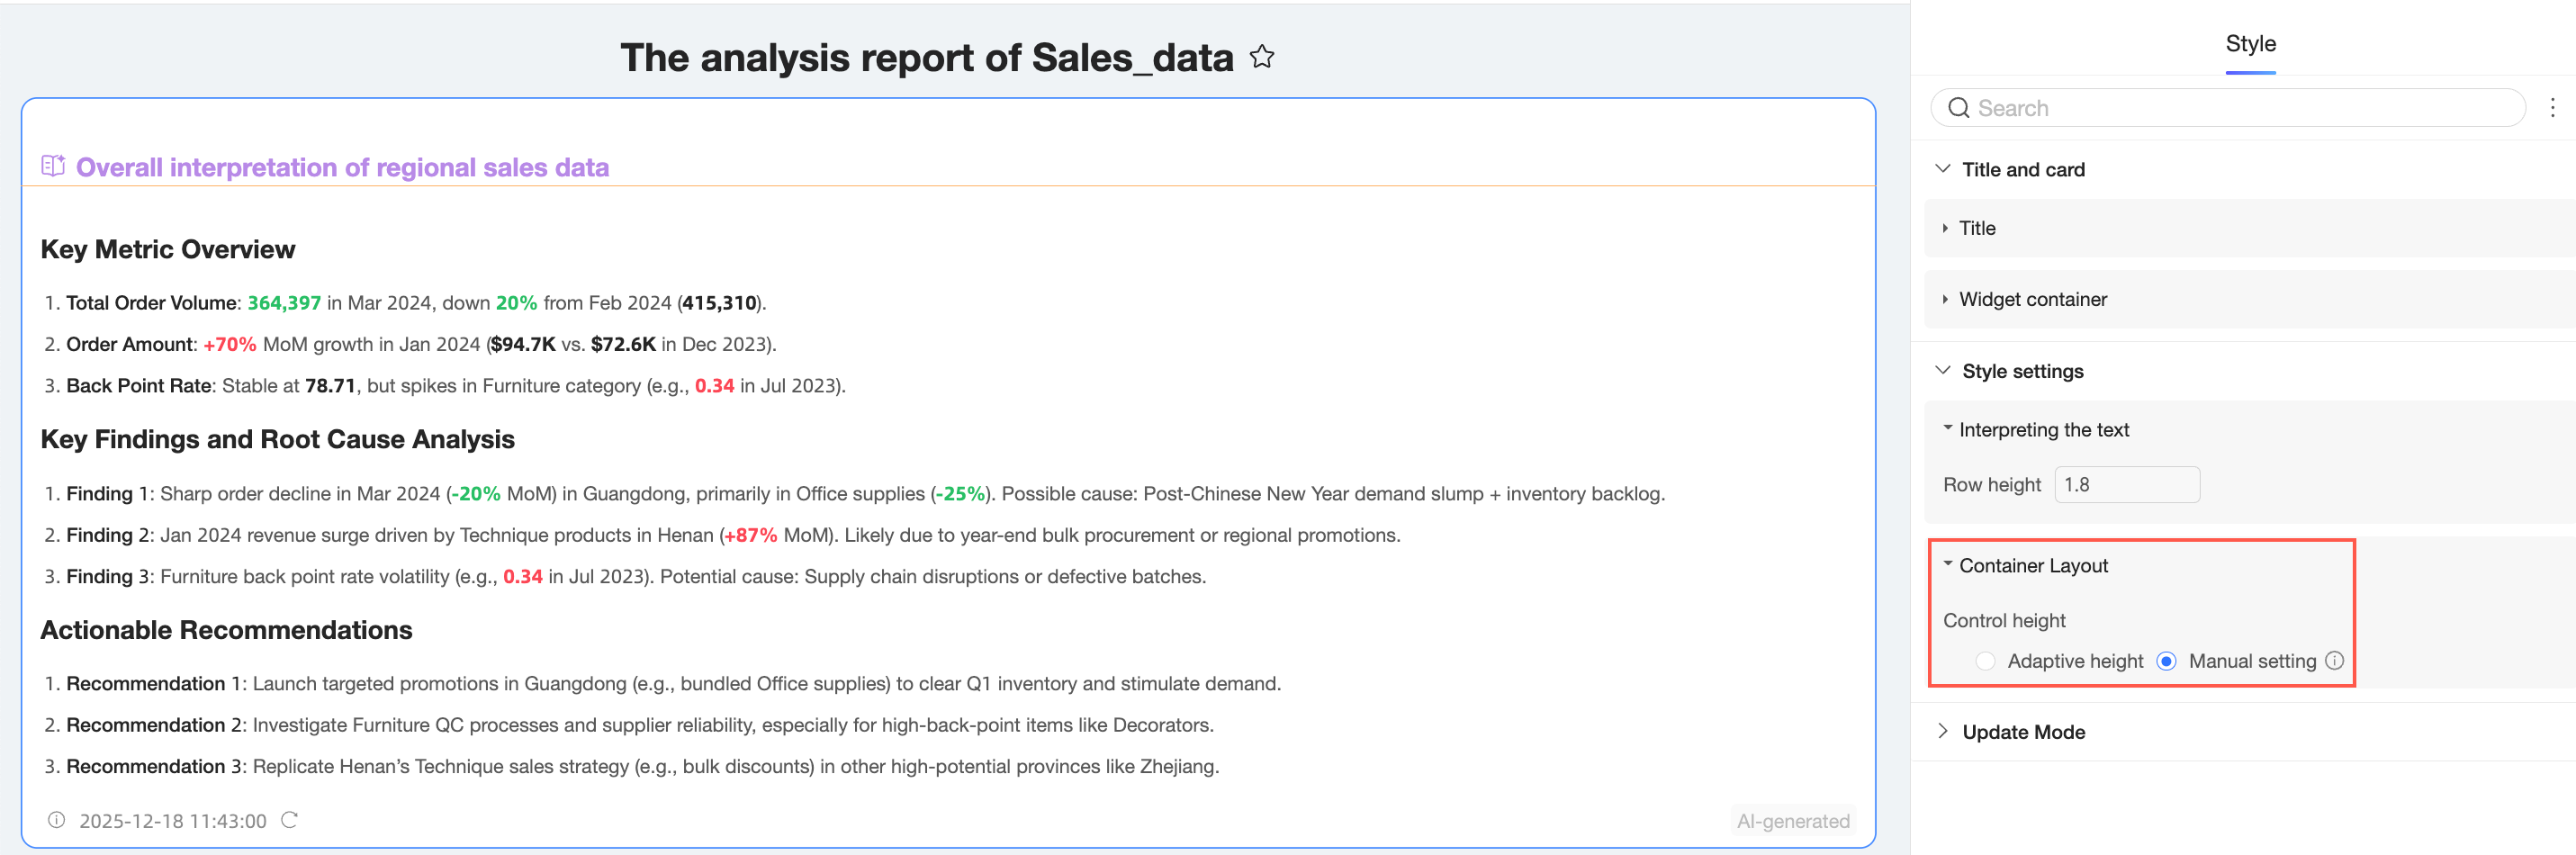
The container layout settings for a global interpretation component and a single chart interpretation component are different.
The Container layout for a global interpretation component supports Auto-fit height or Manual setting. The Manual setting supports drag-and-drop resizing. A vertical scrollbar appears if the content exceeds the set height.
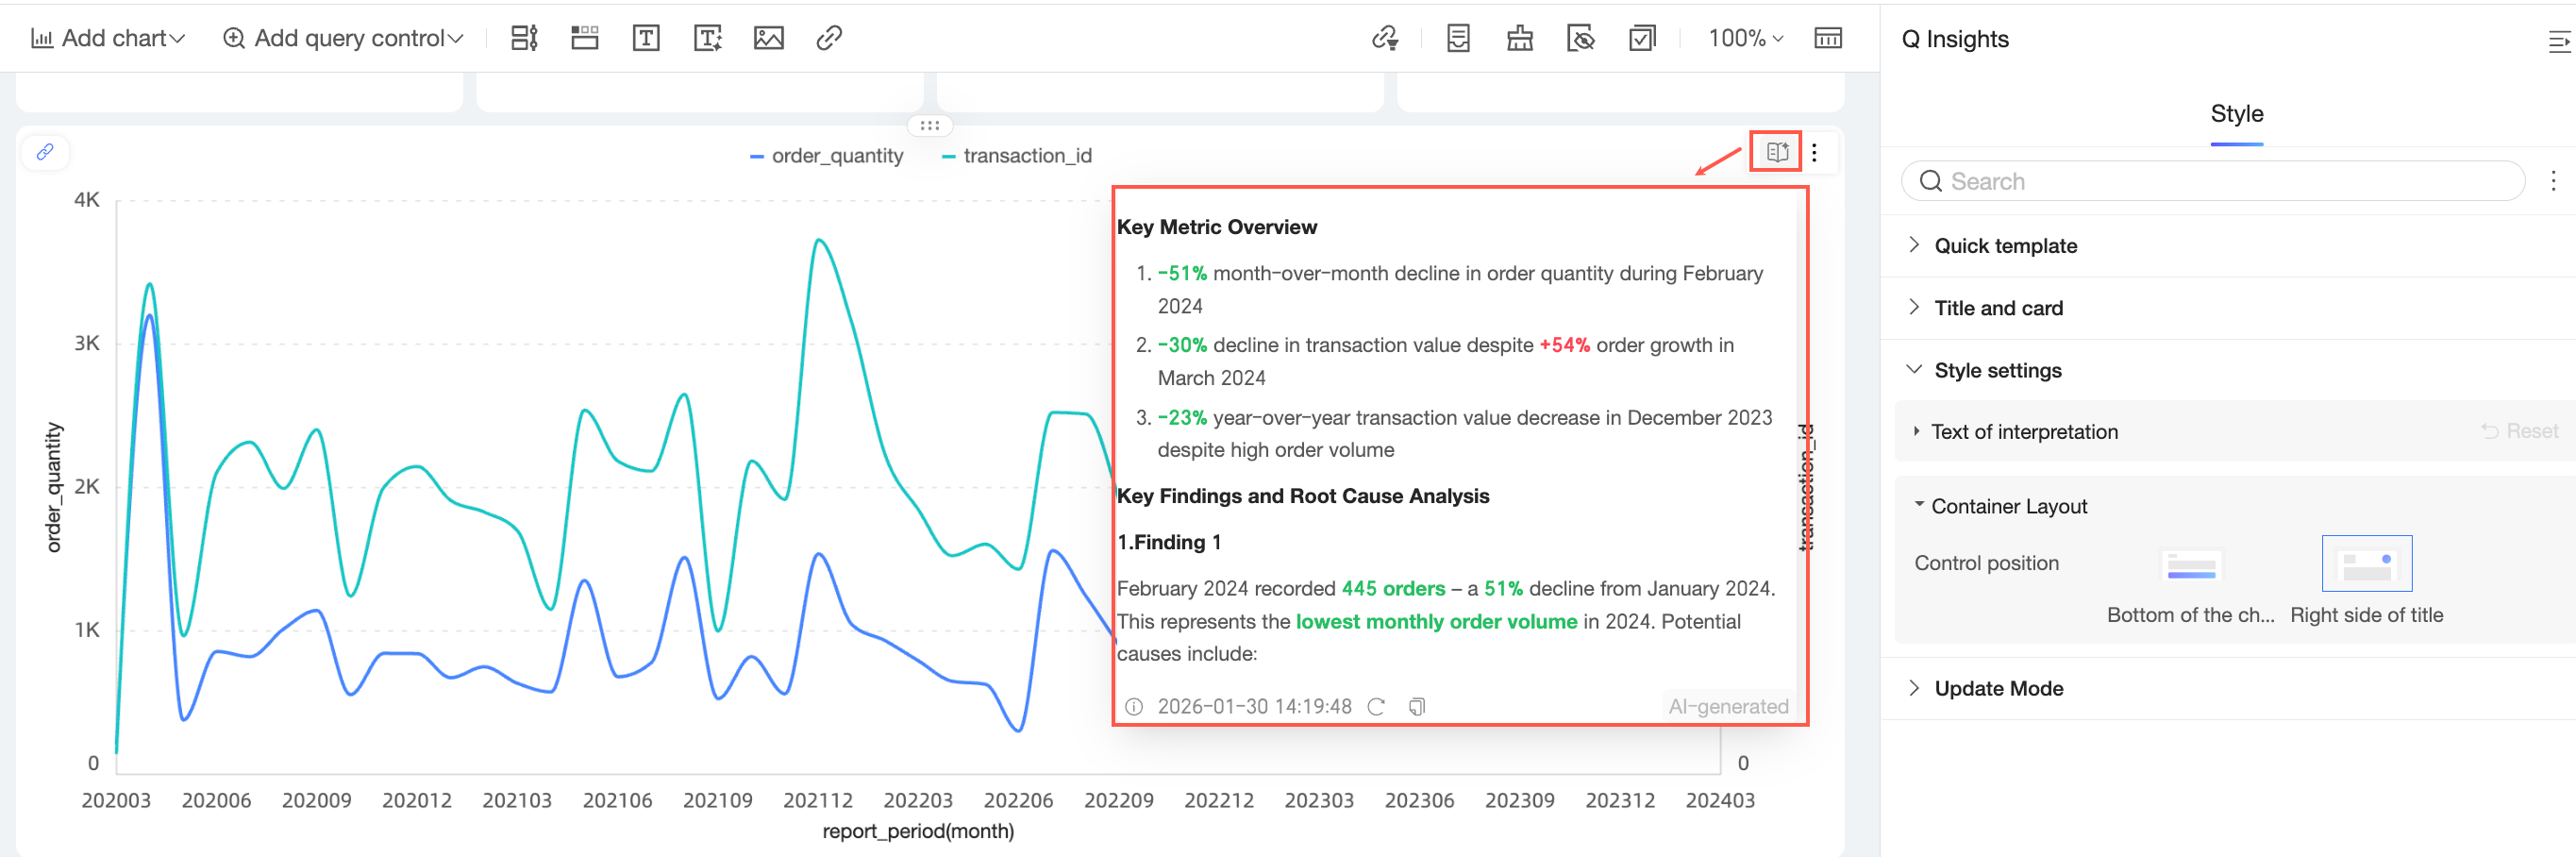
The Container layout for a single chart interpretation component allows you to set the Control position to Below chart or Right of title.
When the Control position is set to Below chart, you can set the Content area height.
When the Control position is set to Right of title, you can view the interpretation content in the upper-right corner of the chart.
Update mode
In Update Mode, you can configure whether to enable Auto-update daily or Auto-update on subscription for the interpretation component.
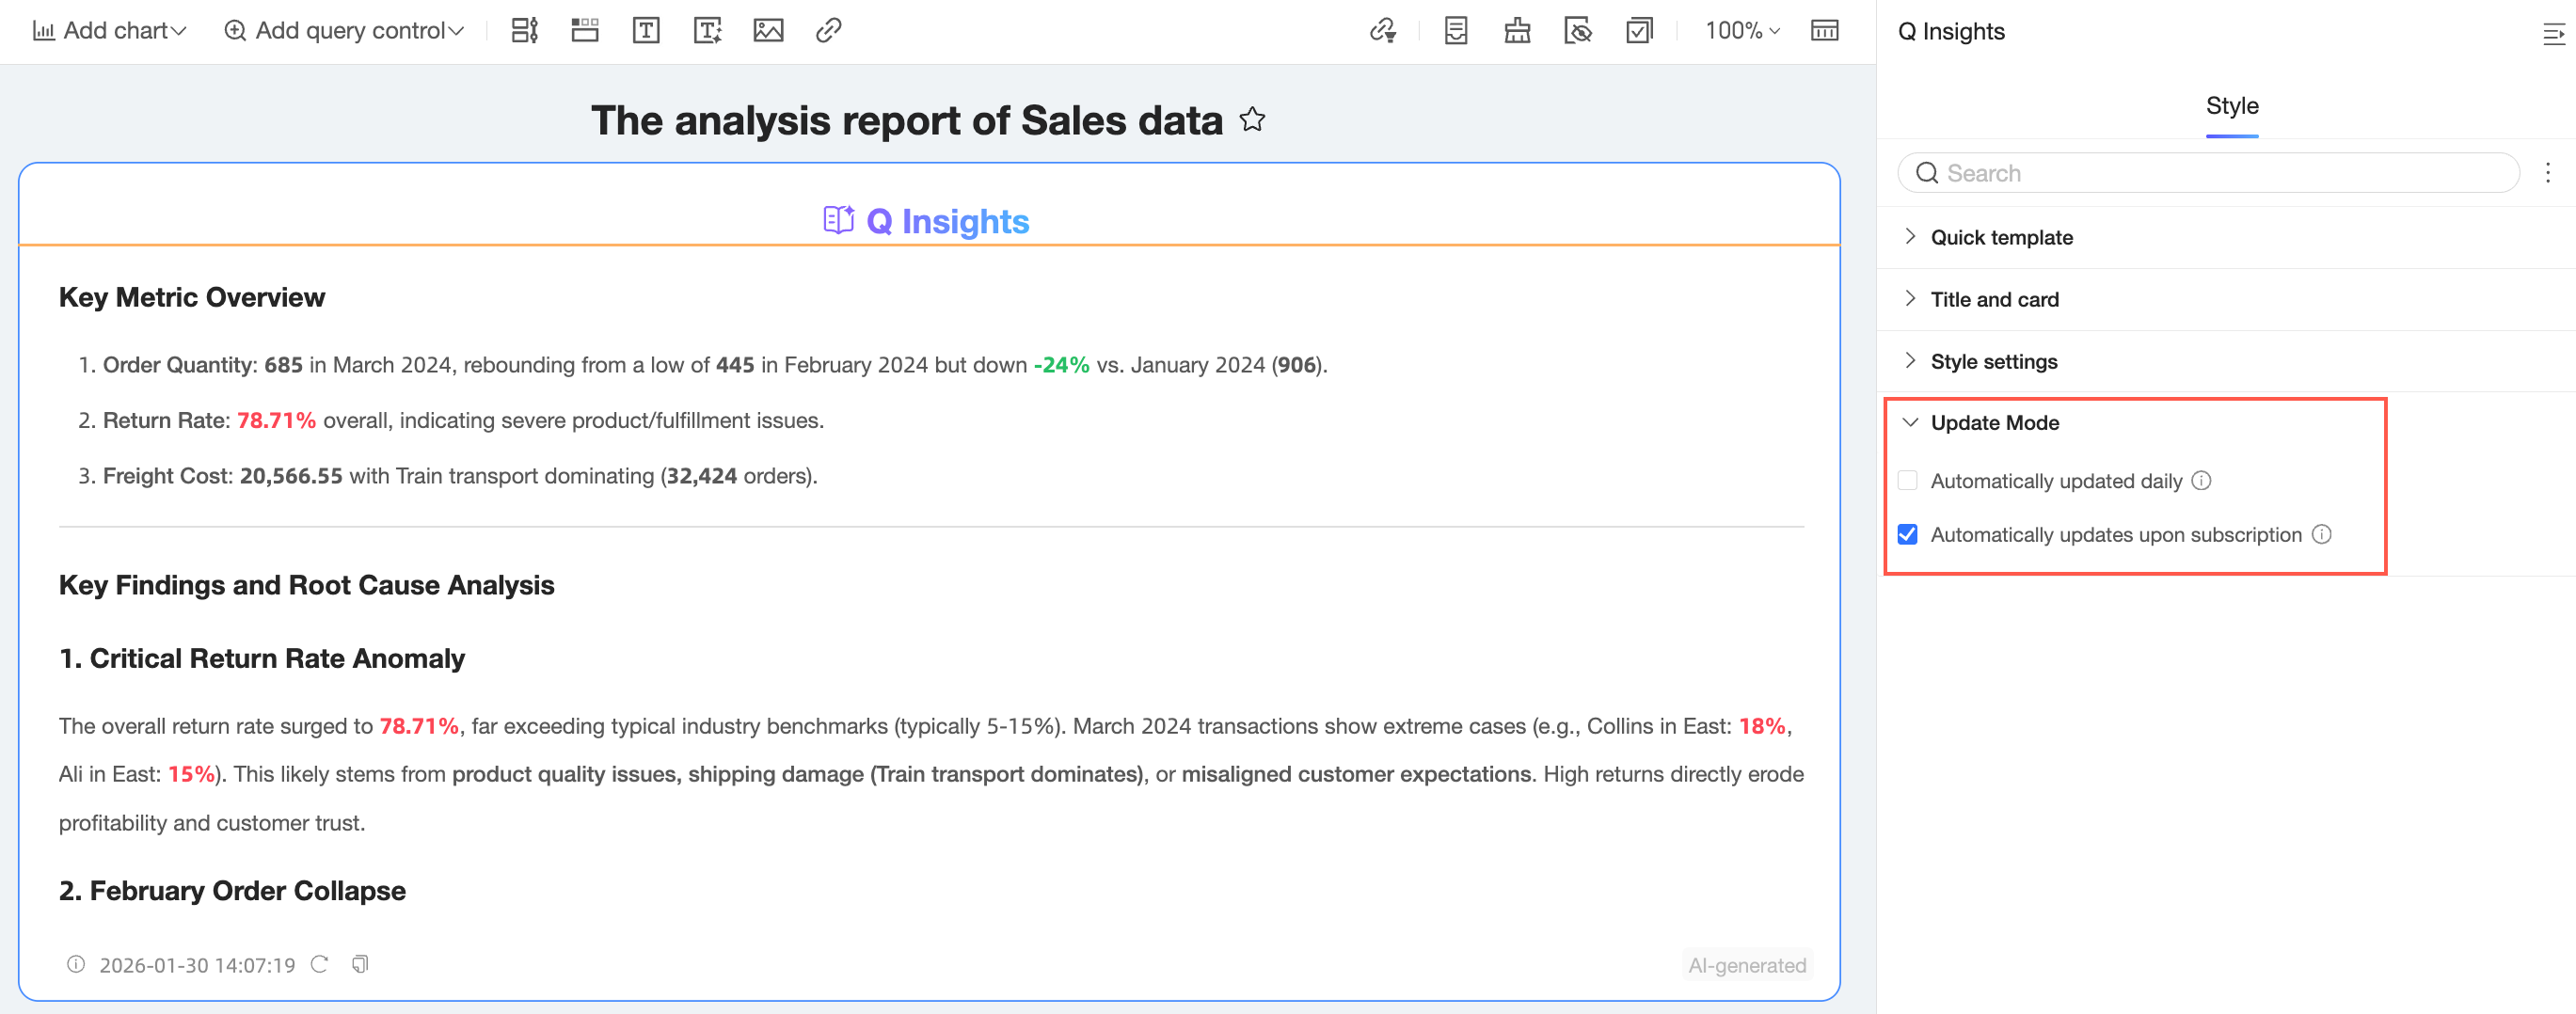
Auto-update daily: If enabled, the interpretation result automatically updates the first time a visitor views the dashboard each day. If disabled, visitors can manually click Regenerate to update the result.
Auto-update on subscription: If enabled, the result is automatically updated in subscription scenarios.
Interpretation component operations
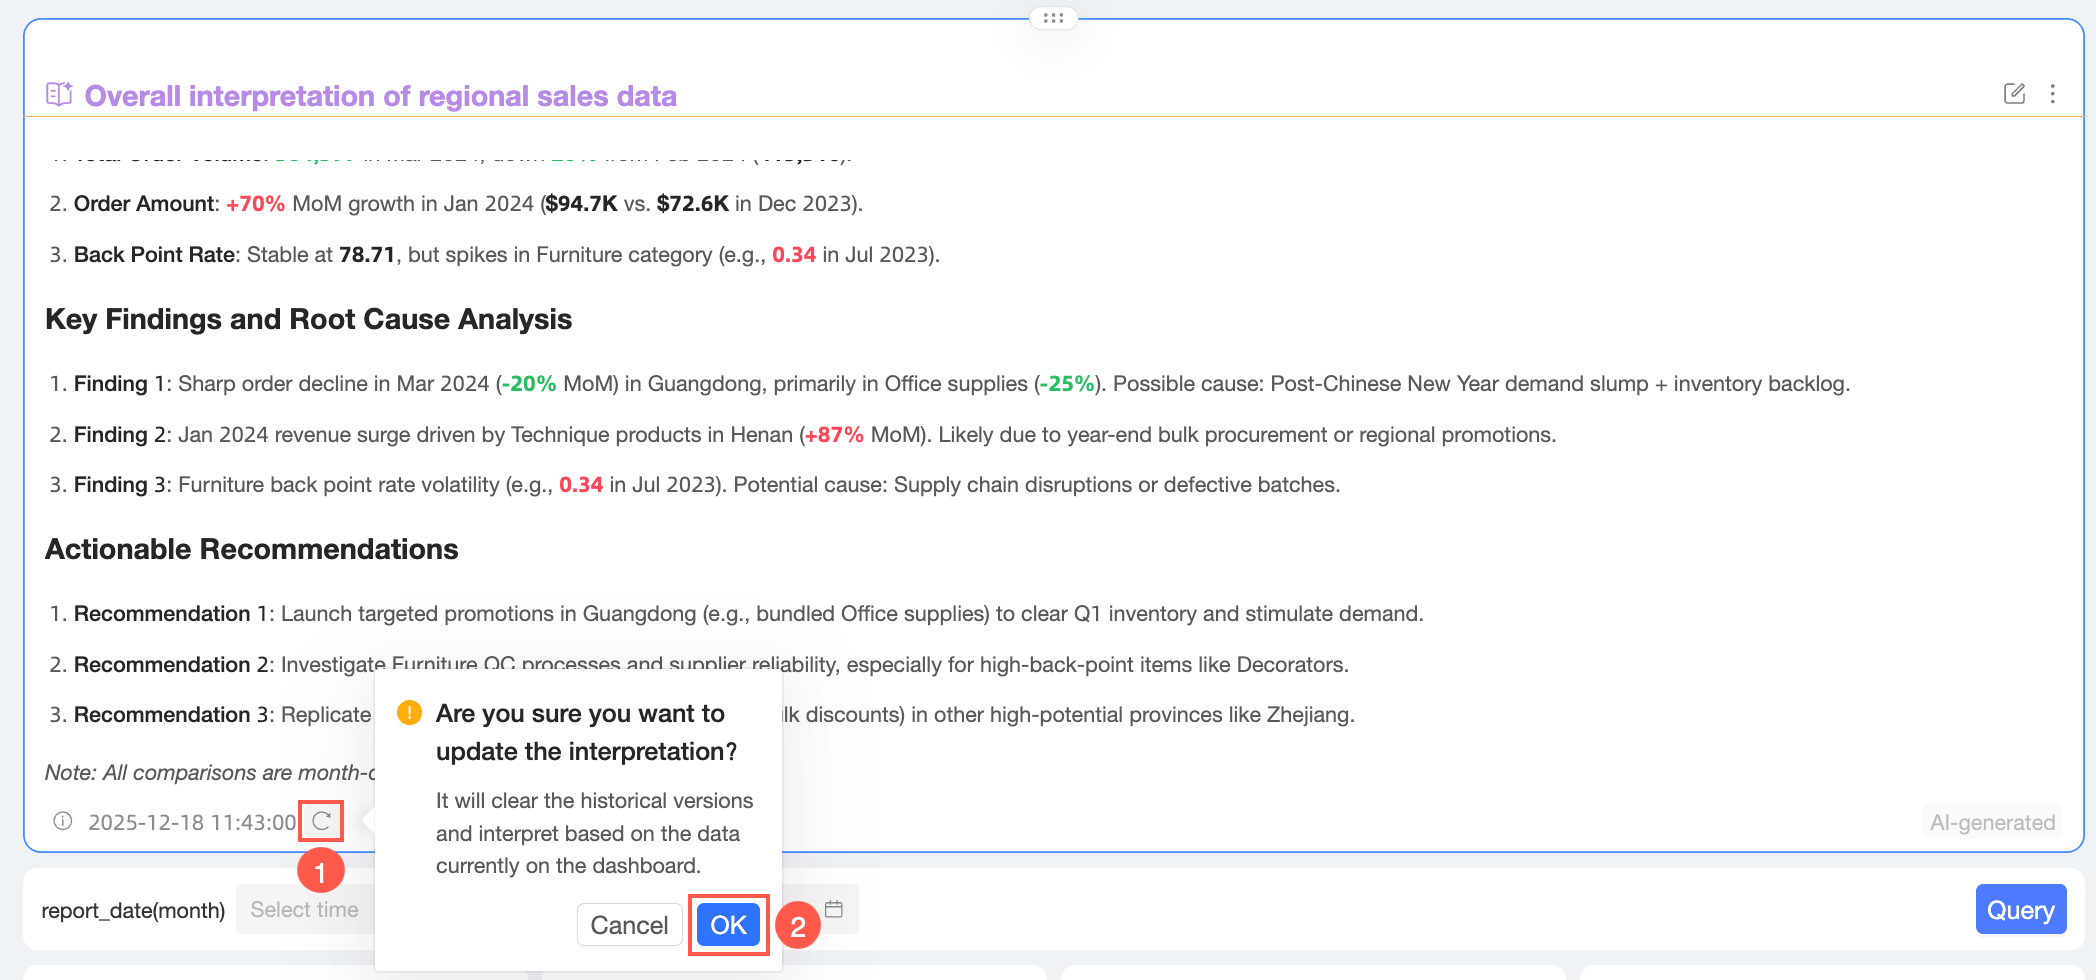
Update
Click the ![]() icon in the lower-left corner of the interpretation component and click OK in the confirmation dialog box. This action clears previous versions and generates a new interpretation based on the dashboard's current data.
icon in the lower-left corner of the interpretation component and click OK in the confirmation dialog box. This action clears previous versions and generates a new interpretation based on the dashboard's current data.
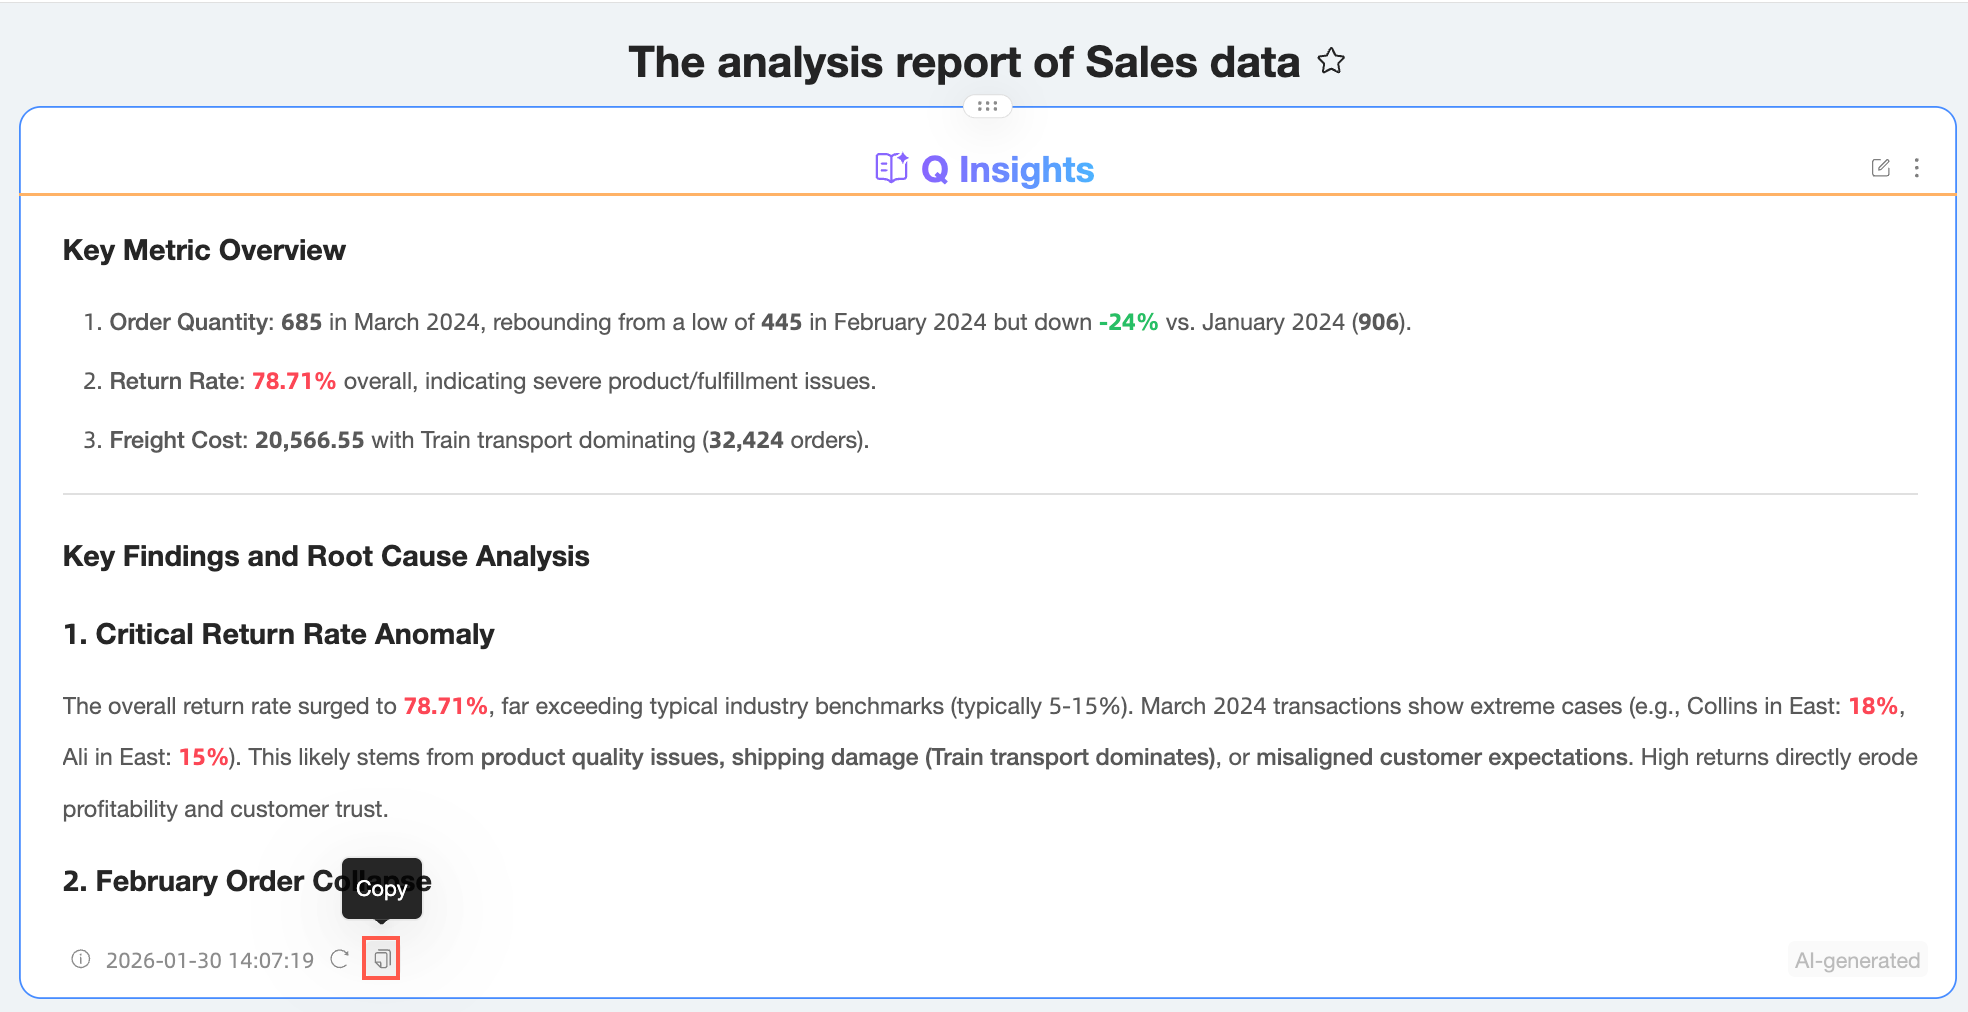
Copy
Click the ![]() icon in the lower-left corner of the interpretation component to copy its content.
icon in the lower-left corner of the interpretation component to copy its content.
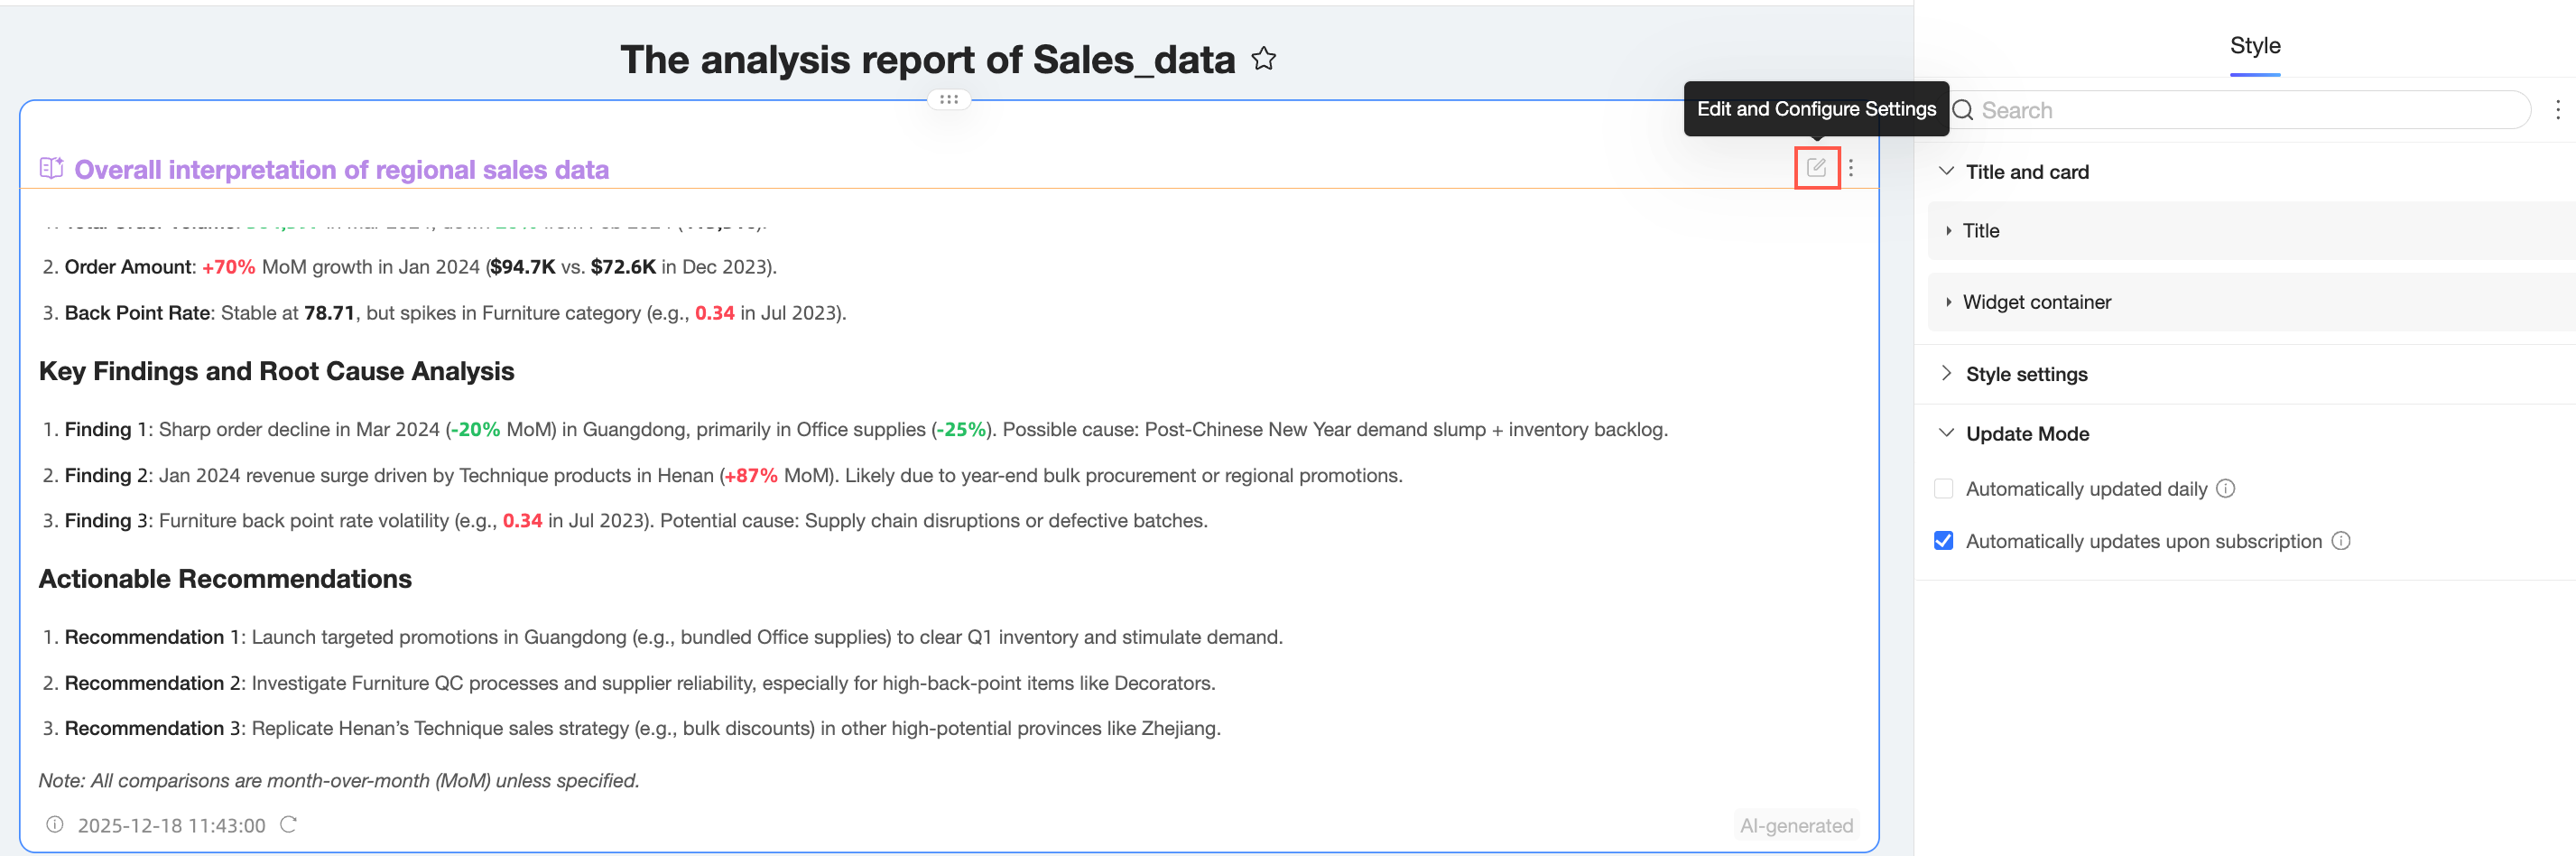
Edit
Click the
icon in the upper-right corner of the interpretation component to open the interpretation settings interface.On this interface, you can edit the interpretation approach and update the result.
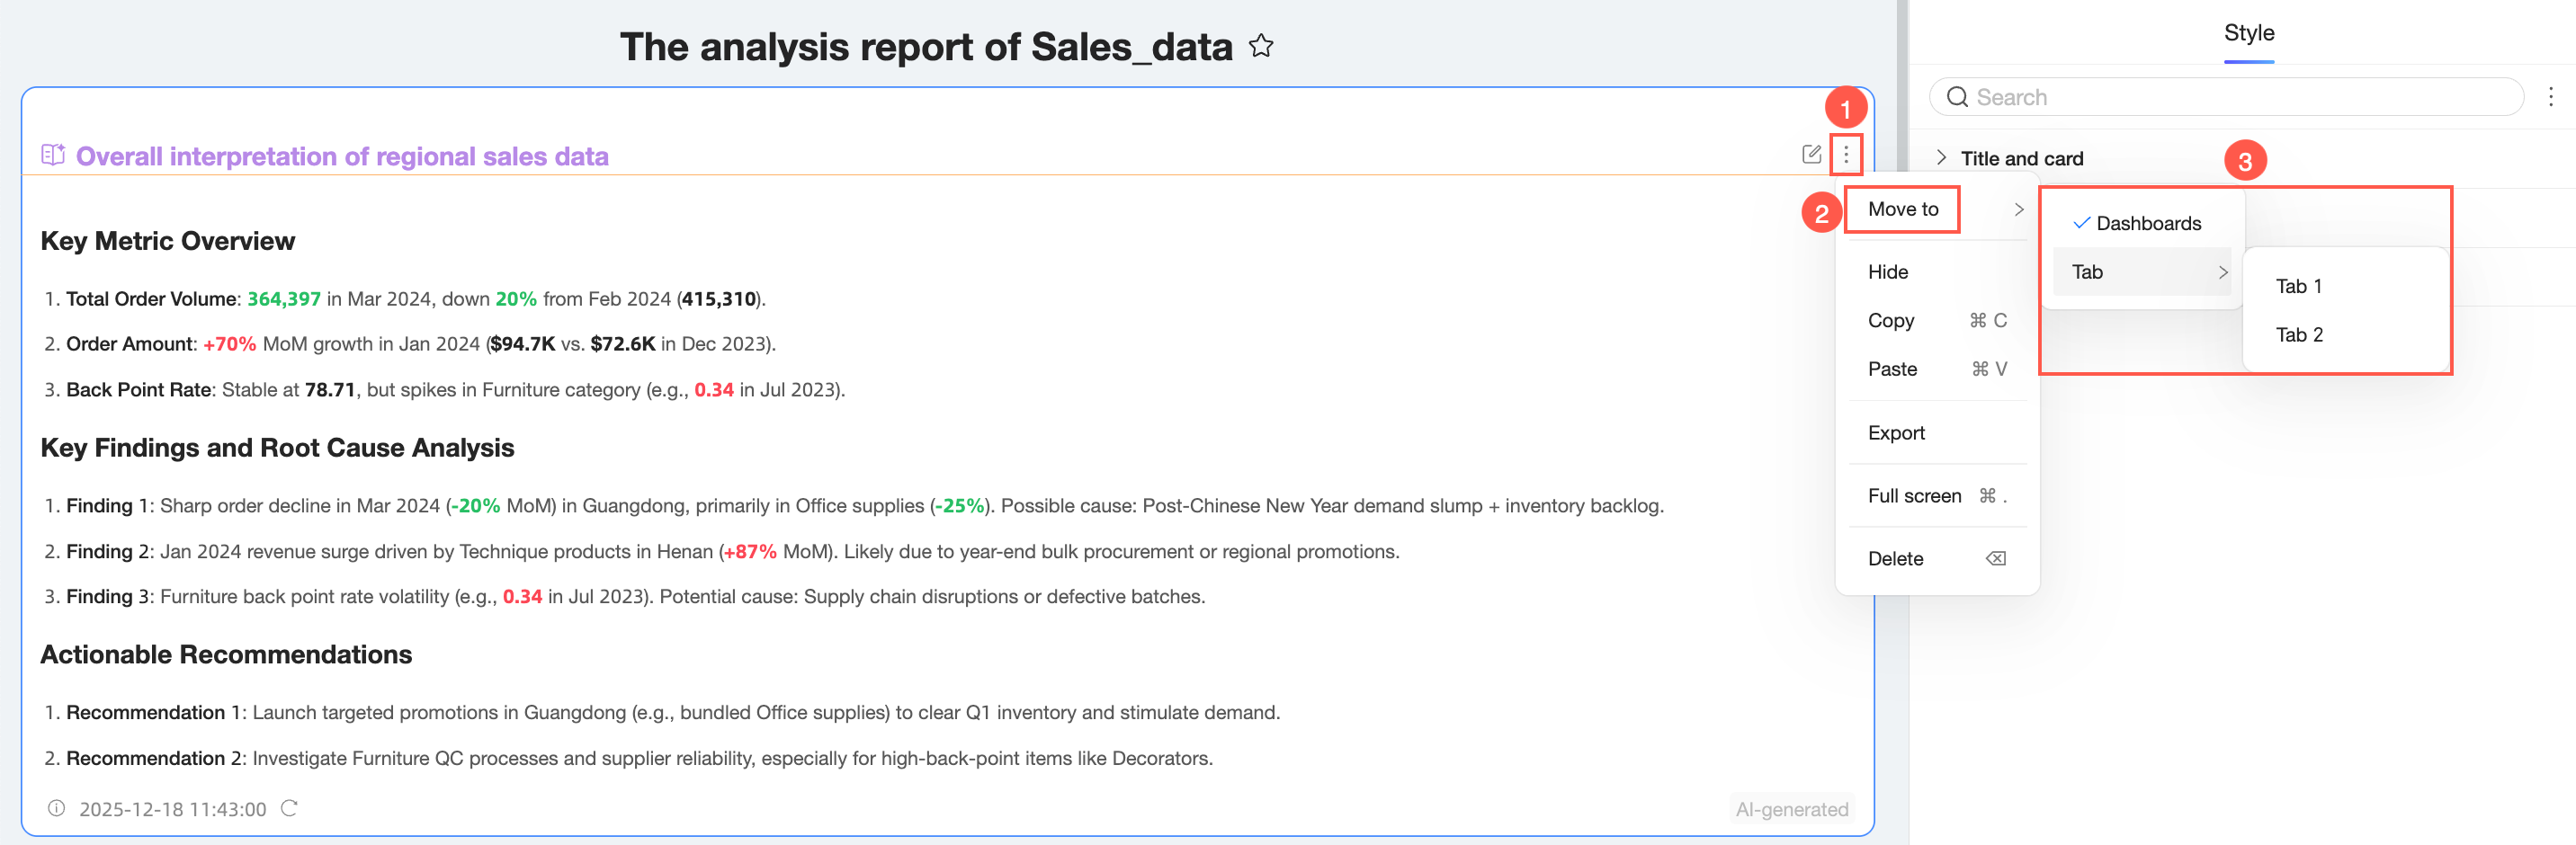
Move to
Only global interpretation components can be moved to a tab or dashboard.
Click the ![]() icon in the upper-right corner of the interpretation component, select Move to, and then select the target tab or dashboard.
icon in the upper-right corner of the interpretation component, select Move to, and then select the target tab or dashboard.
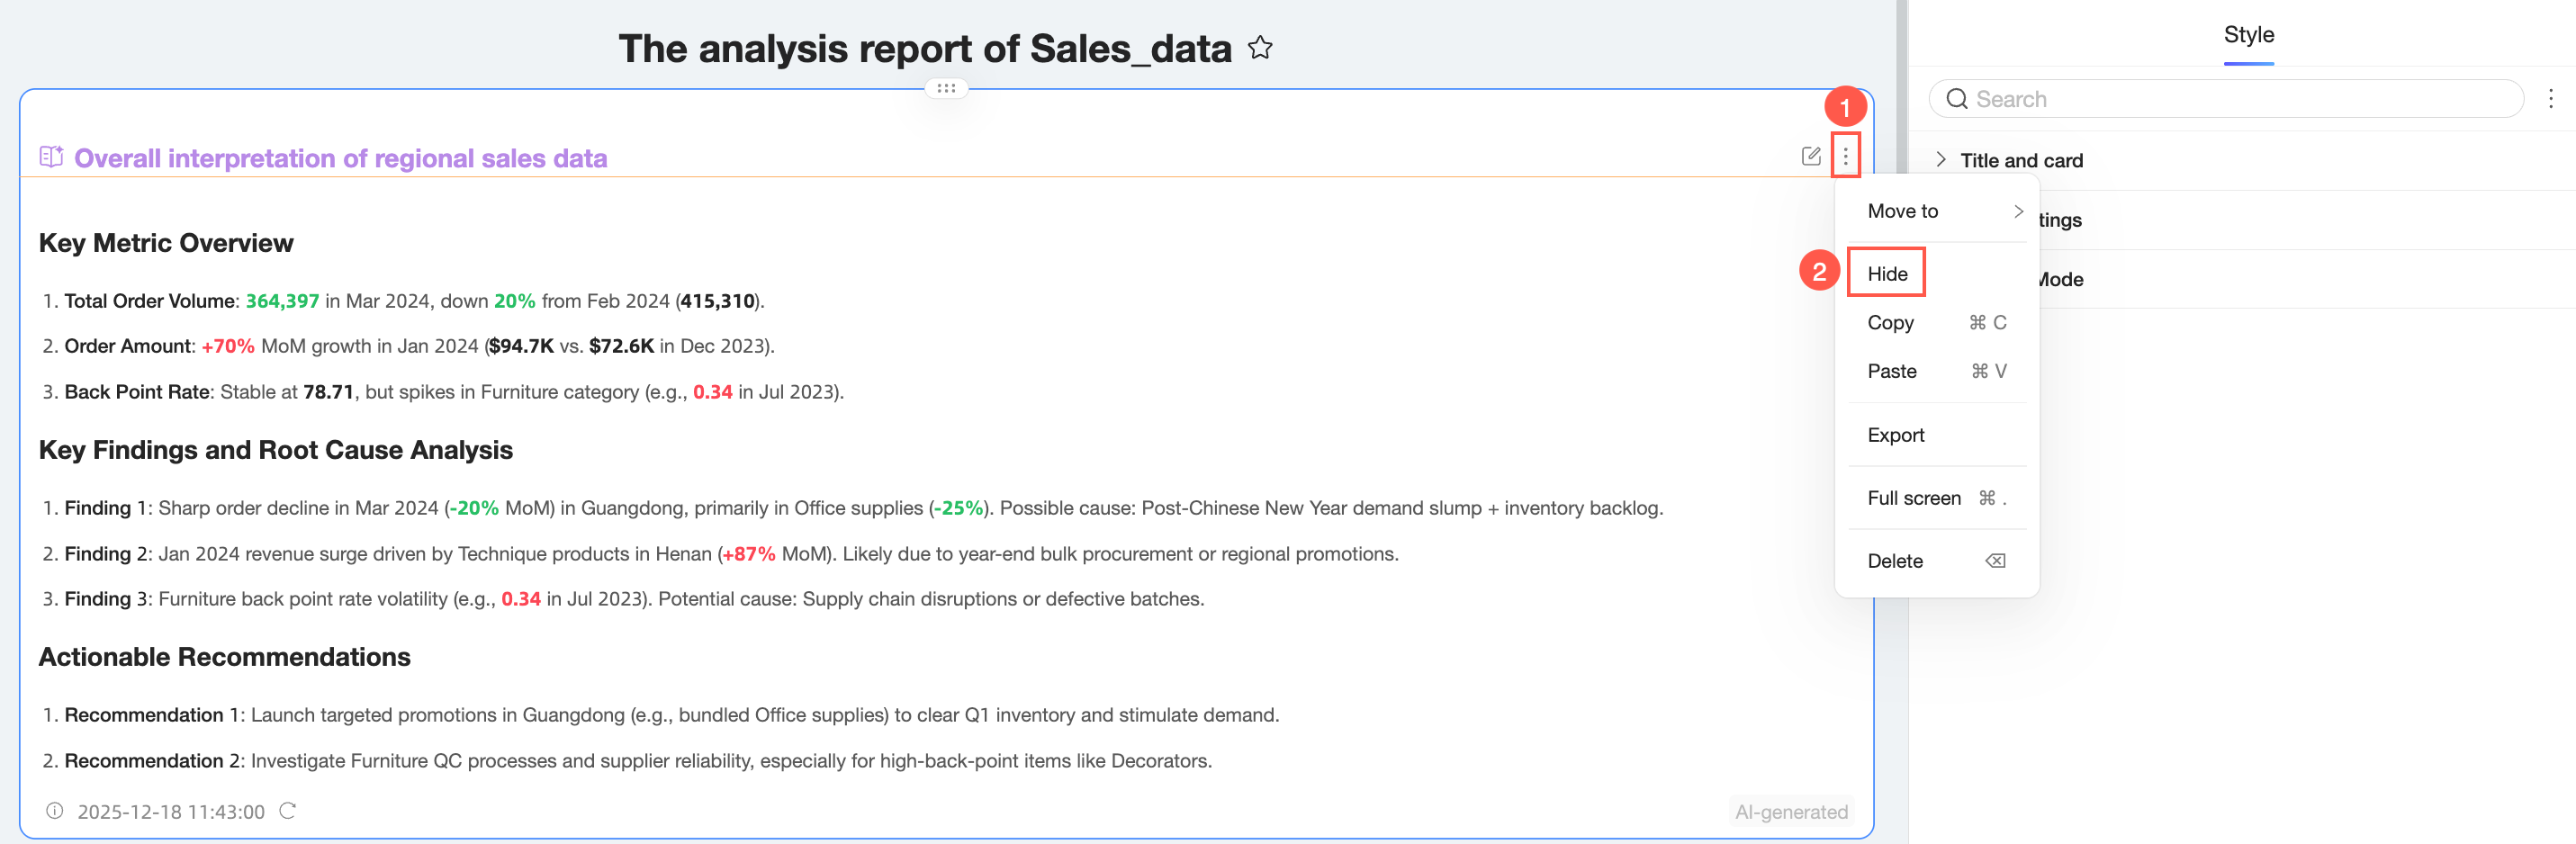
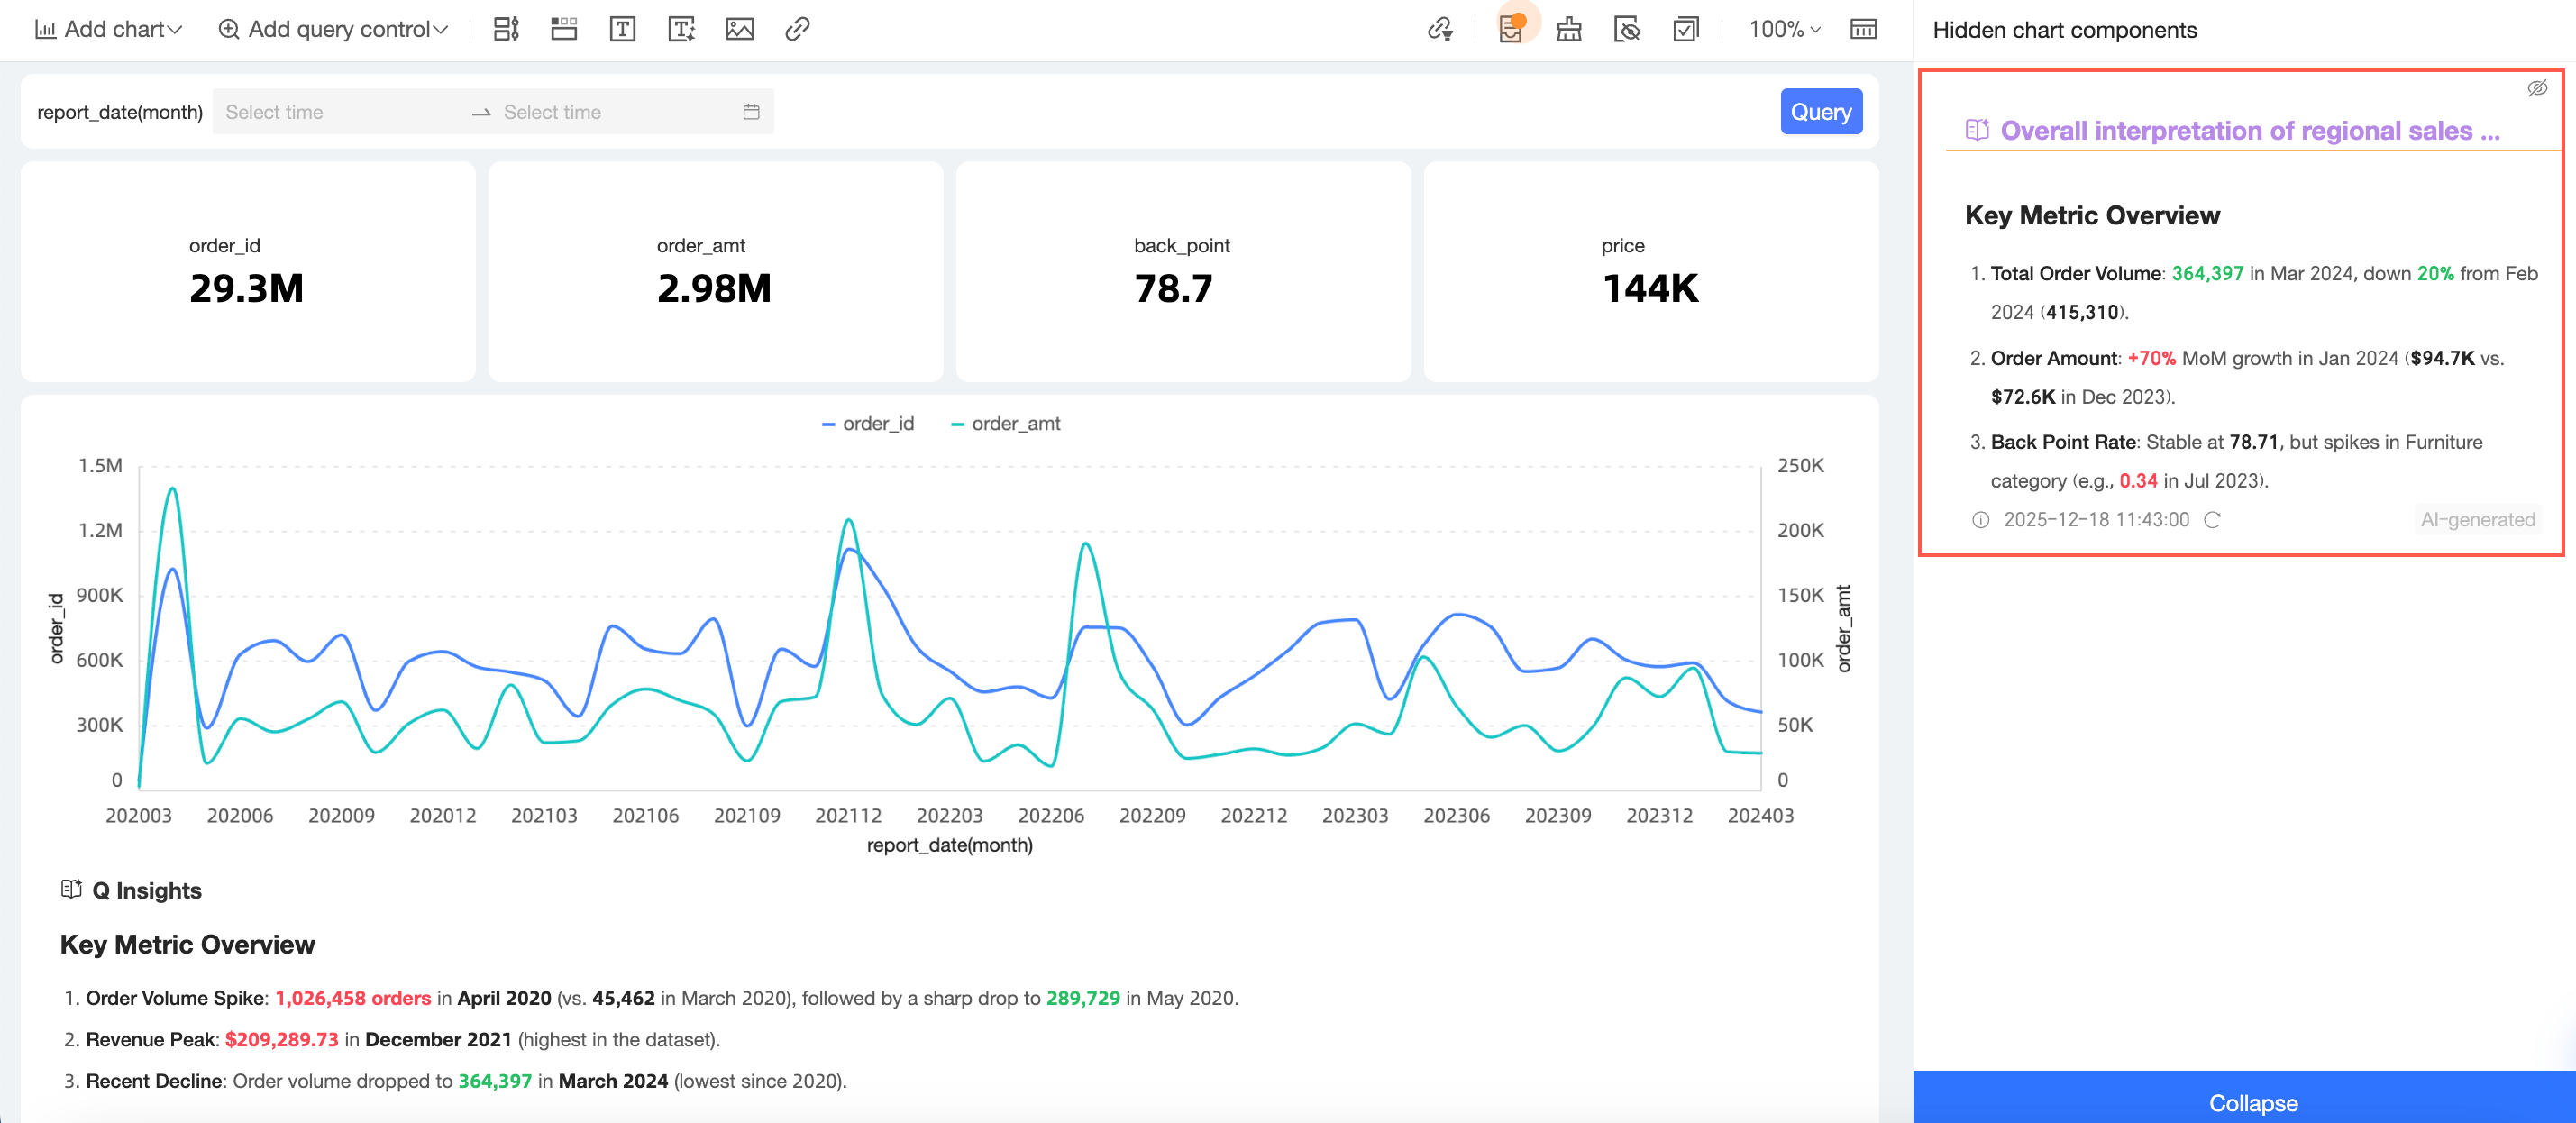
Hide
Click the
icon in the upper-right corner of the interpretation component and select Hide.After the component is hidden, you can find it in Hidden chart components.
Click the
icon in the upper-right corner to restore the component.
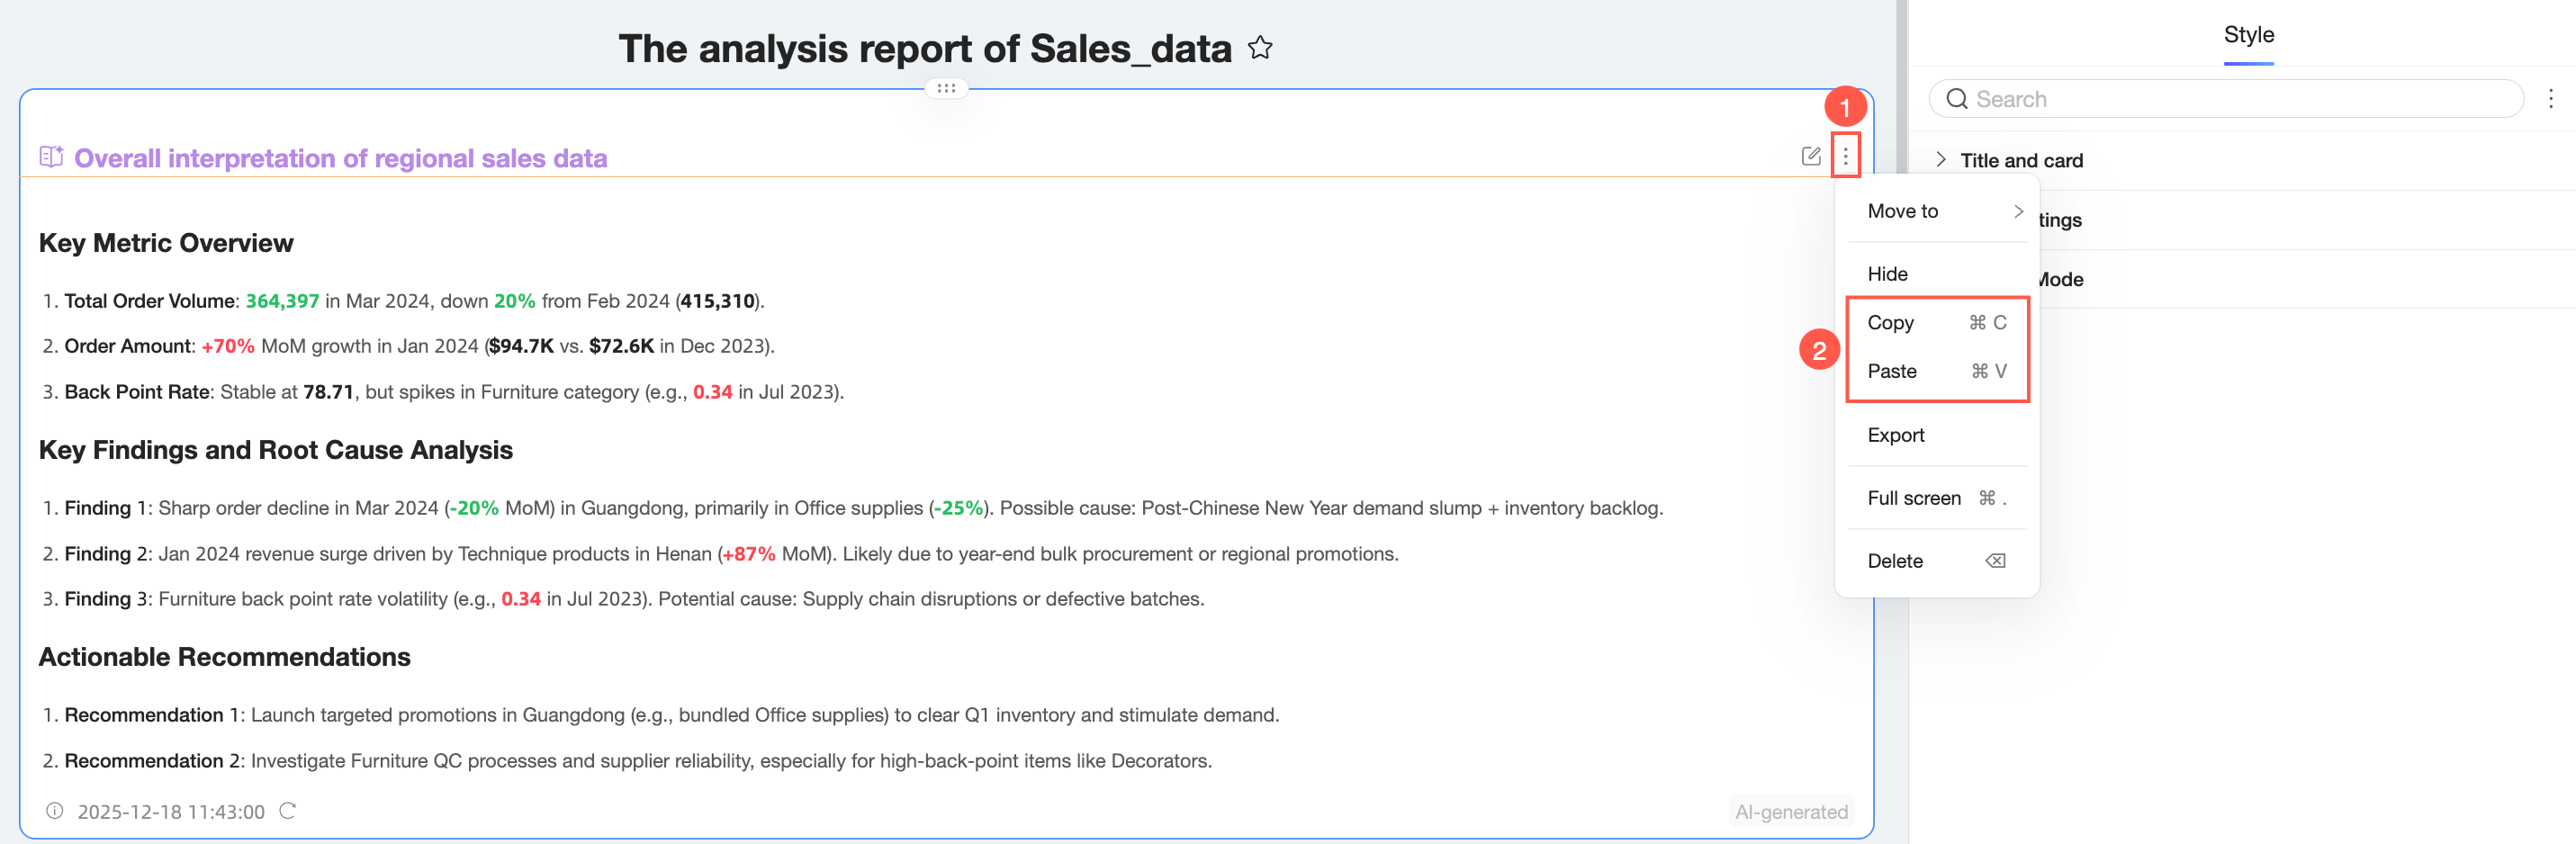
Copy and paste
Only global interpretation components support copy and paste.
Click the ![]() icon in the upper-right corner of the interpretation component and select Copy or Paste. You can also use keyboard shortcuts to copy and paste.
icon in the upper-right corner of the interpretation component and select Copy or Paste. You can also use keyboard shortcuts to copy and paste.
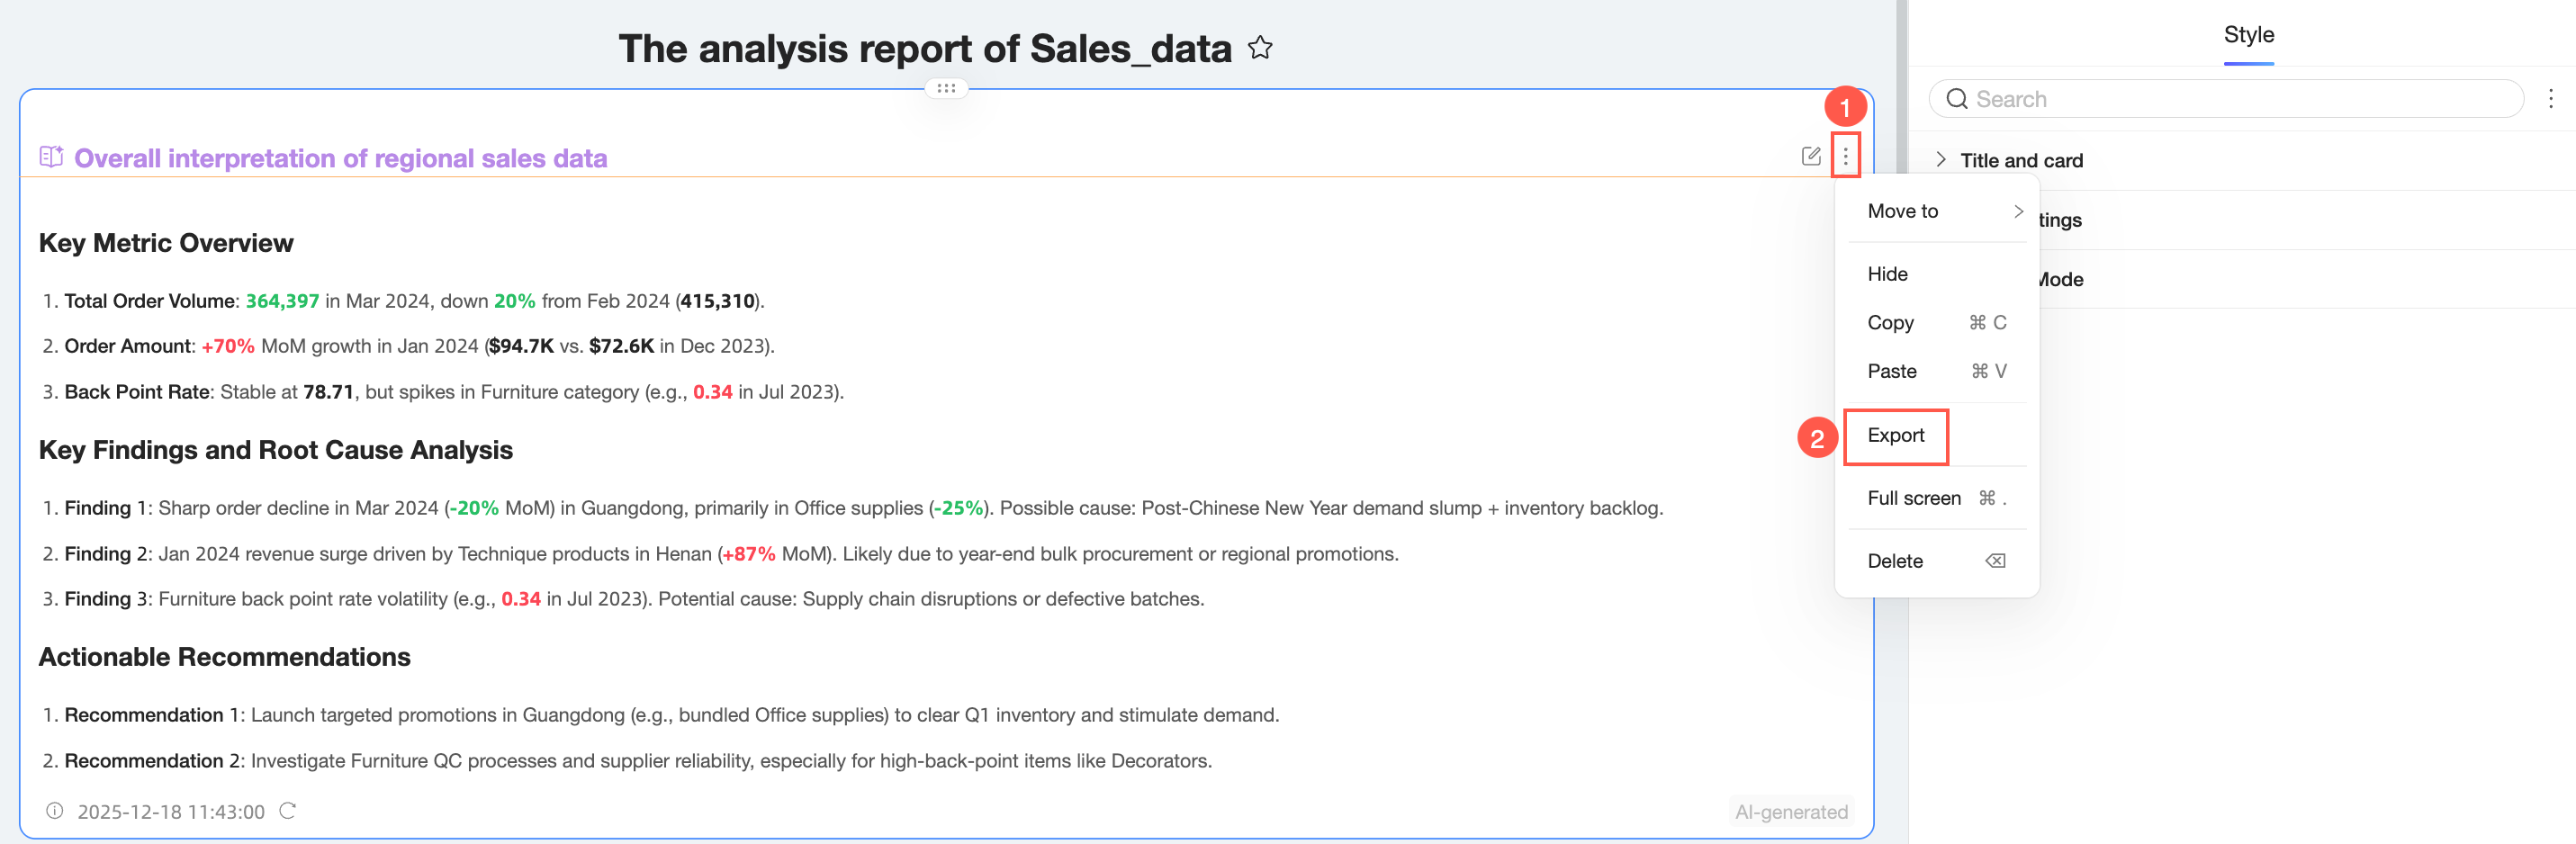
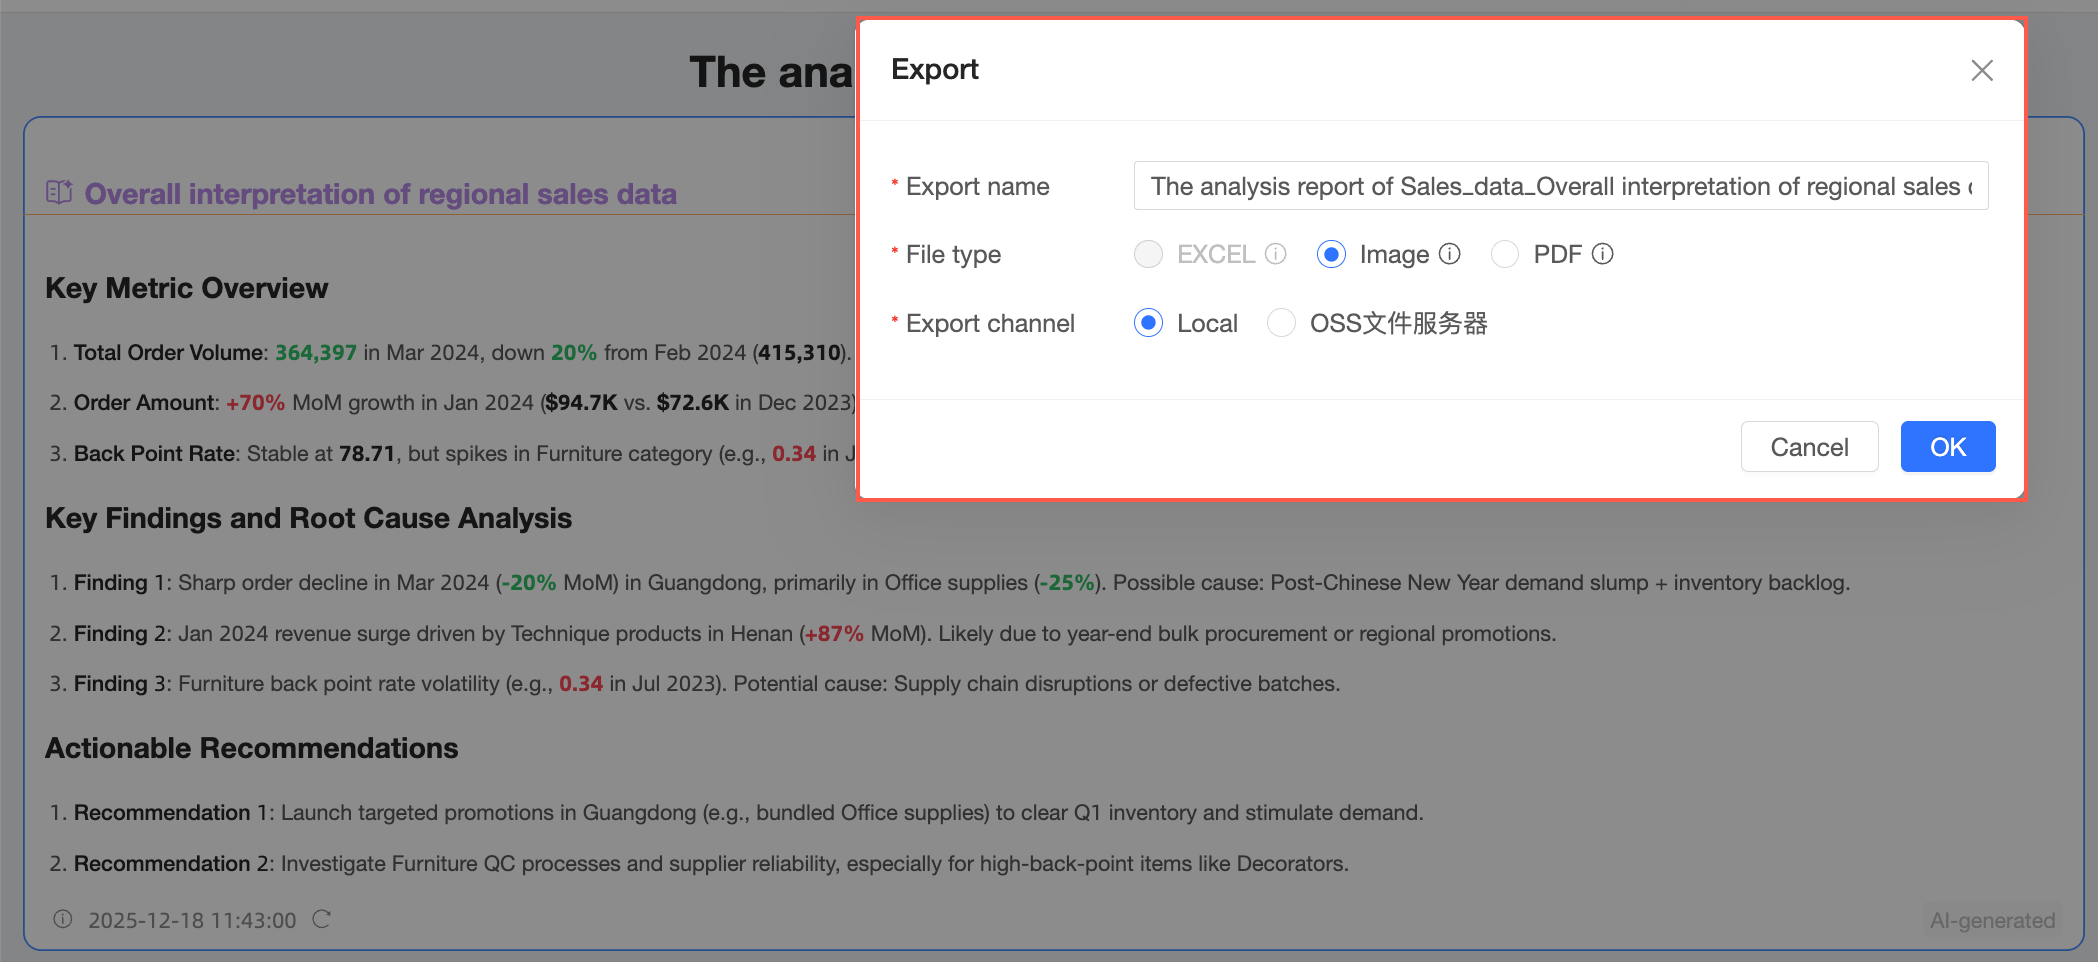
Export
Only global interpretation components can be exported.
Click the
icon in the upper-right corner of the interpretation component and select Export.In the Export dialog box, click OK.
NoteInterpretation components can be exported in PDF and image formats. Embedded pages and images that do not allow cross-origin access cannot be exported. Gradient text colors are not supported in exports and will be rendered as solid colors.
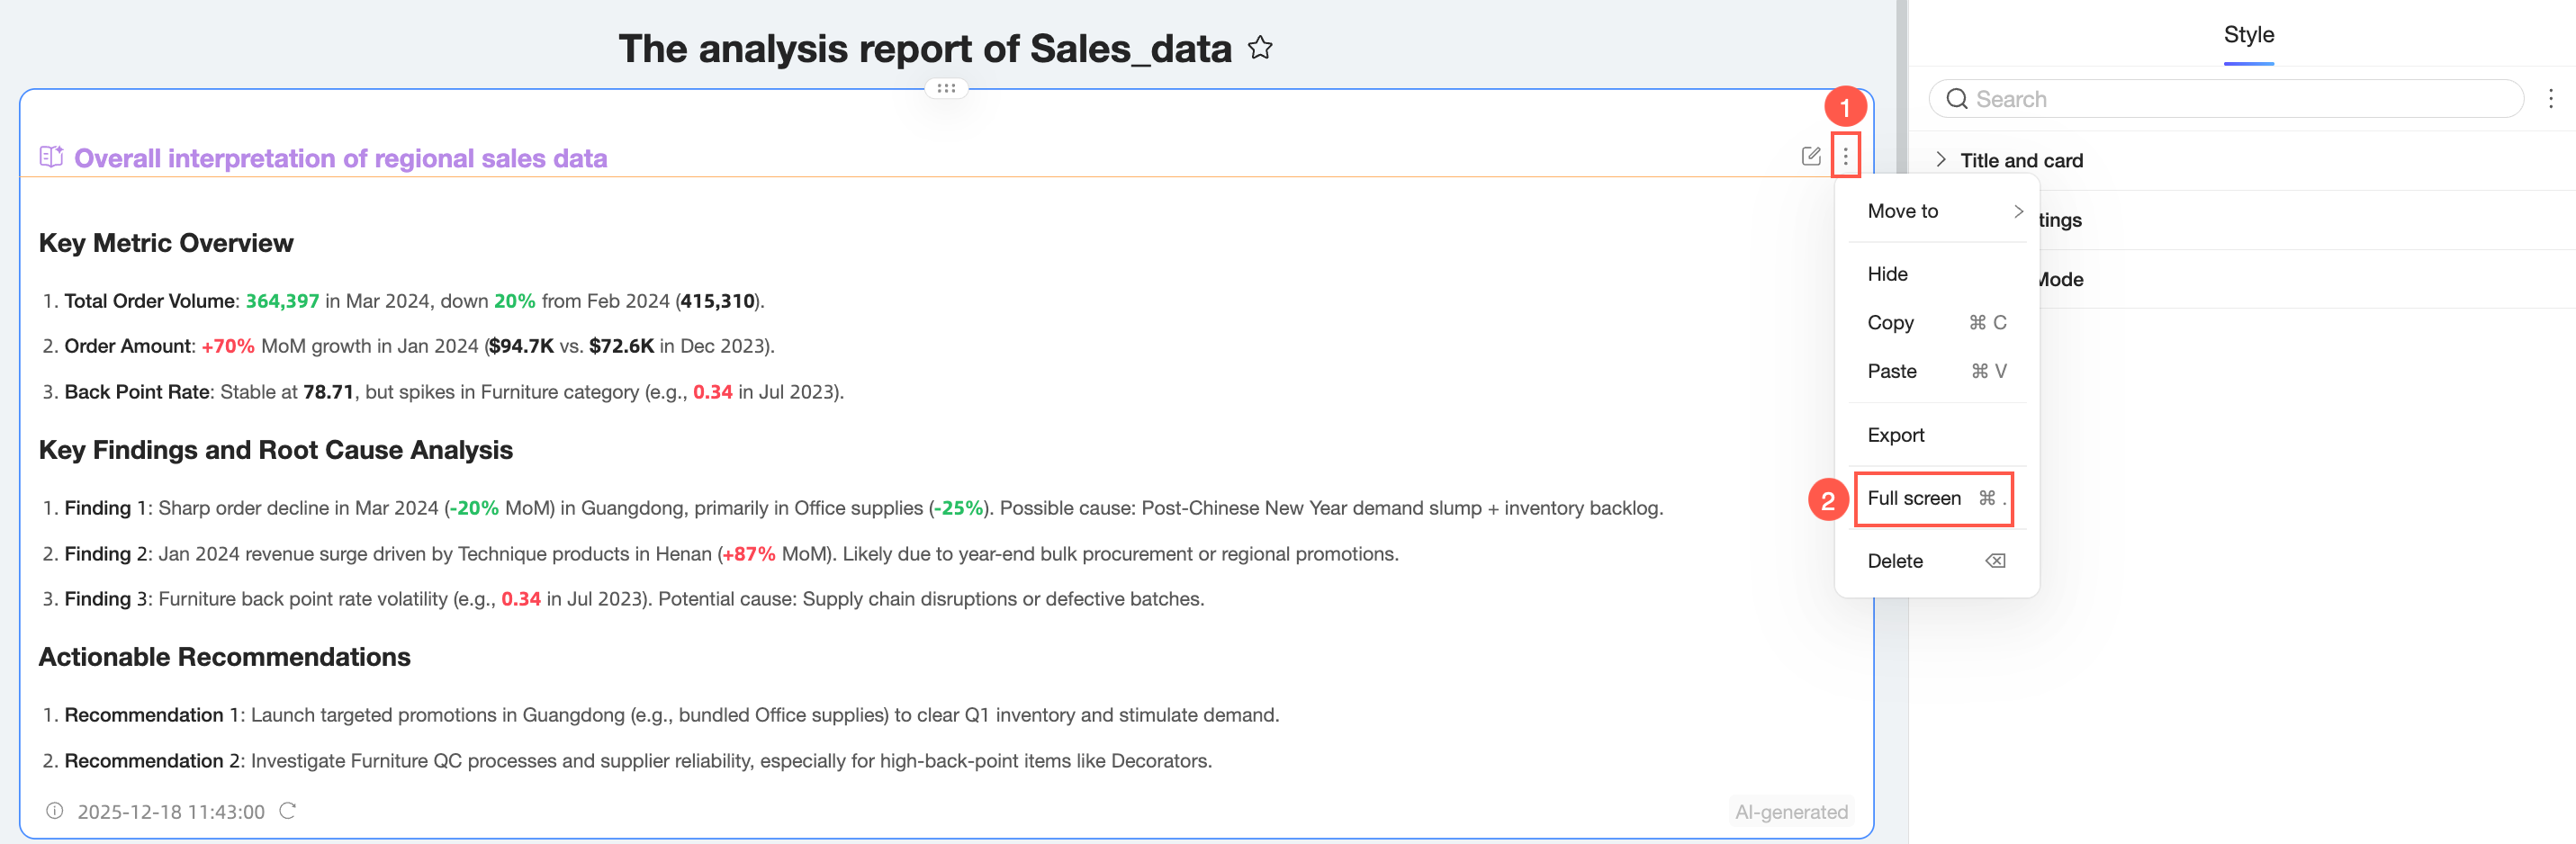
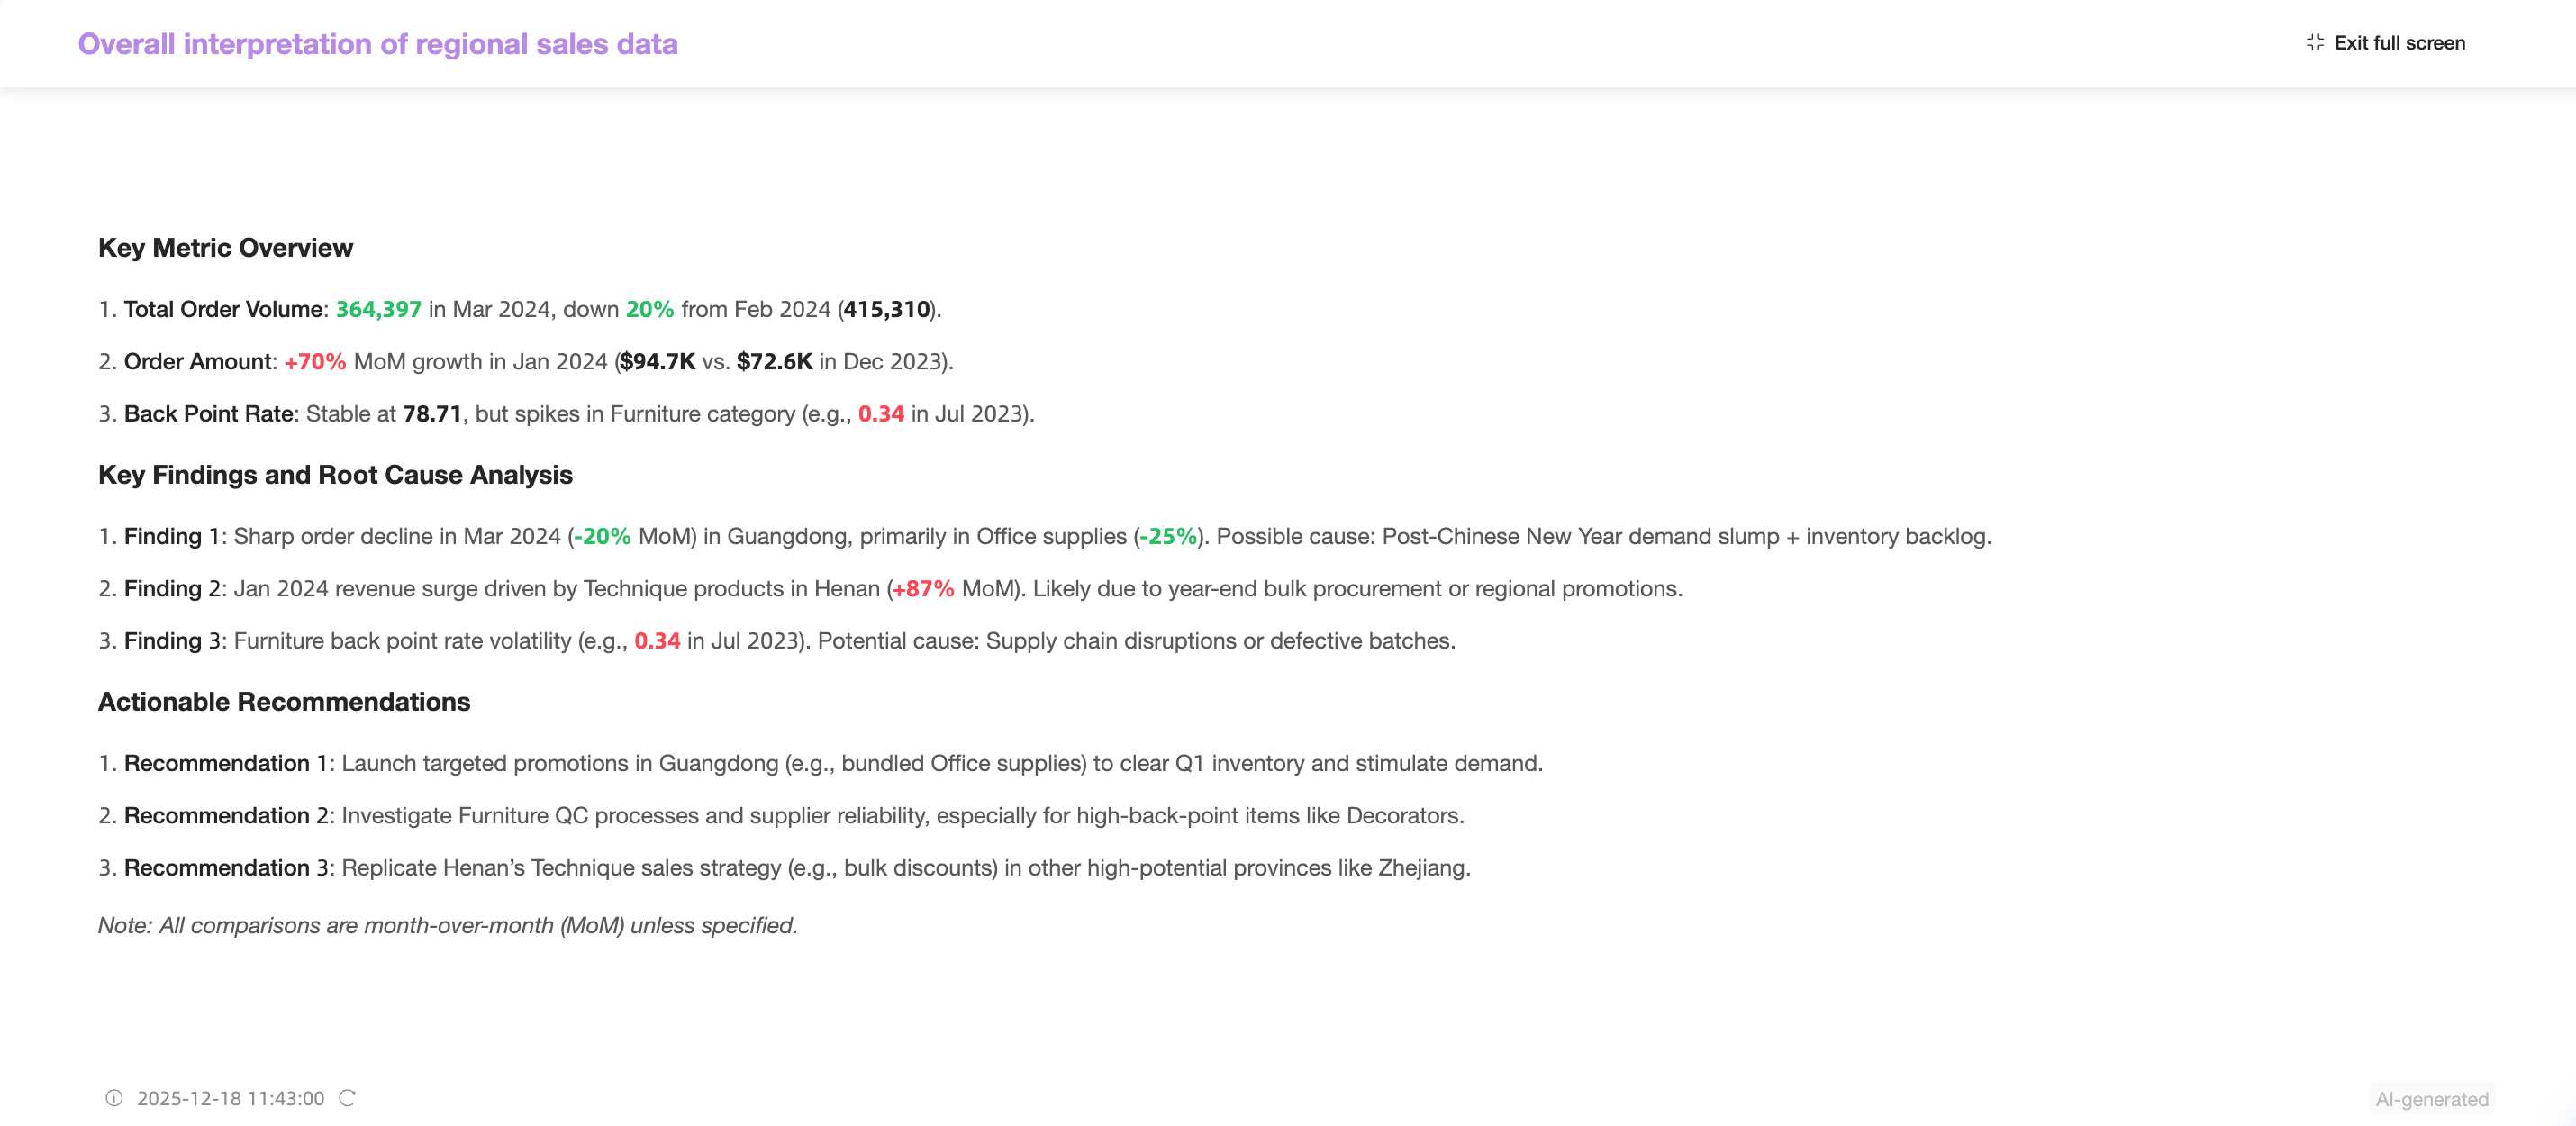
Full screen
Click the
icon in the upper-right corner of the interpretation component and select Full screen.You can now view the interpretation component in full screen mode.
Click Exit full screen in the upper-right corner to return to the dashboard editing page.
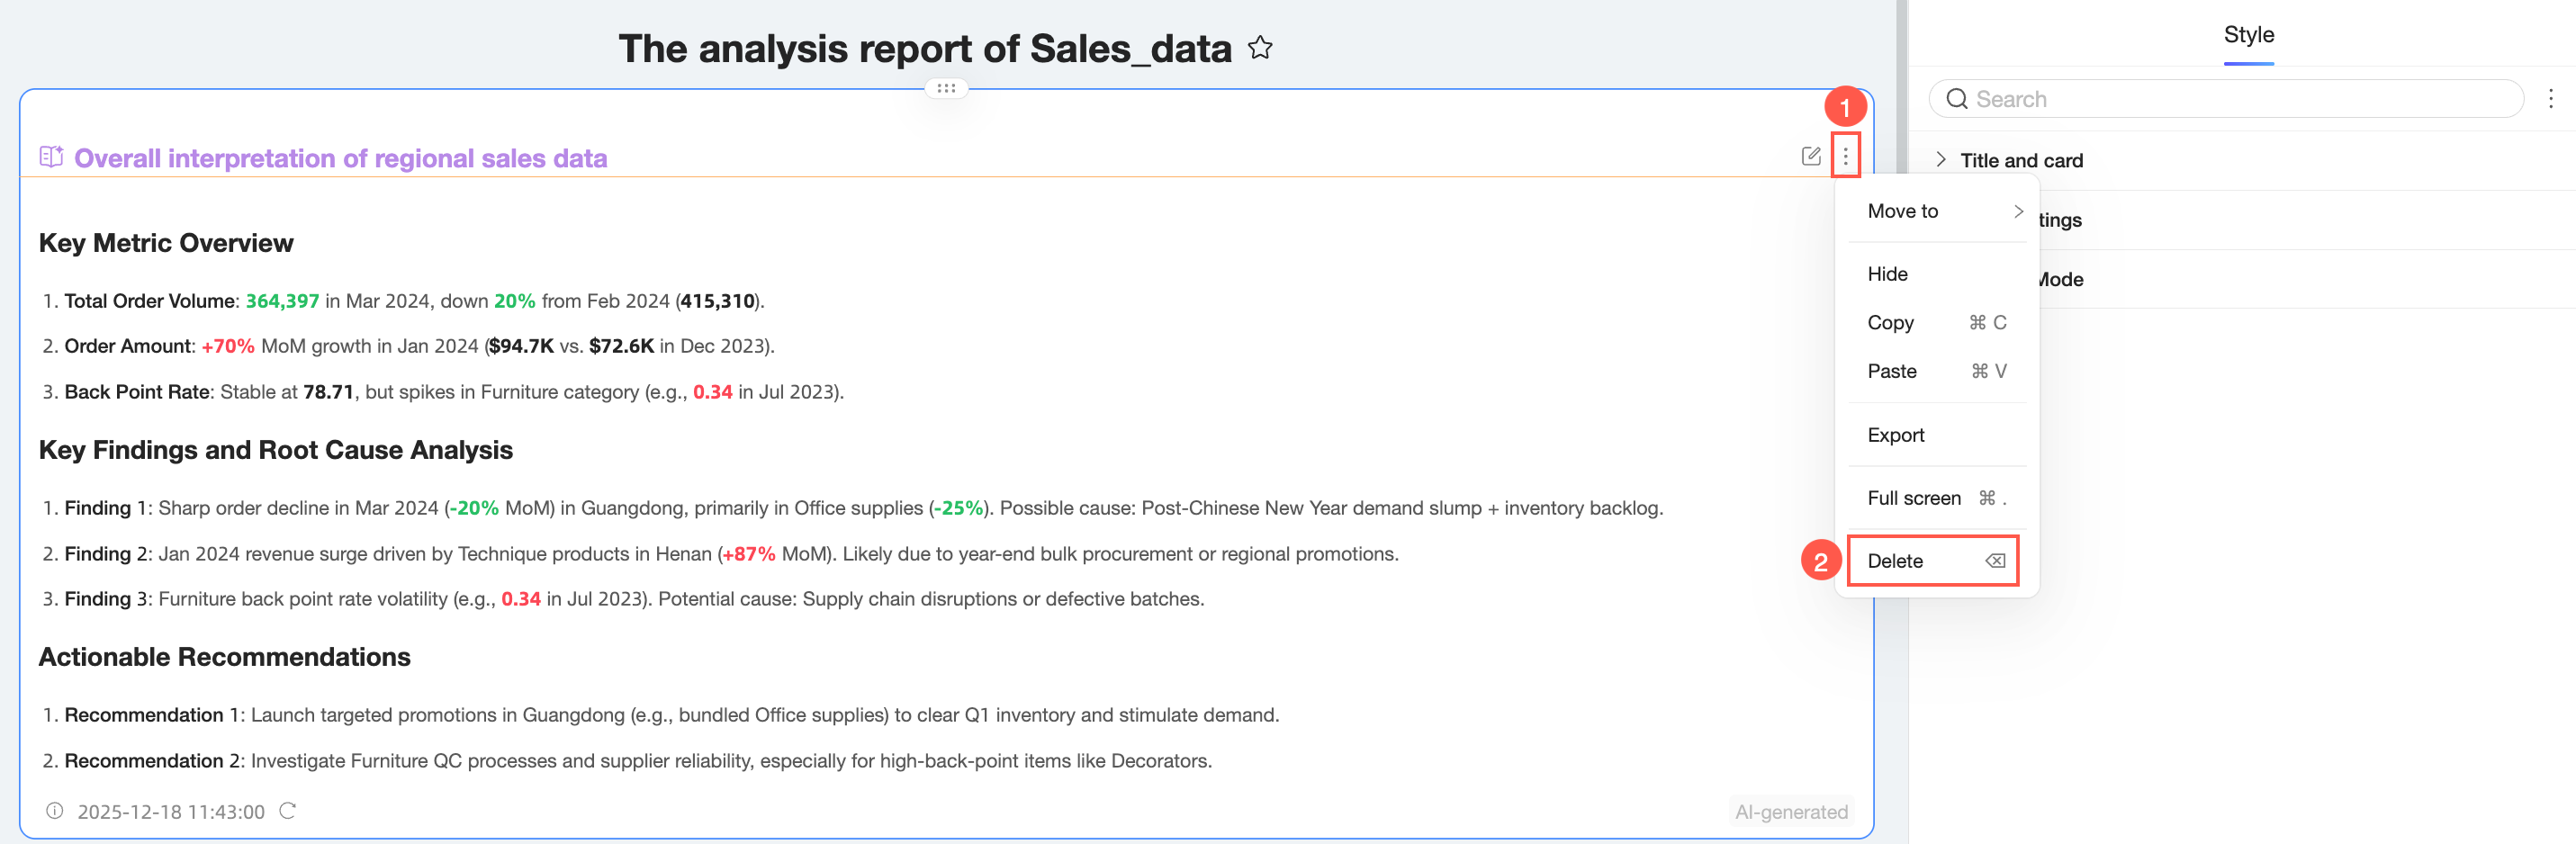
Delete
Click the ![]() icon in the upper-right corner of the interpretation component and select Delete to remove the component.
icon in the upper-right corner of the interpretation component and select Delete to remove the component.