Q Report combines intelligent data analysis with document editing, allowing you to create reports in two ways: intelligent generation or from scratch. This topic explains how.
Entry points
Log on to the Quick BI console and click Intelligent Q in the top navigation bar to open the Intelligent Q page. From there, you can access the Q Report feature.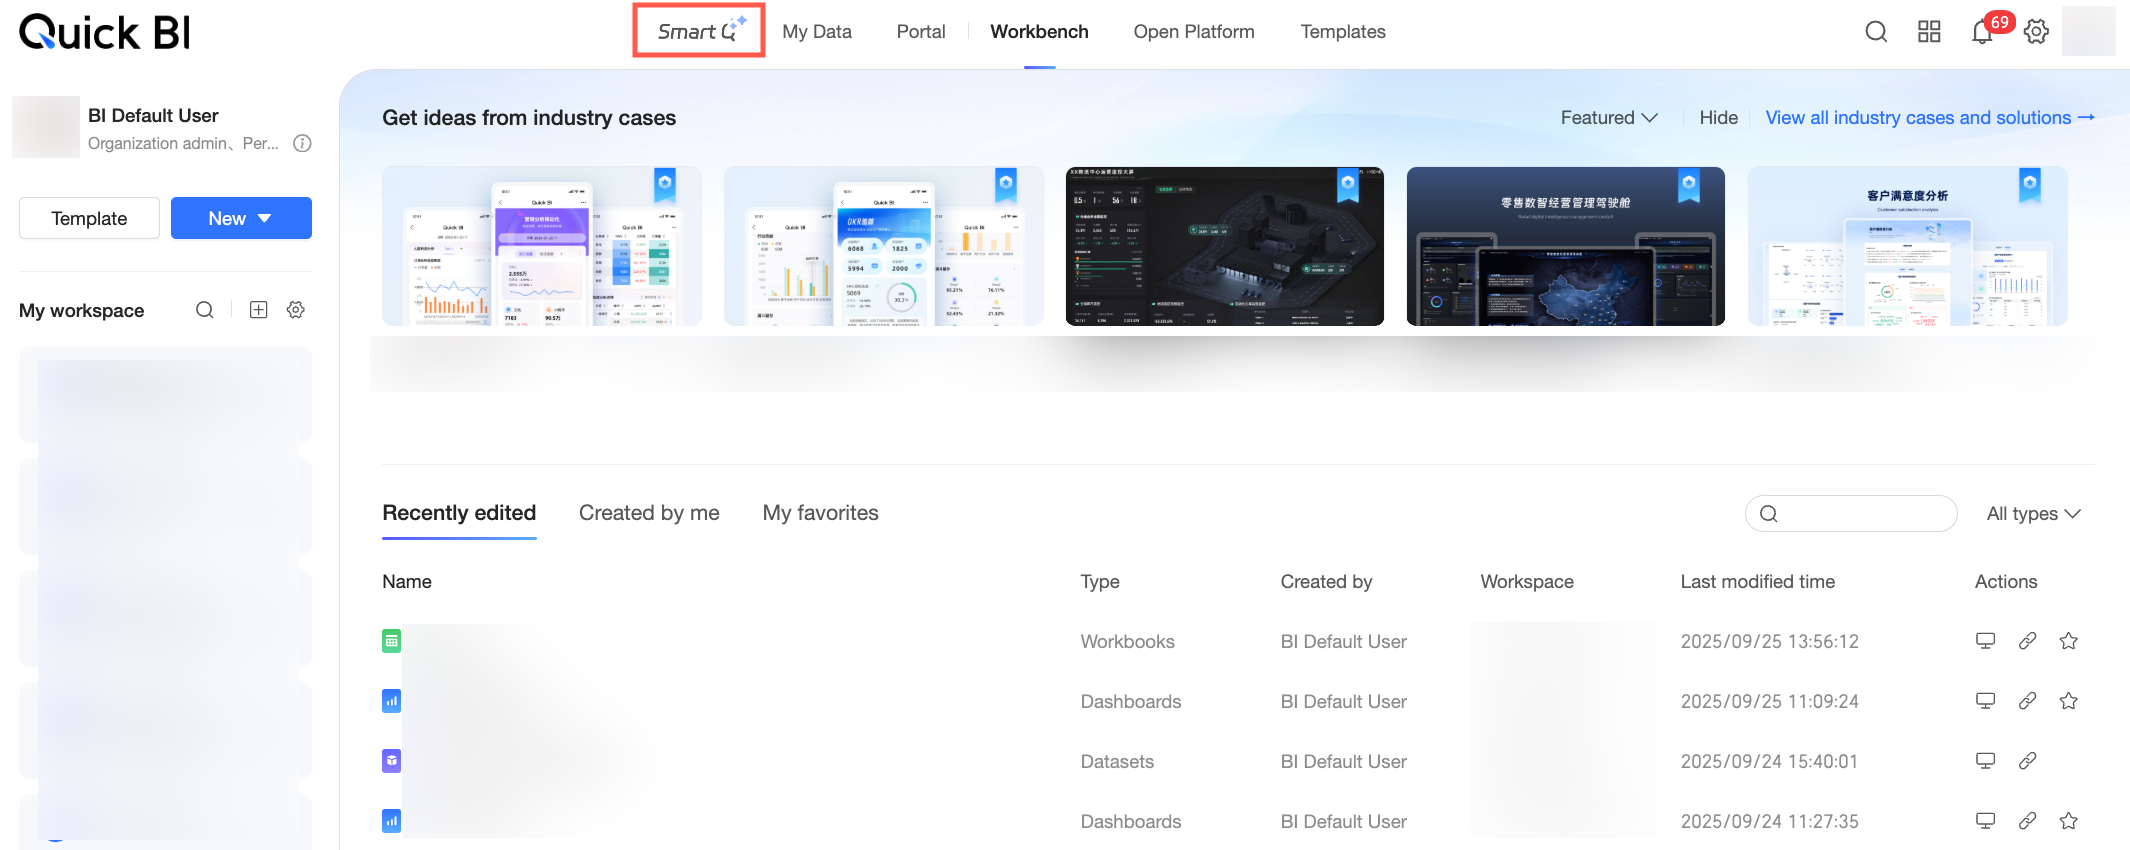
To generate a data report using a prompt or natural language, use one of the following entry points.
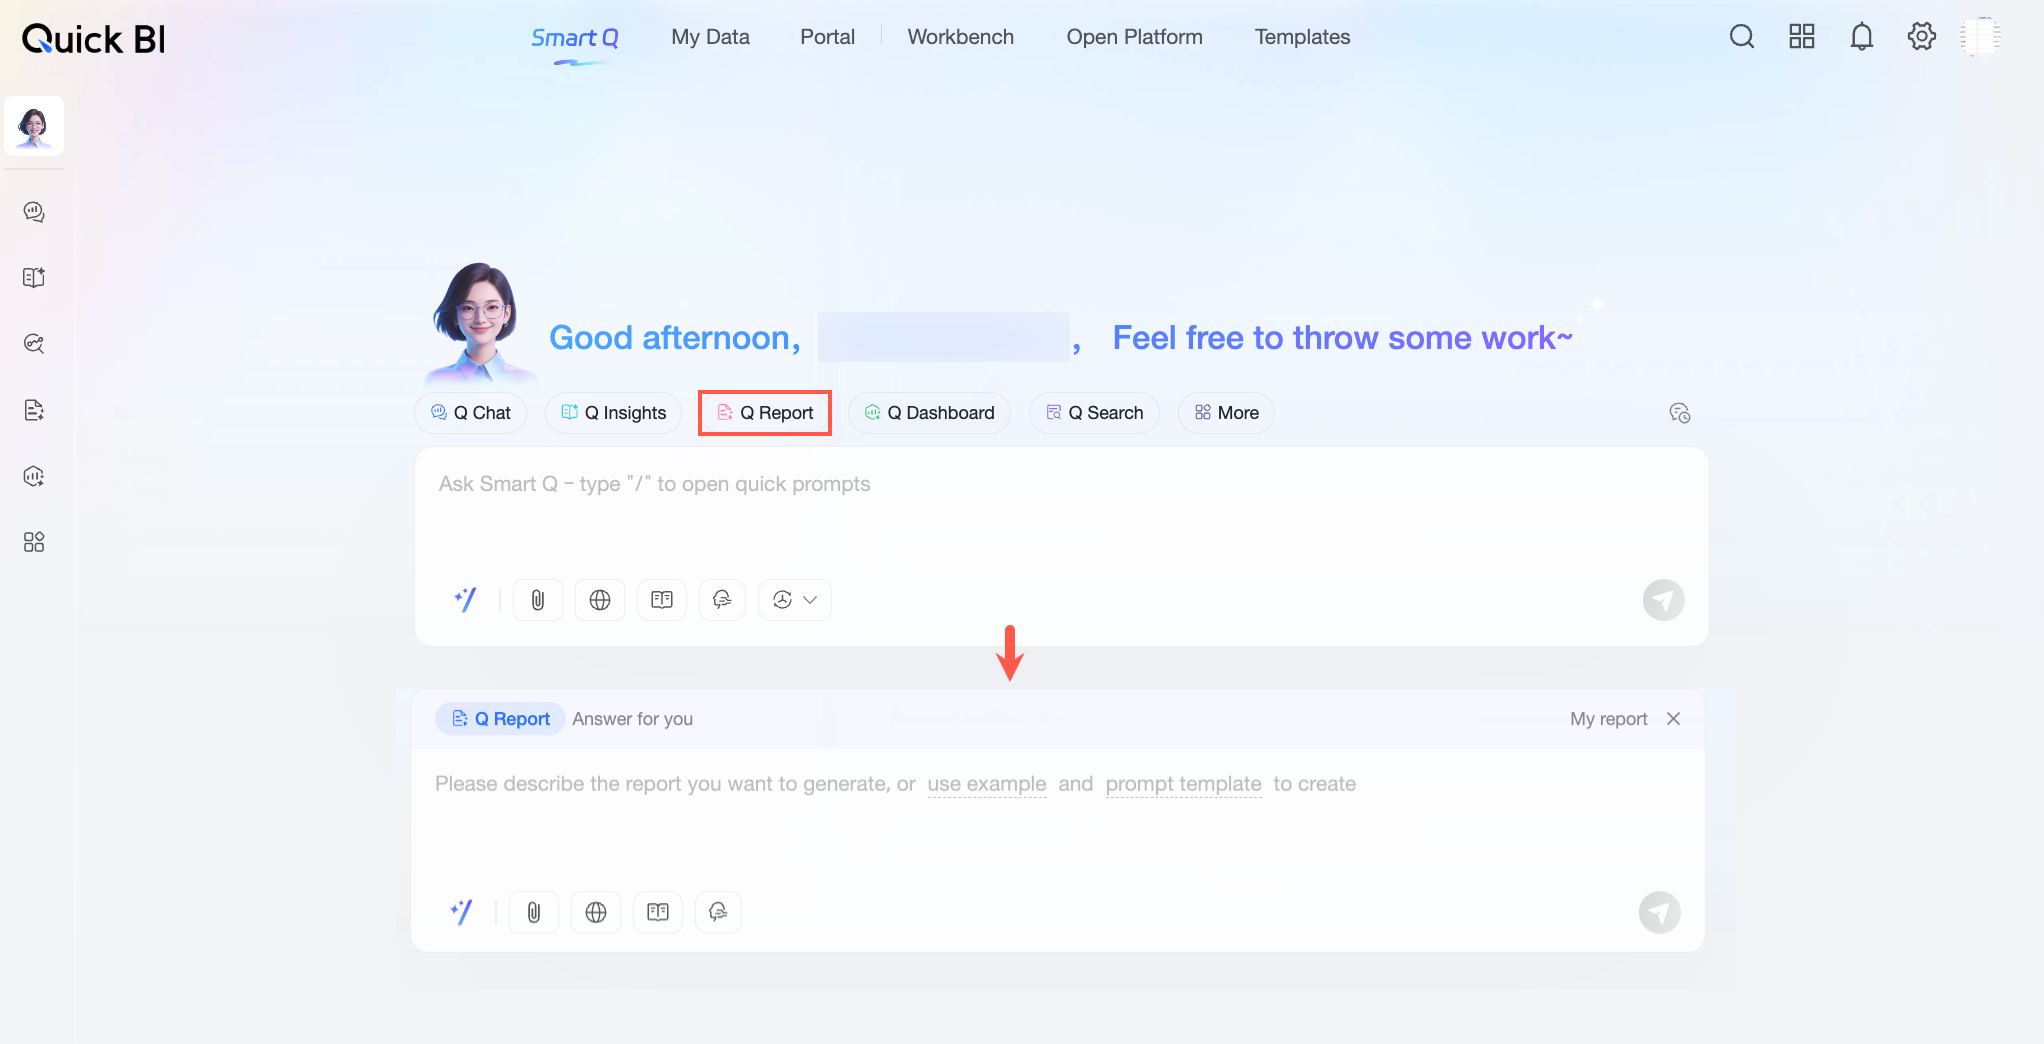
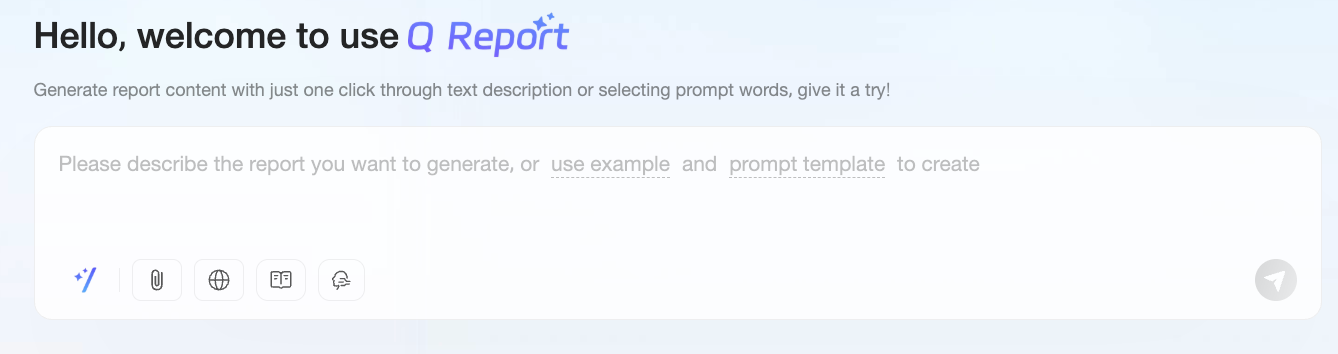
Entry point 1: On the Intelligent Q page, click the Q Report button above the main chat box. The chat box then switches to Q Report mode.
Entry point 2: On the Intelligent Q page, open the navigation panel by hovering over the left-side menu, and then click Q Report to navigate to the Q Report page.
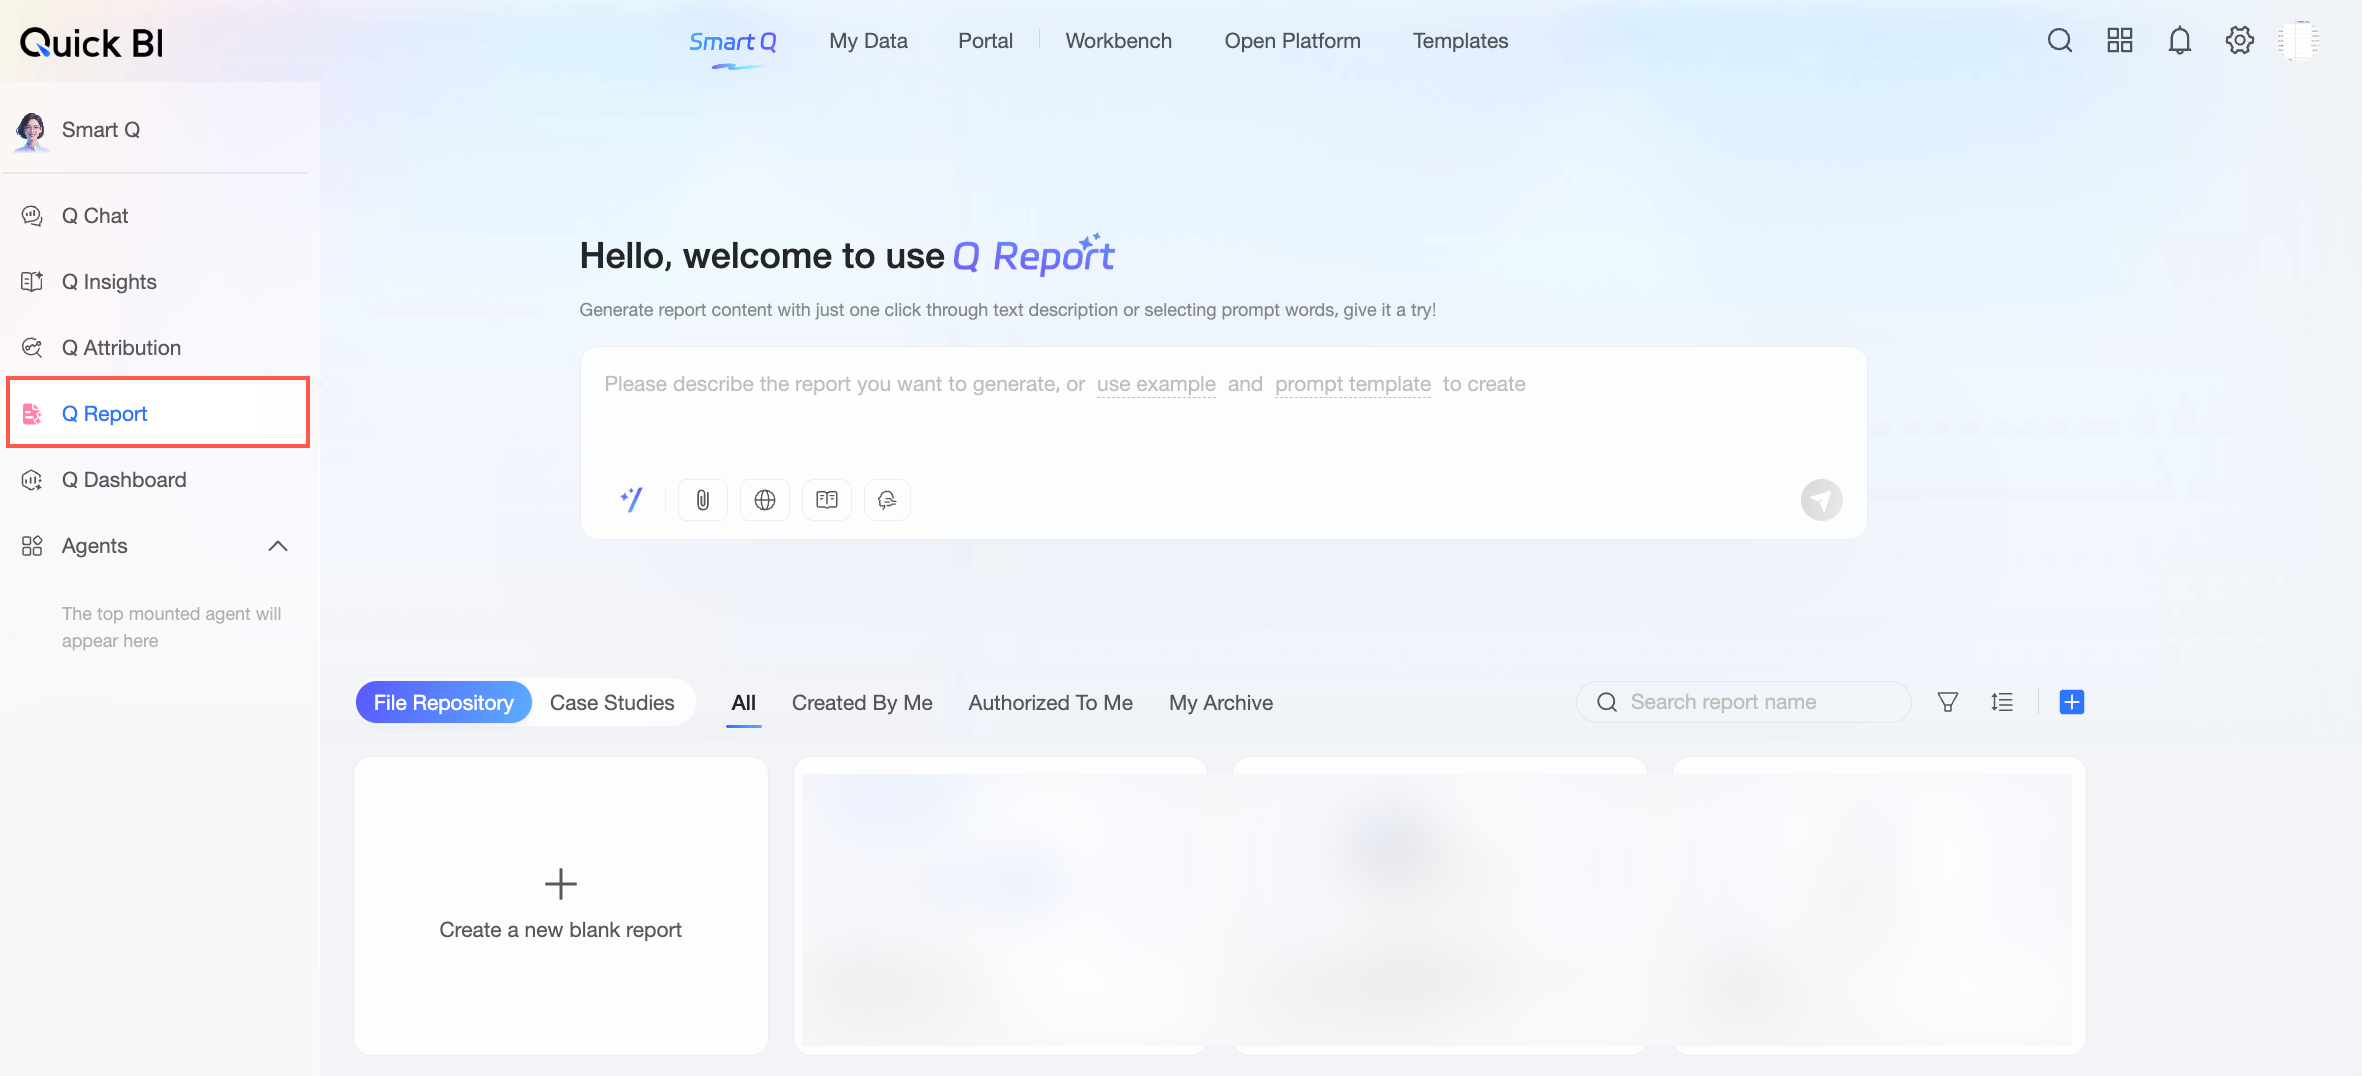
To create a data report from scratch, navigate to the Intelligent Q > Q Report page and use one of the following entry points.
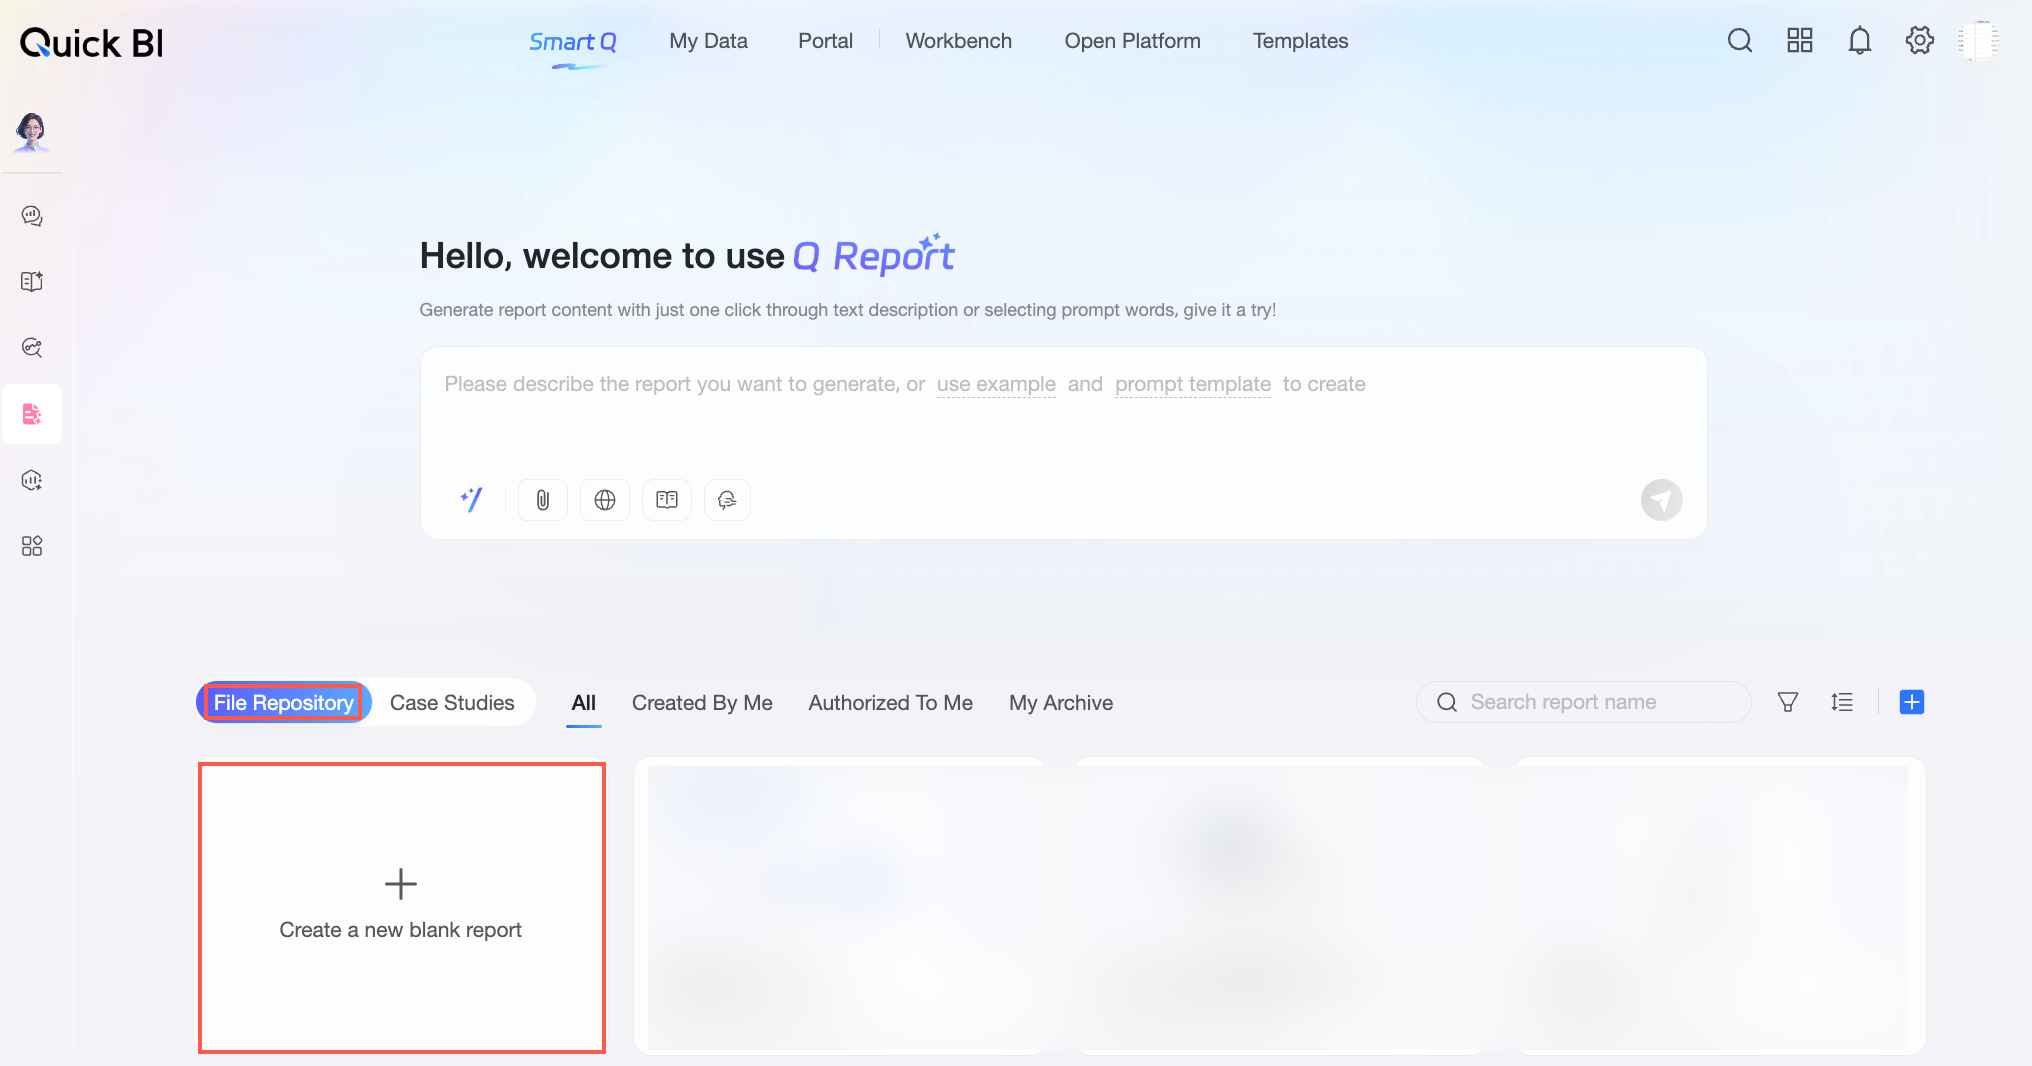
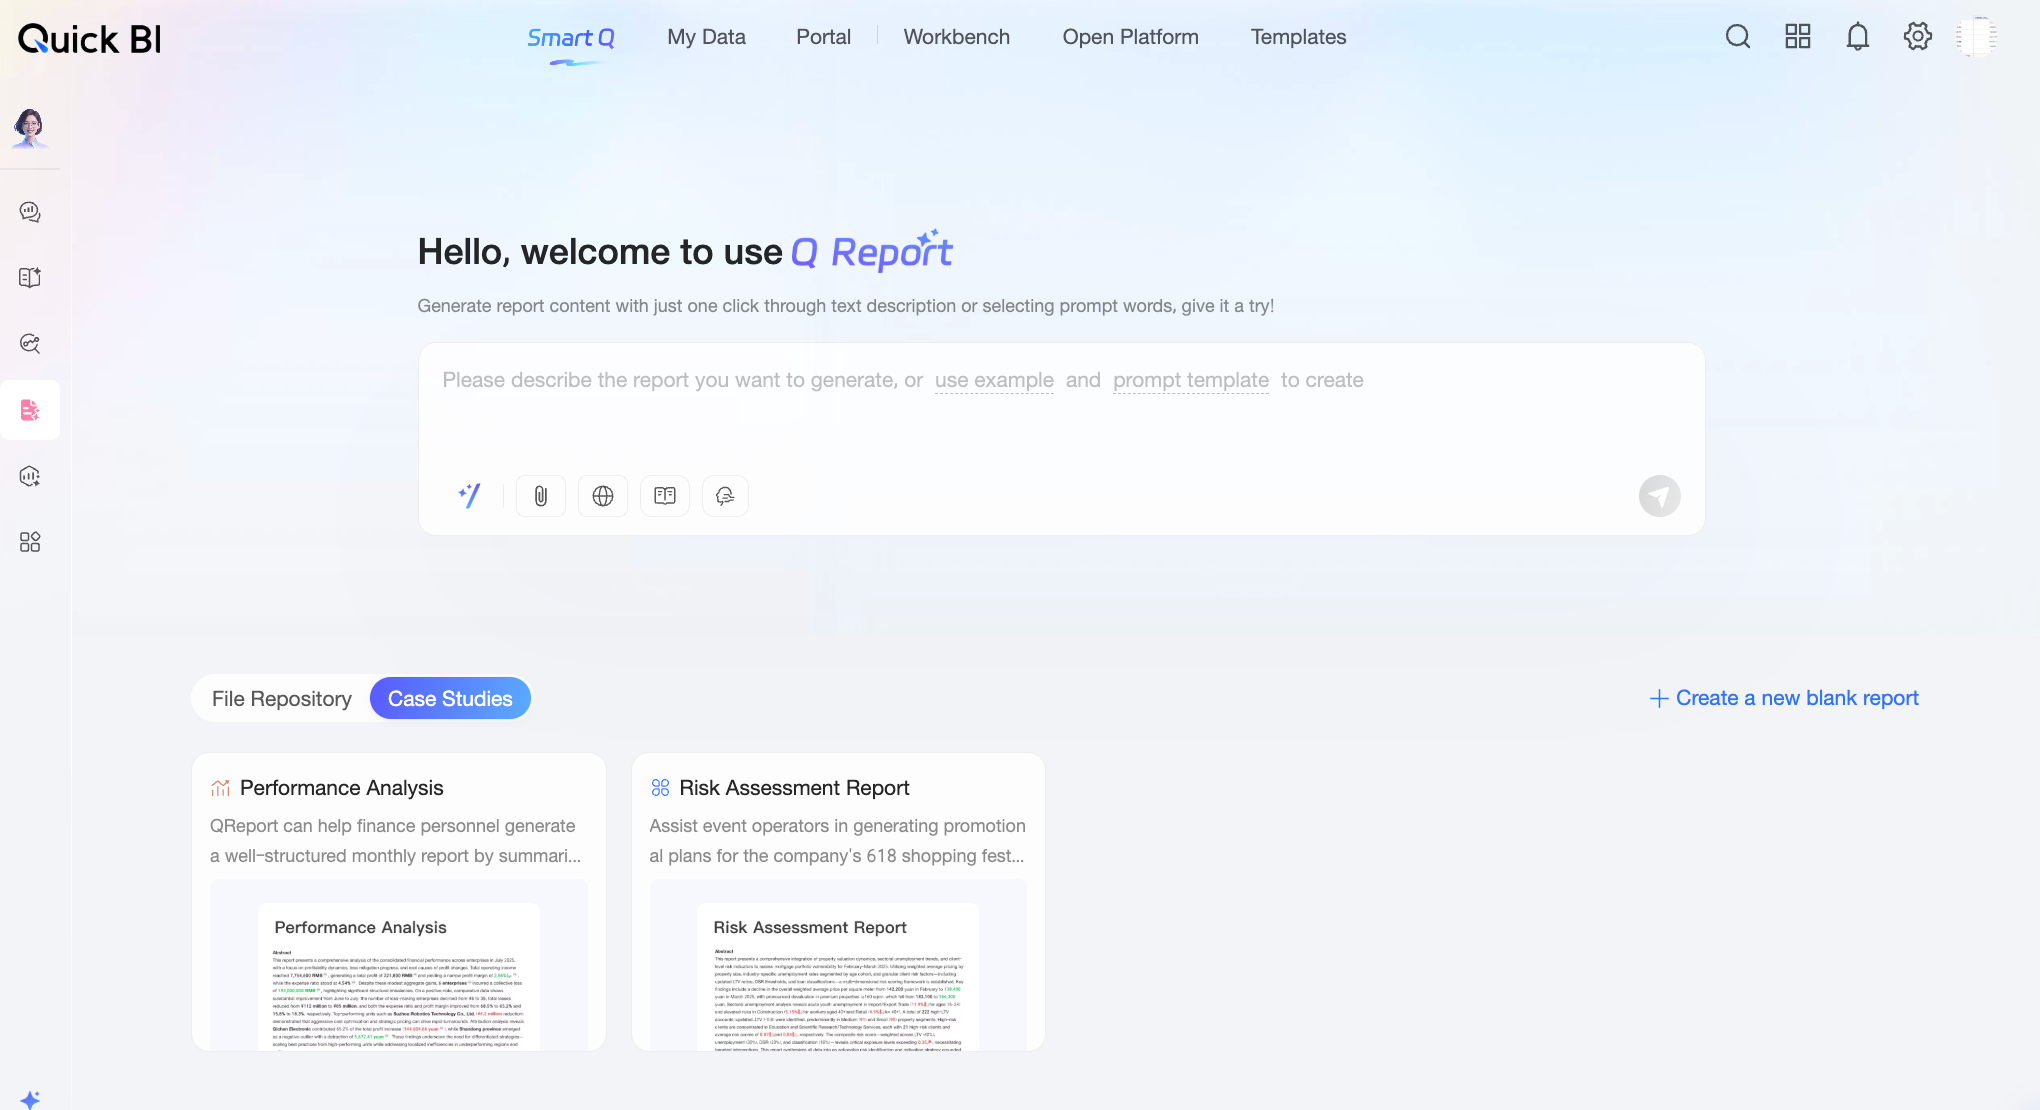
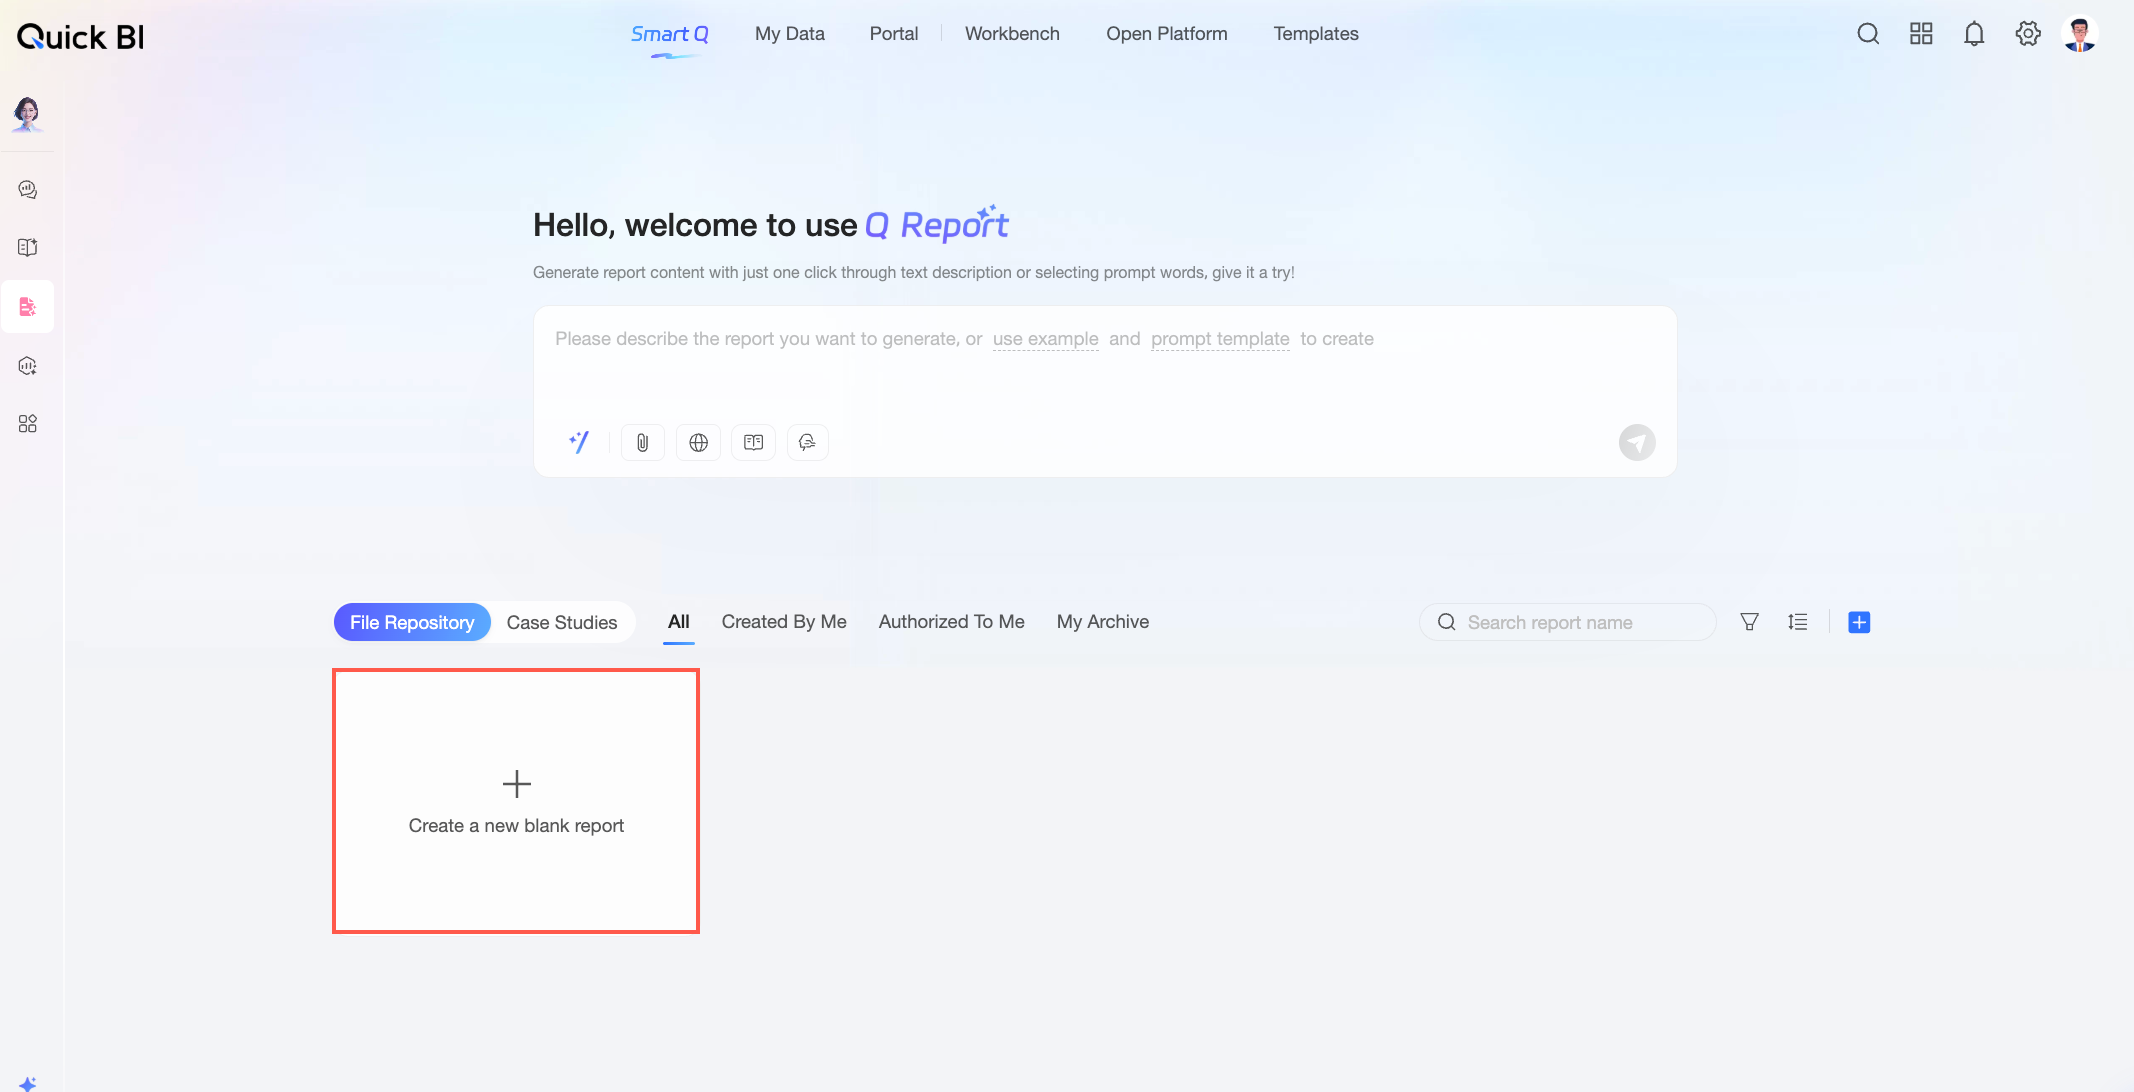
First-time users can explore sample cases based on real business scenarios to learn about the Q Report feature and then click Create Blank Report to create their own report.
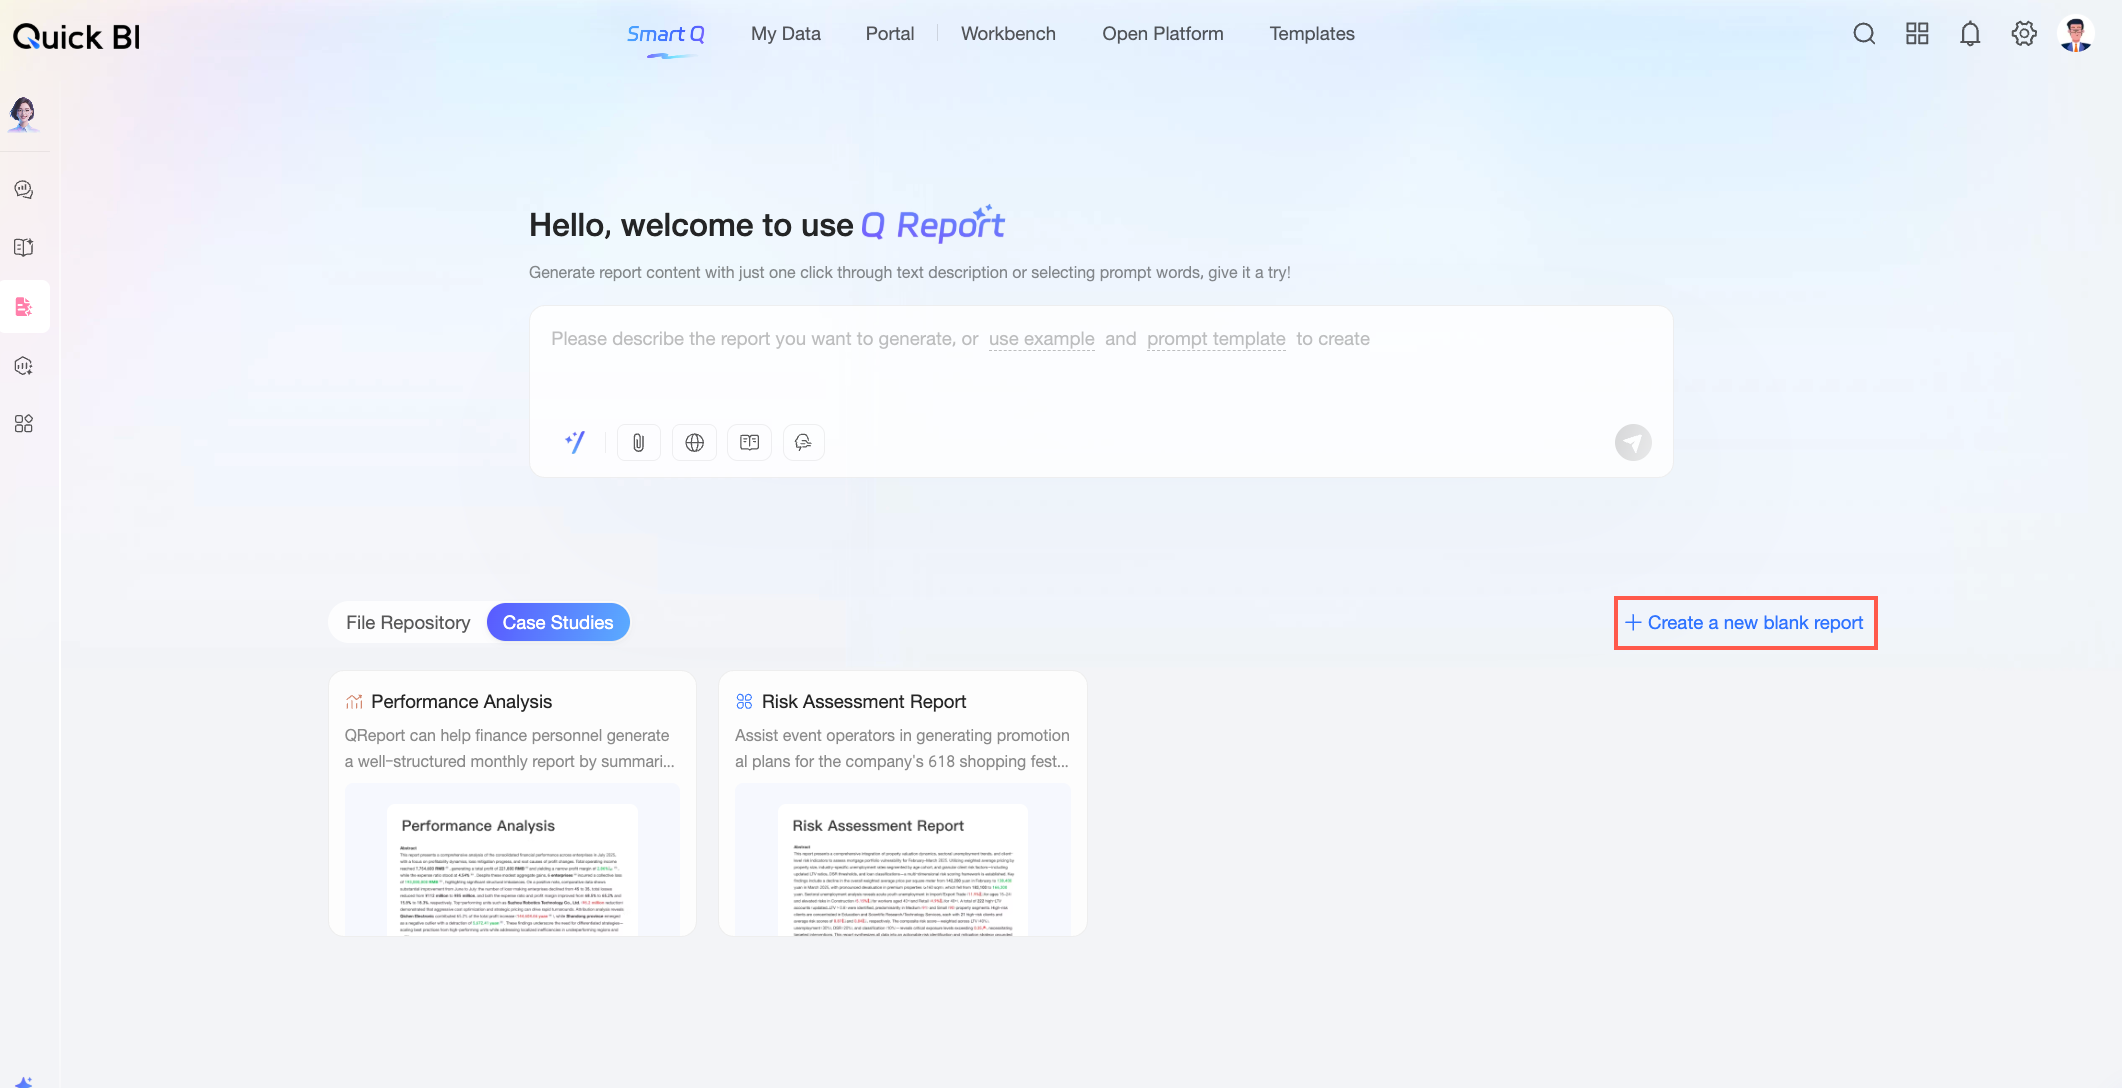
If you have existing reports, go to the Existing Reports tab and click Create Blank Report to create a new one.
Curated cases
Before you create your Q Report, you can browse the Curated Cases to learn from report examples based on real business scenarios. They demonstrate how Q Report works and the results it produces, helping shorten the learning curve and improve your efficiency. Whether you are a new user or looking to improve existing reports, the curated cases can help you better understand the feature's capabilities and find inspiration.
Procedure
You can choose how to create your report based on your needs.
Method 1: Generate a report intelligently
Use cases:
You need to process a large amount of data: Traditionally, building a report from large, distributed data requires manual collection, analysis, and organization. Q Report can automatically retrieve data based on your prompts, perform intelligent analysis, and generate a structured data report with a single click.
You need deep, domain-specific analysis: When you need deep insights in a specific domain, such as finance and business operations, traditional analysis often just lists data without connecting it to business scenarios, identifying root causes, or effectively predicting future trends. With Q Report's insight analysis capabilities, you can evaluate current operations, predict future trends, anticipate risks, and get recommended response strategies.
You need fast decision support: When management needs a quick overview of business status or project progress to make strategic decisions, or when business teams need timely risk updates, manual reporting is slow and can cause delays. Q Report can quickly generate a report from project data and automatically summarize key risks to provide timely support.
Follow these steps:
In the command dialog box, configure the following settings.

Input
Recommendations
Use example
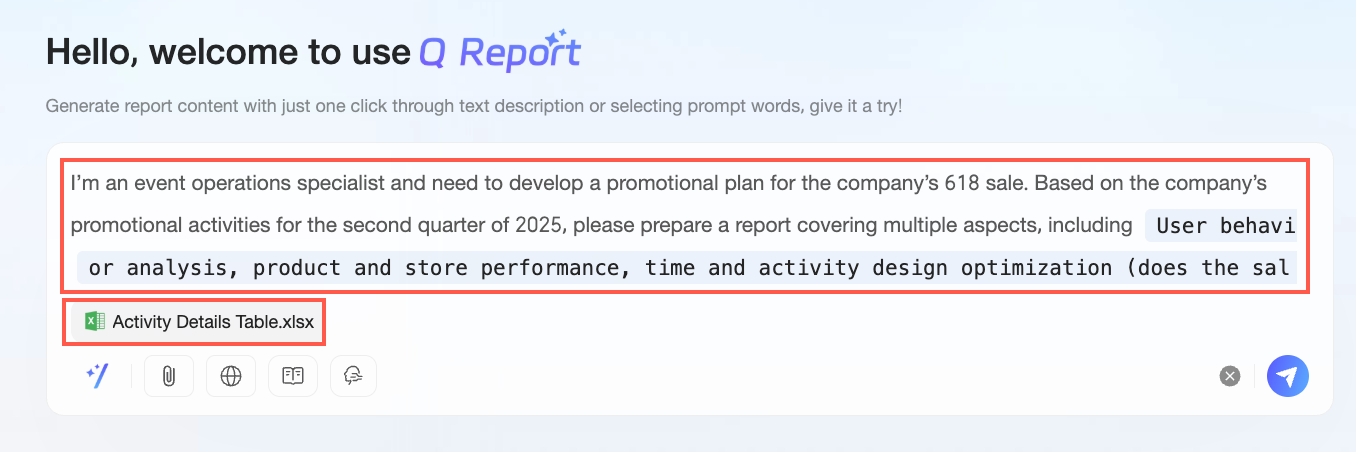
To quickly test the Q Report feature with ready-to-use data, click Use example in the dialog box to experience one-click report generation.
This action uses the 618 Promotion Optimization Analysis Report as a sample topic and automatically fills in a sample prompt and reference materials.
Prompt
Use a template
Quick BI provides built-in prompt templates for various scenarios, such as business operations analysis and weekly or monthly reports, to help you enter commands quickly. You can also review multiple templates to create a custom prompt that fits your business scenario and analysis needs.
In the dialog box, click prompt templates or click the
icon to open and select a template.After you select a template, replace the keywords with your business information to ensure the generated execution plan meets your requirements. For example, in the business operations analysis template, you can change the year to 2020 and add cost and profit analysis to the report content.
NoteYou can modify any part of the prompt template, not just the text in the blue boxes.
Use a custom input
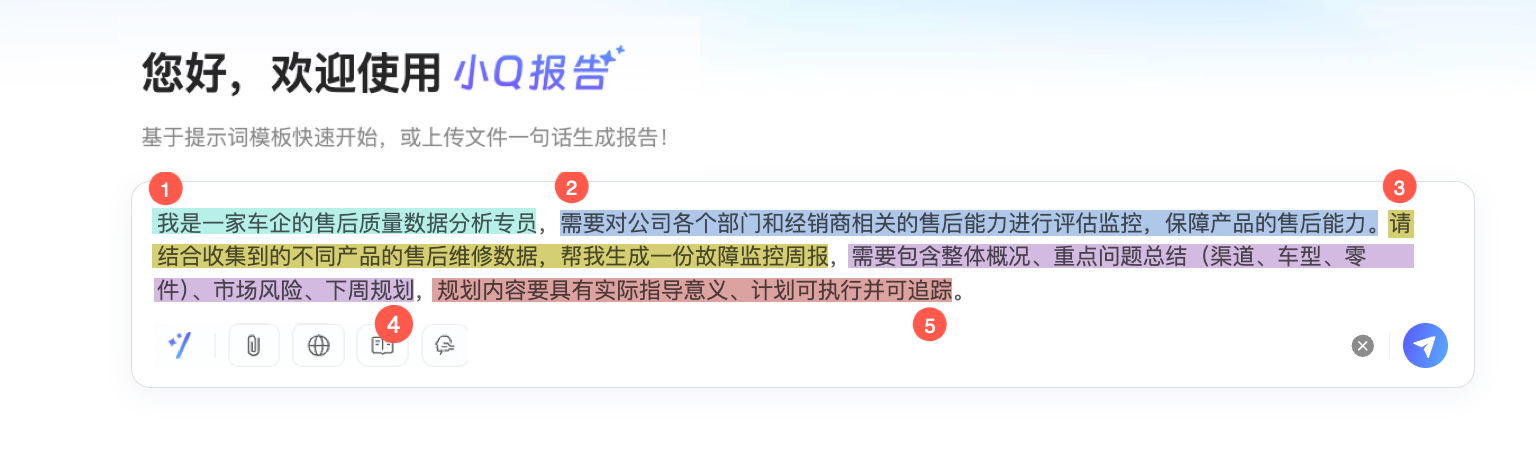
If the built-in templates do not cover your use case, you can write a custom prompt. After studying the templates to understand what information to include, write a command that fits your needs. For best results, we recommend including the following information in your prompt:
① Your role, such as analyst or operations specialist.
② The analysis scenario and goal, such as analyzing monthly business data to support finance and operations decisions.
③ The report type, such as a monthly report or a business operations analysis.
④ The desired report sections, such as a core metrics overview, root-cause analysis, and improvement proposals.
⑤ Any specific report requirements, such as providing practical guidance and an actionable, trackable plan.
Reference materials
Click the
icon to upload reference materials. The following material types are supported:Dataset: You can select up to three datasets that you have permission to use and that have indexed successfully.
Dashboard: You can select a dashboard or chart components within a dashboard as data sources for the report.
Local files: You can upload Word, Excel, CSV, and PDF files. You can upload up to five files, and each file must be 10 MB or smaller.
NoteBefore you can upload a dataset, you must complete the following two steps. Otherwise, the dataset will not be available in the Select Dataset dialog box.
① The dataset has been indexed in the Q&A configuration. For more information, see Q&A configuration.
② You have Q&A permissions for the dataset. For more information, see Q&A permission configuration.
You can upload different types of reference materials at the same time. For example, you can add a business dataset for the main analysis and upload a Word document to supplement the business logic.
If you add a dashboard as a reference material and filter data in a selected chart component, the report is generated based on the filtered data. For example, if you filter a 2025 sales details table to show data from January to June for a first-half sales analysis, the report will be generated based on this filtered data.
Content beyond the first 10 sheets is ignored.
To ensure the system can process your materials effectively, follow these suggestions:
In Excel, store your business data, such as campaign or sales details, as structured tables. This helps the system better recognize and retrieve the data.
In Word, store information like business logic and calculation formulas, such as marketing campaign formulas or business analysis logic. This helps the system understand your business logic and generate more relevant reports.
Web search
Enable this option to allow the large model to access the internet for external information during its reasoning process.
If you enable web search, the large model can incorporate the latest market data and industry trends to enrich the report and keep it up to date.
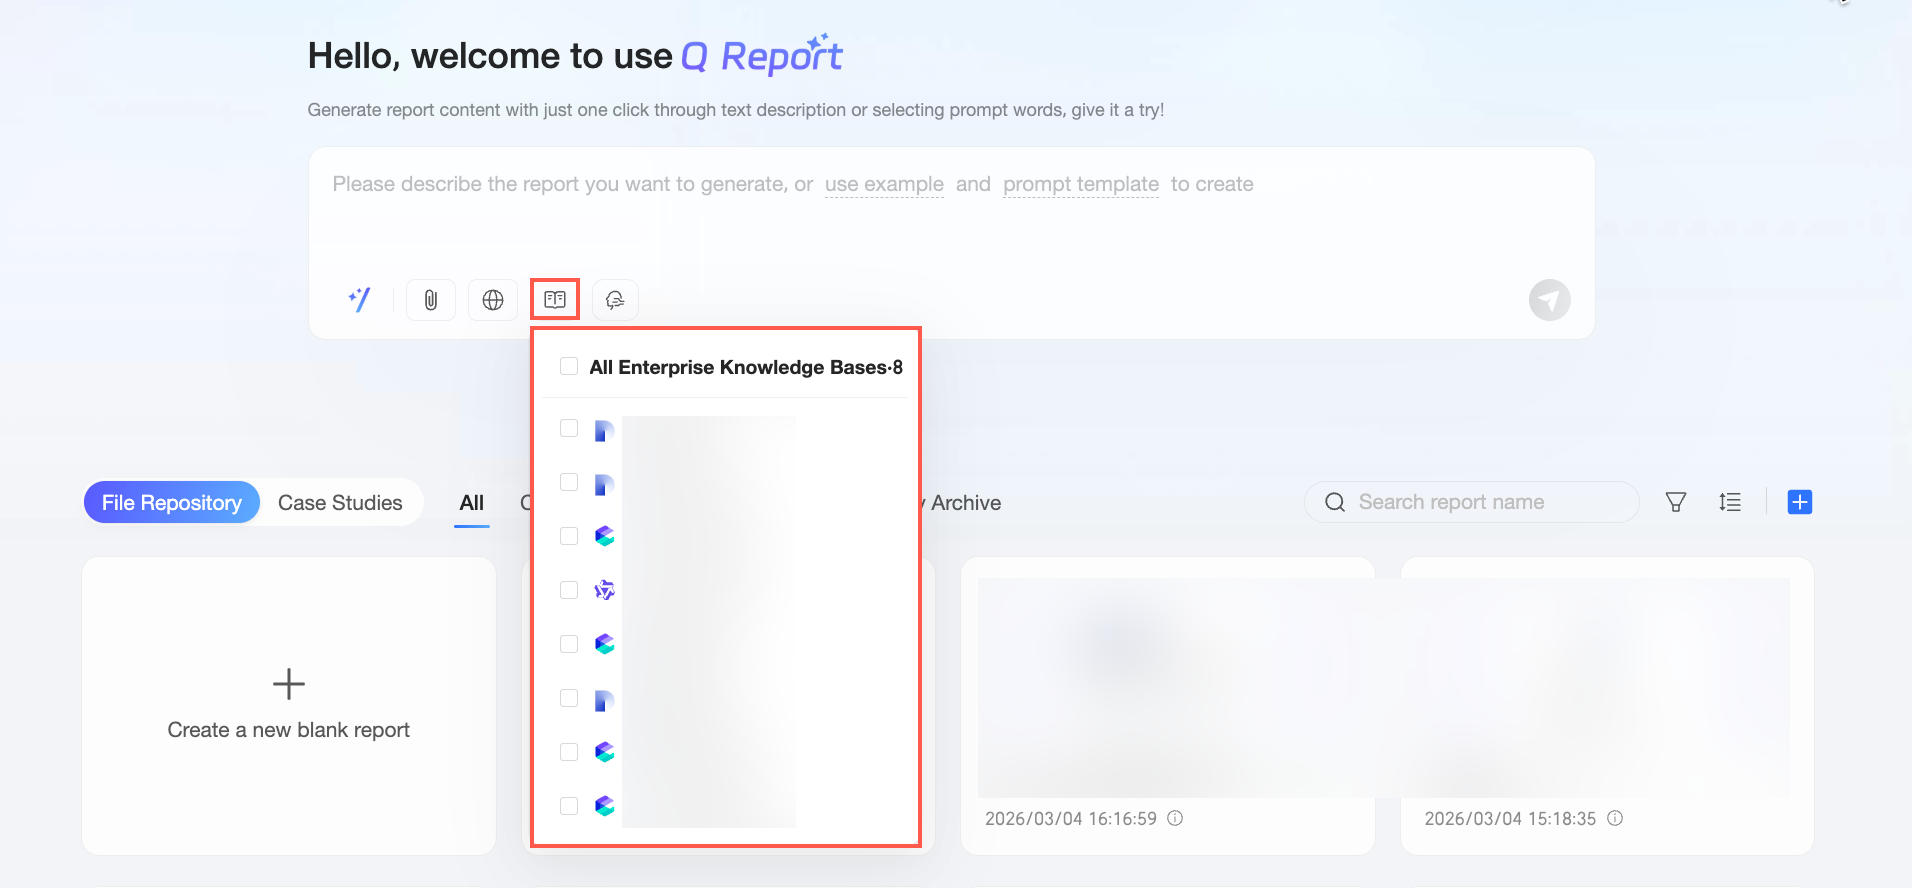
Enable enterprise knowledge base search
Select whether to enable searching the enterprise knowledge base. If enabled, you must also specify which knowledge bases to associate.
When this feature is enabled, the large model can use business information from the associated knowledge bases to generate reports that are better aligned with your company's business context and management logic.
NoteAn organization administrator must first configure and enable a knowledge base in Organization Management before you can select it here. For information about how to configure a knowledge base, see Knowledge Base Management.
Analysis logic
Select whether to specify the analysis logic.
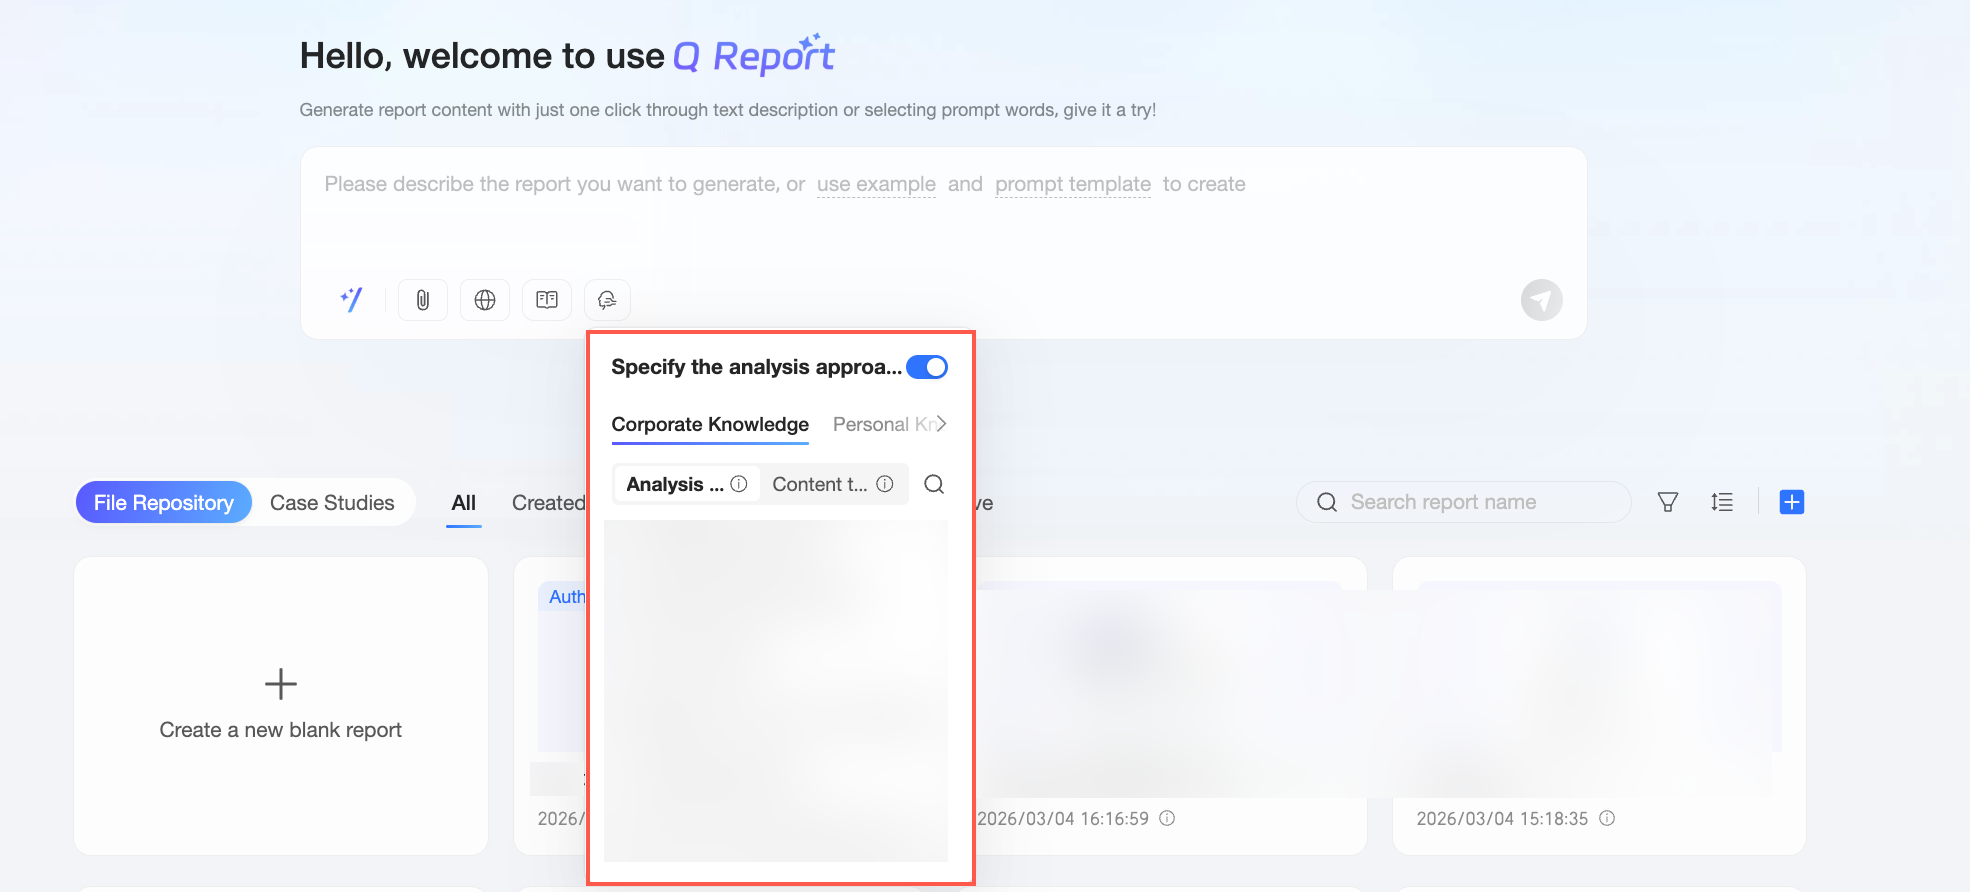
Enterprise knowledge
The Enterprise Knowledge tab displays common knowledge configured and maintained across your organization. This helps standardize data analysis methods and content structure, ensuring that reports generated by different members meet organizational standards.
You can select the analysis logic or content template that you need.
Analysis logic: Select this option to specify only the analysis logic. By configuring the analysis logic, you can guide the system to generate report content that aligns with your company's analysis methodology, avoiding generic results that are irrelevant to your business.
In this case, the large model determines the report's layout and structure. If you have specific requirements for the presentation, switch to the Content Template tab and select a template, or define the structure by using a prompt or uploading an attachment.
Content template: Select this option to specify both the analysis logic and the output structure. By setting a content template, you can pre-configure standard report frameworks in the system and ensure the analysis logic aligns with your expectations.
Click the
icon next to an analysis logic or content template to preview its details in the Specify analysis logic dialog box.NoteIf you do not specify an analysis logic, the large model will plan the analysis based on your prompt.
An organization administrator must first configure and enable an analysis logic or content template in Organization Management before you can select it here. For information about how to configure these items, see Knowledge Base Management.
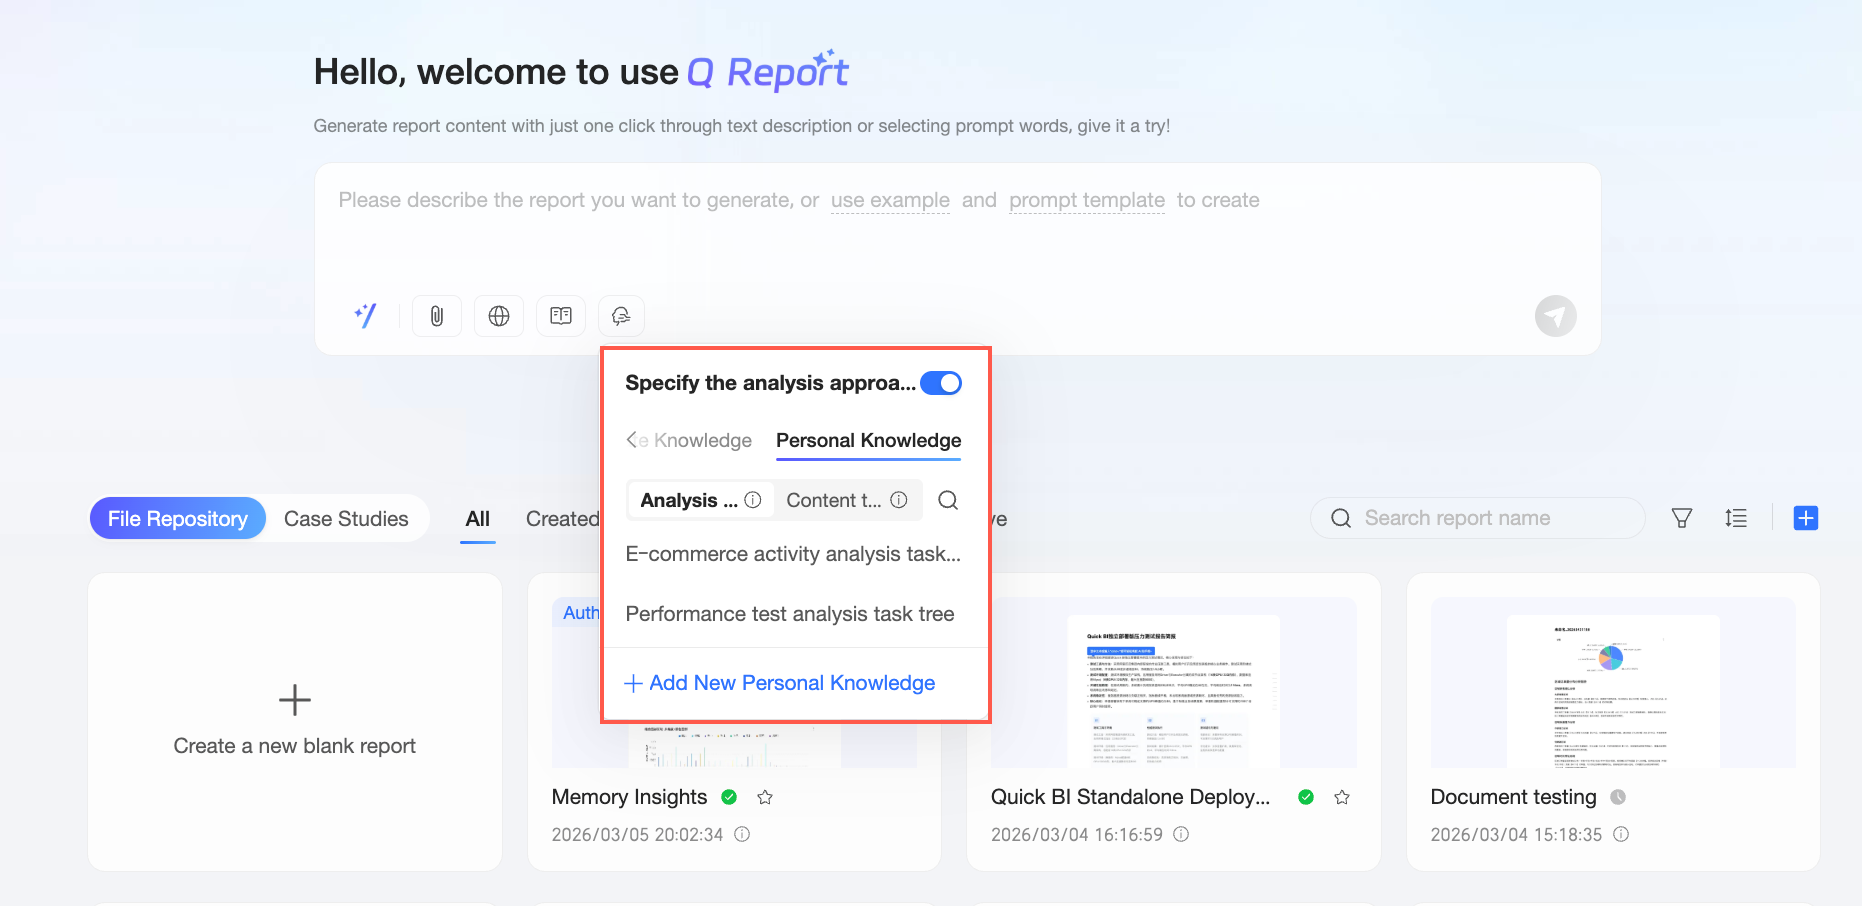
Personal knowledge
The Personal Knowledge tab displays private knowledge that you have uploaded to your account, including analysis logic and content templates. You can upload your personal knowledge, based on your role and experience, as local files and apply it when generating reports. This makes the generated content more relevant to your individual work needs and perspective.
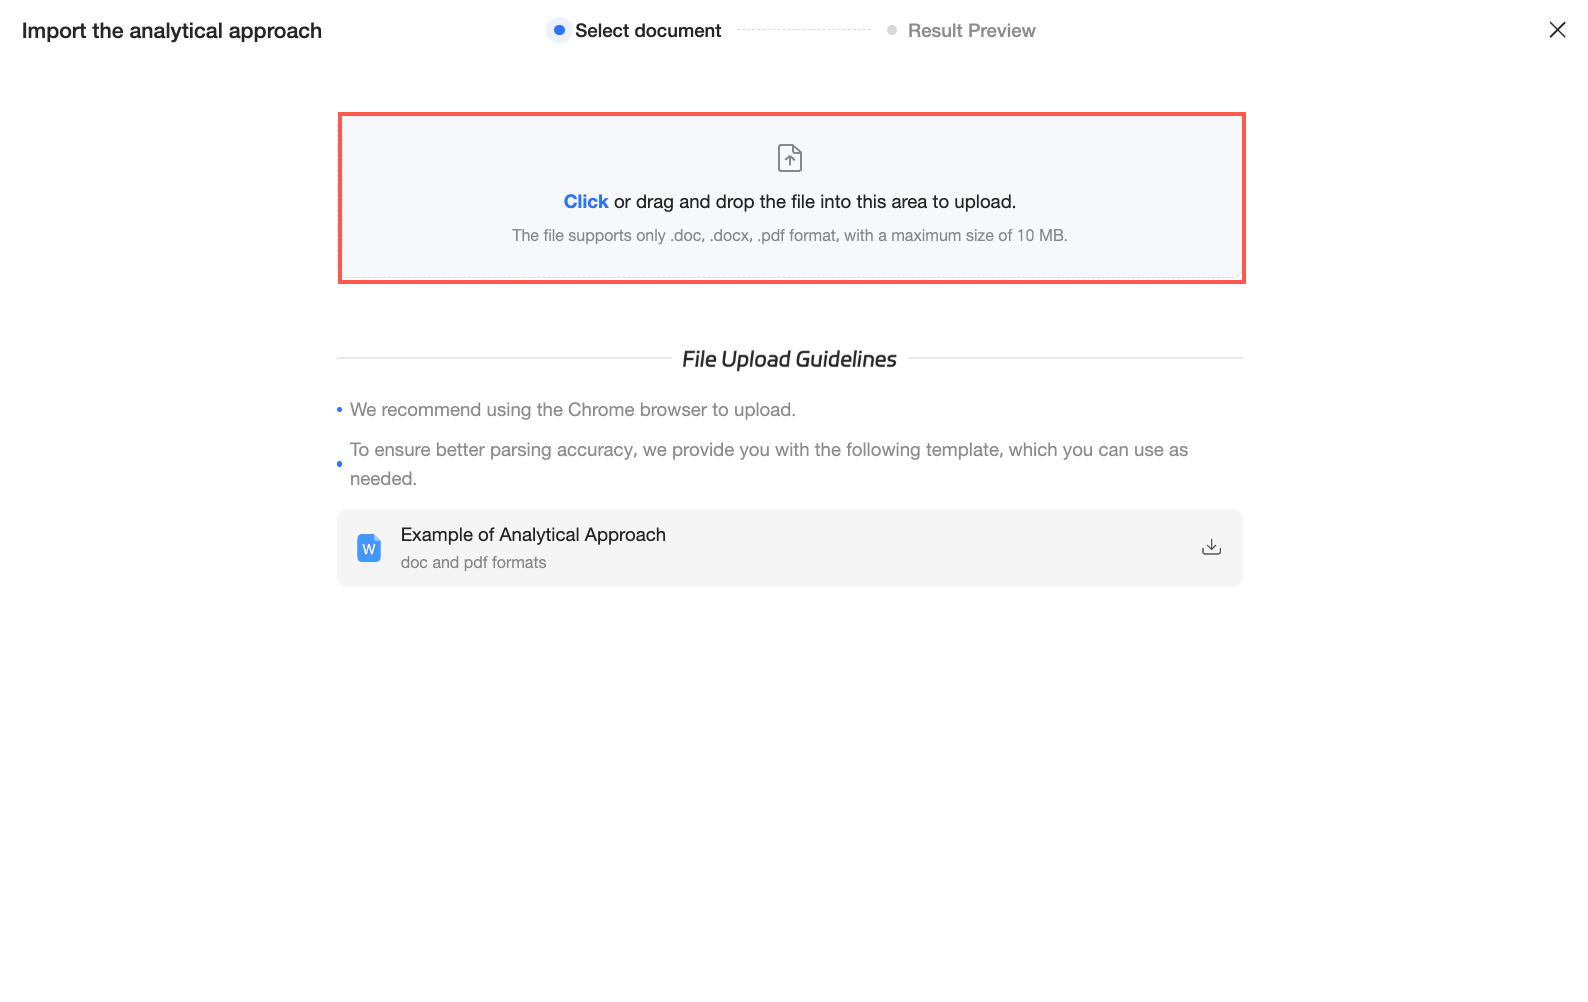
Click Add content template/Add analysis logic to add new personal knowledge. You can import from an existing file or add it manually:
Click Import from existing document and upload a knowledge file in the dialog box.
NoteOnly .doc and .pdf files are supported, and the file size must be 10 MB or smaller.
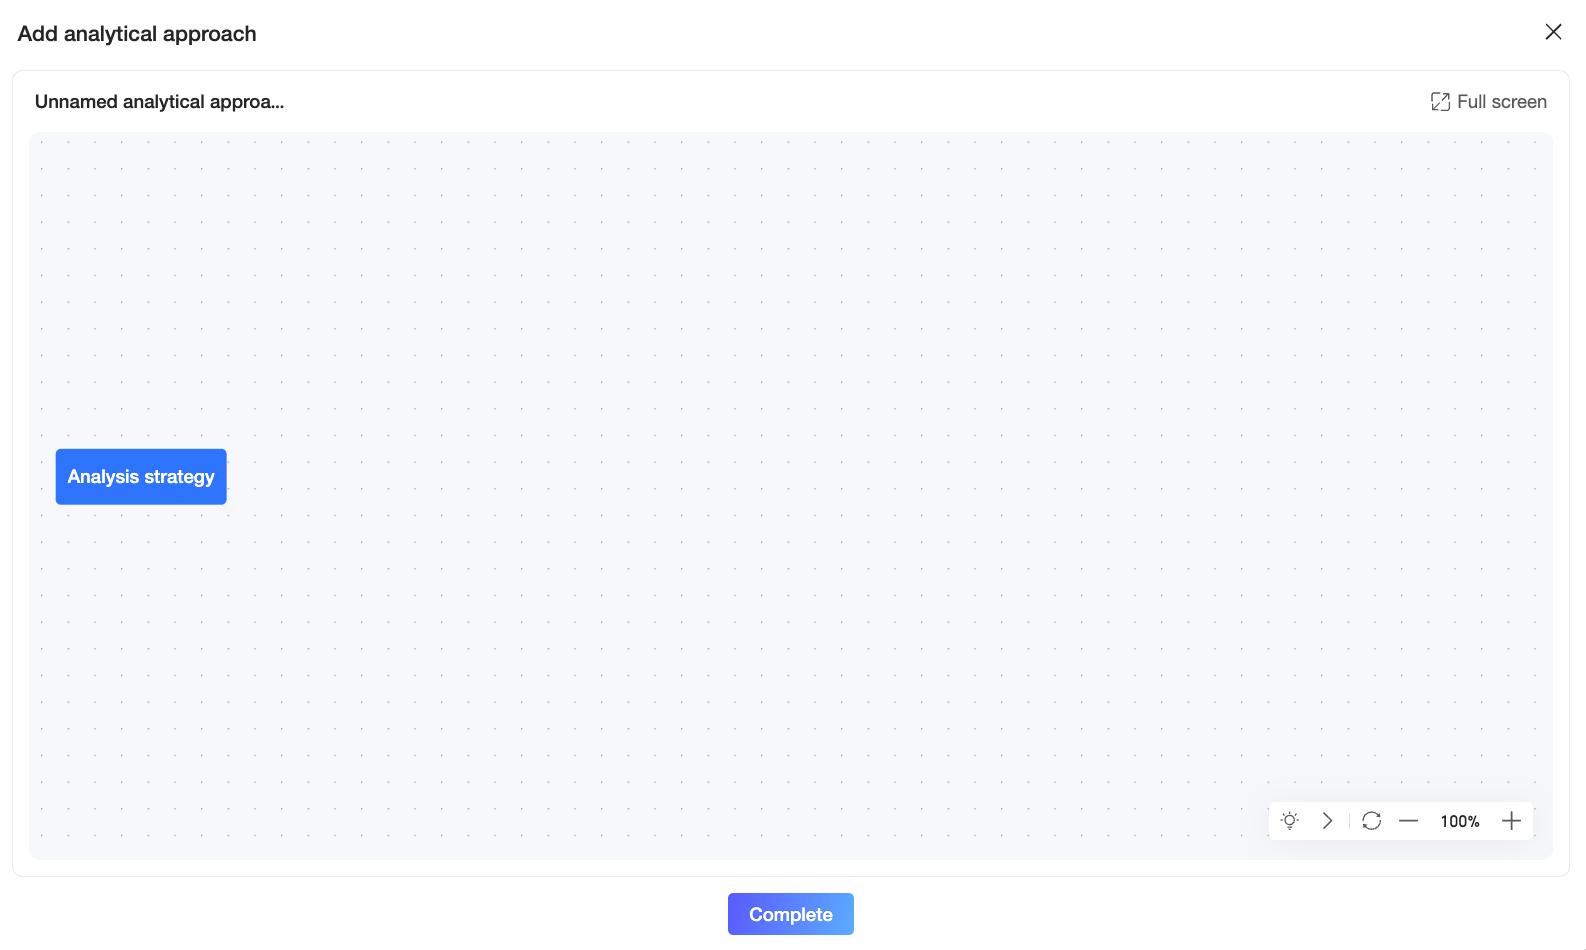
After the system parses the file, a preview is displayed. Review the uploaded content, make any necessary edits, and then click Finish.Click Add manually, enter the knowledge content in the dialog box, and then click Finish.
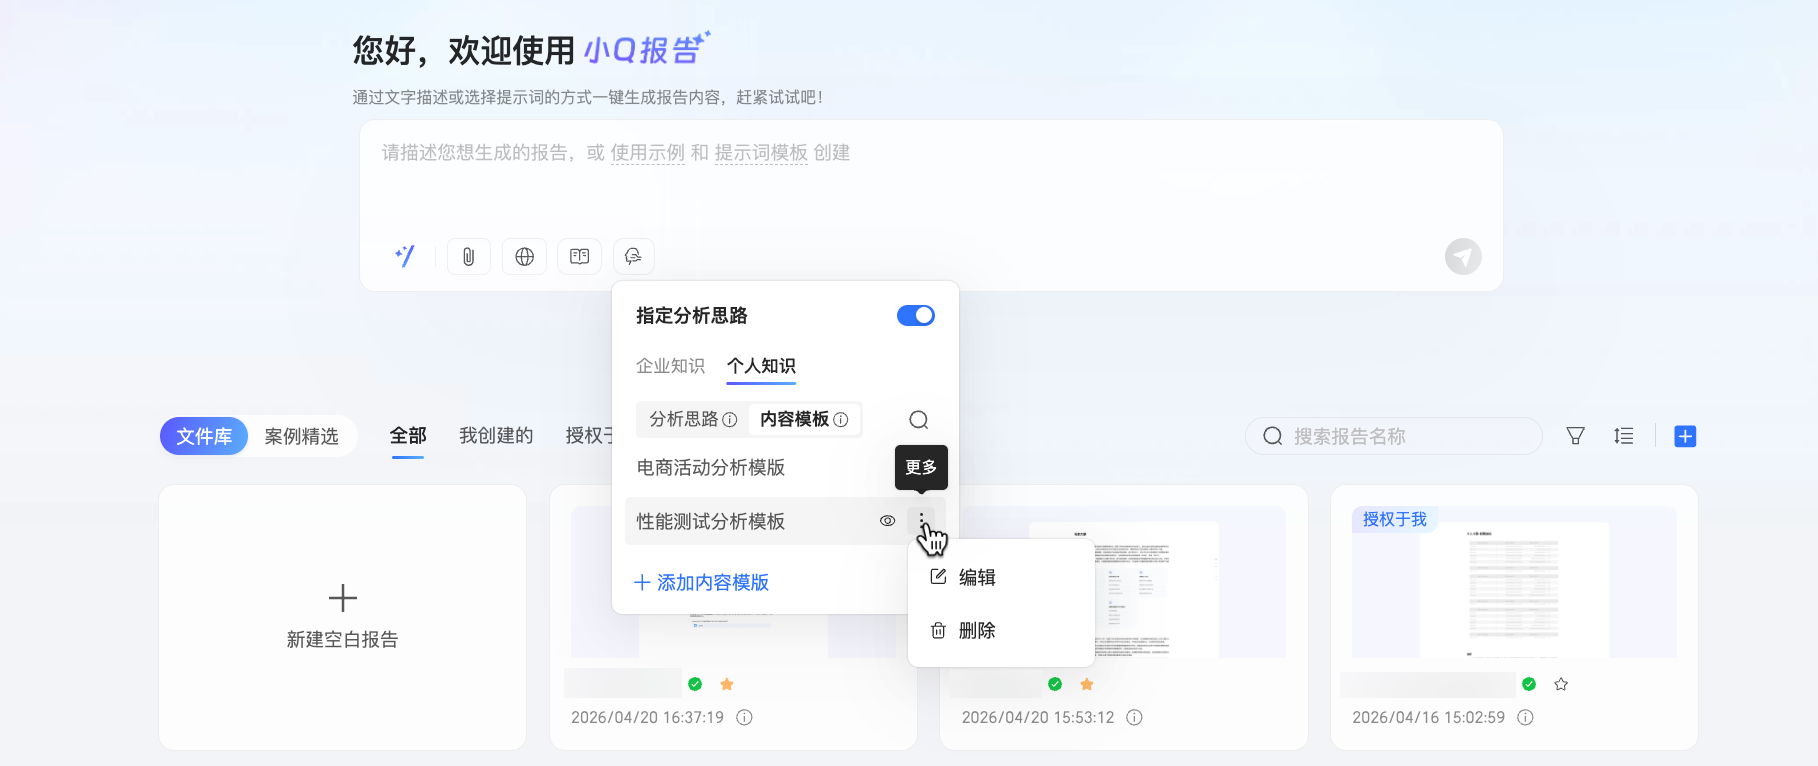
After the knowledge is added, it appears in the personal knowledge list. You can perform the following actions:
Select a knowledge item to apply it during report generation.
Click the
icon and enter a keyword in the search box to quickly find a specific knowledge item.Click the
icon to preview the knowledge details in the Specify analysis logic dialog box. You can also edit, delete, or add knowledge from this dialog box.Click the
icon to edit the knowledge content in the editing dialog box.Click the
icon to delete knowledge that is no longer needed.
NotePersonal knowledge is private to its creator and is not visible to other members of the organization. It is not synchronized with the enterprise knowledge base in Organization Management.
If a report creator shares a report generated with personal knowledge and grants editing permissions to another user, the authorized user can update data and regenerate the report within that report. However, the authorized user cannot use the creator's personal knowledge for other operations, such as one-click report generation outside the original report.
Click the
icon in the lower-right corner of the dialog box to send the command. You are then redirected to the execution plan generation page, where the plan begins to generate. If you no longer need the plan, click the icon to stop the generation.NoteQ Report supports asynchronous generation. For more information, see Asynchronous generation in this topic.
 icon to upload reference materials. The following material types are supported:
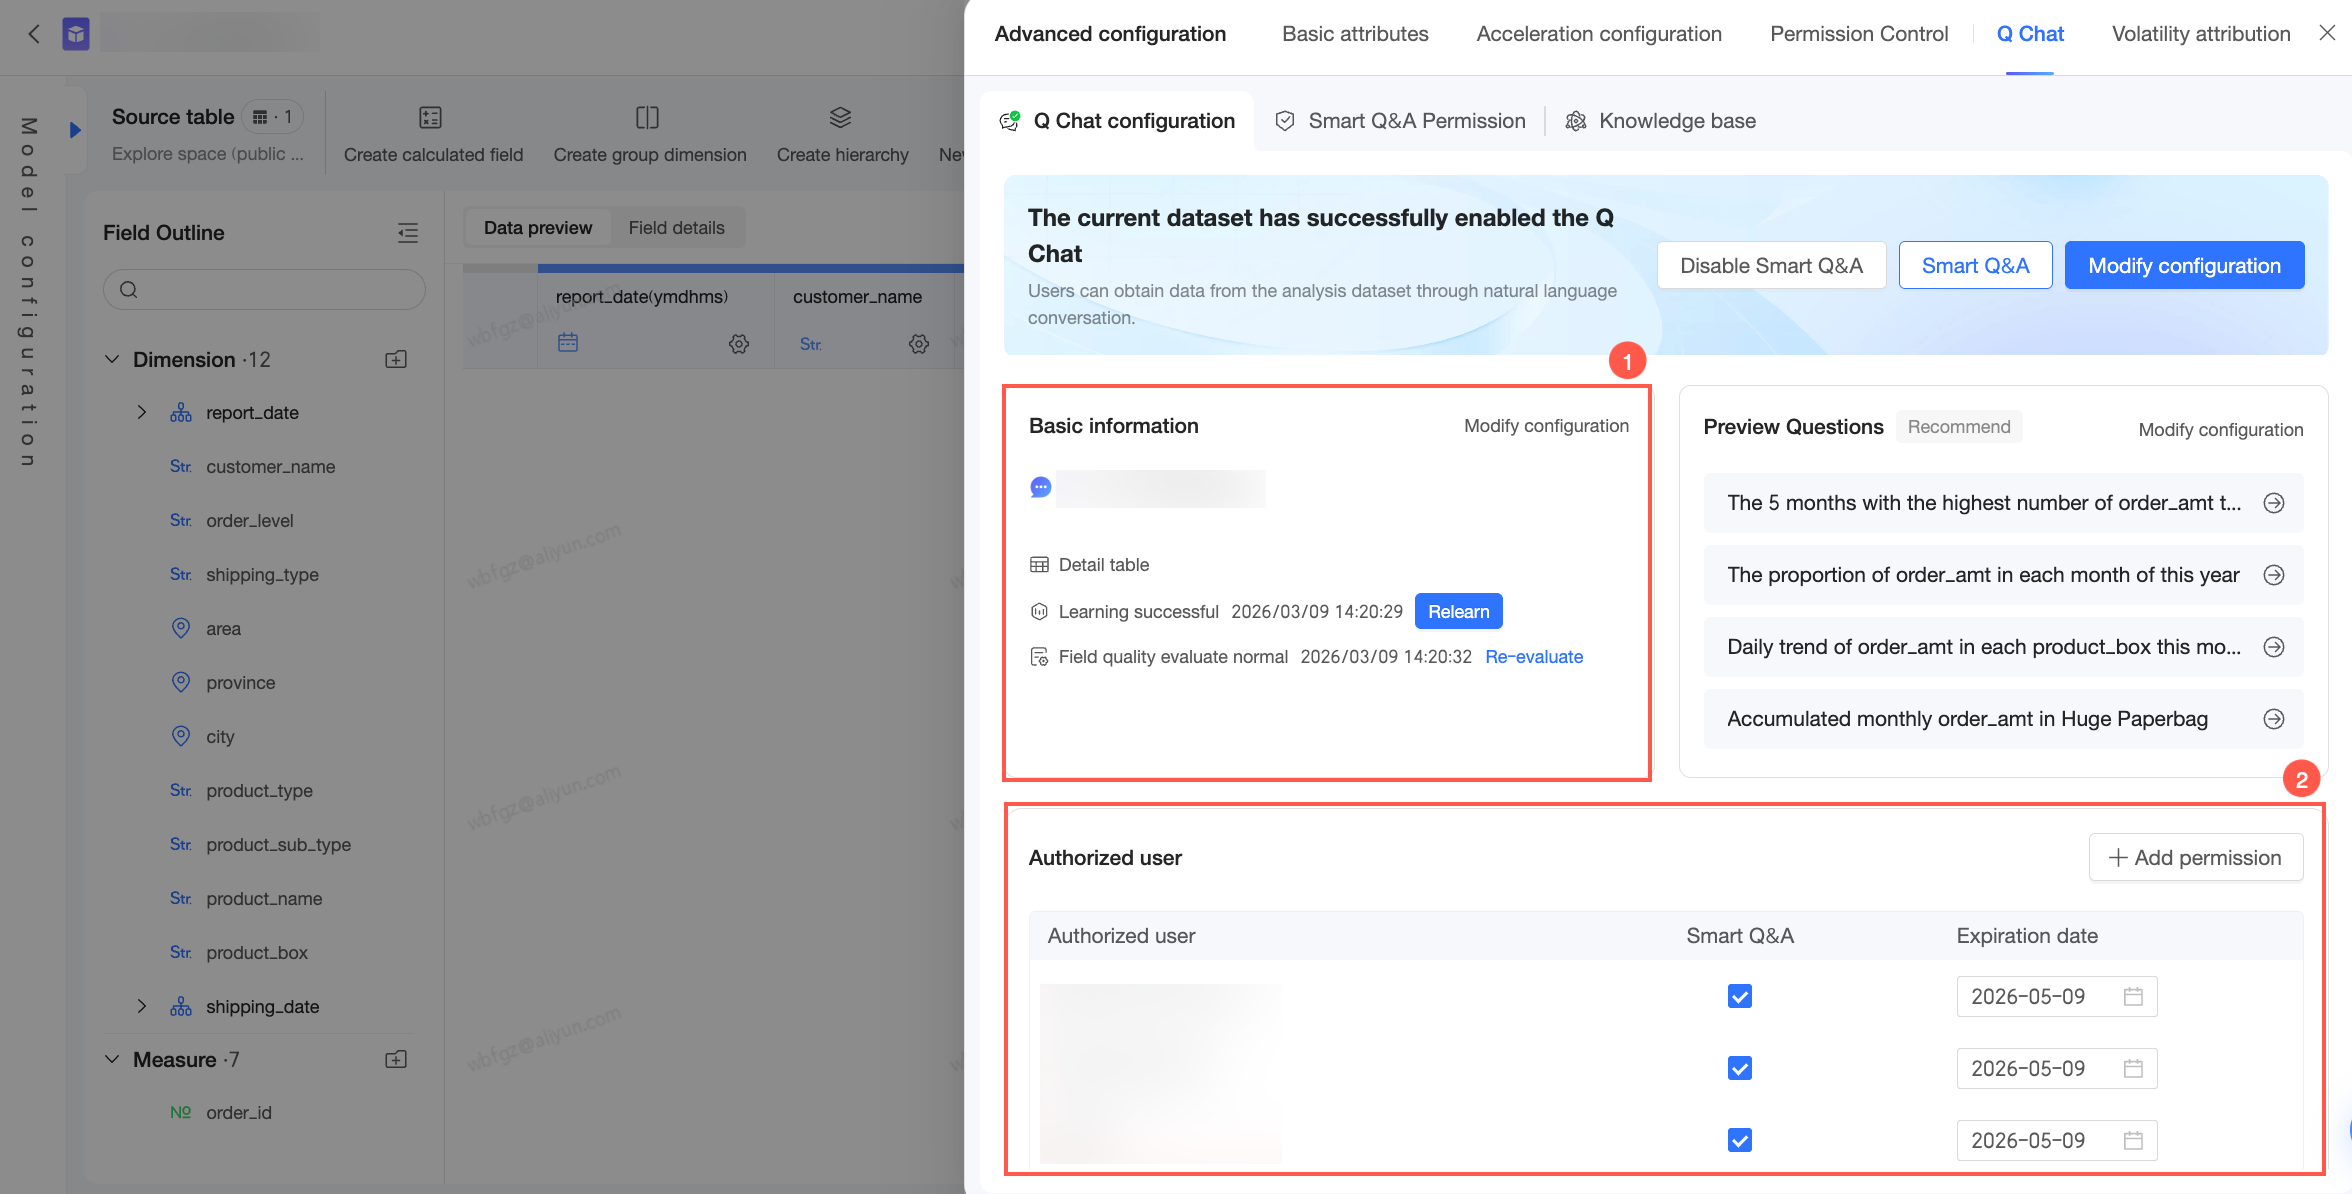
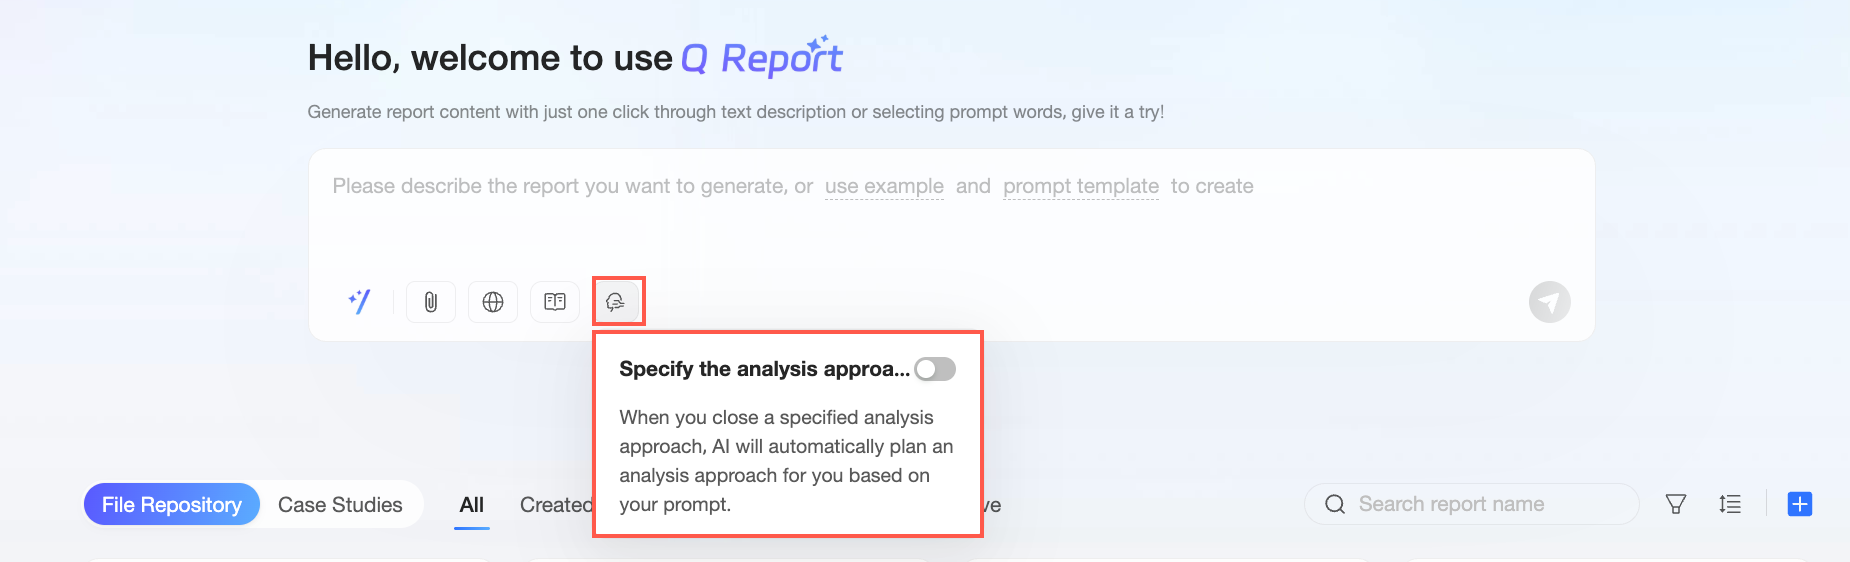
 icon next to an analysis logic or content template to preview its details in the Specify analysis logic dialog box.
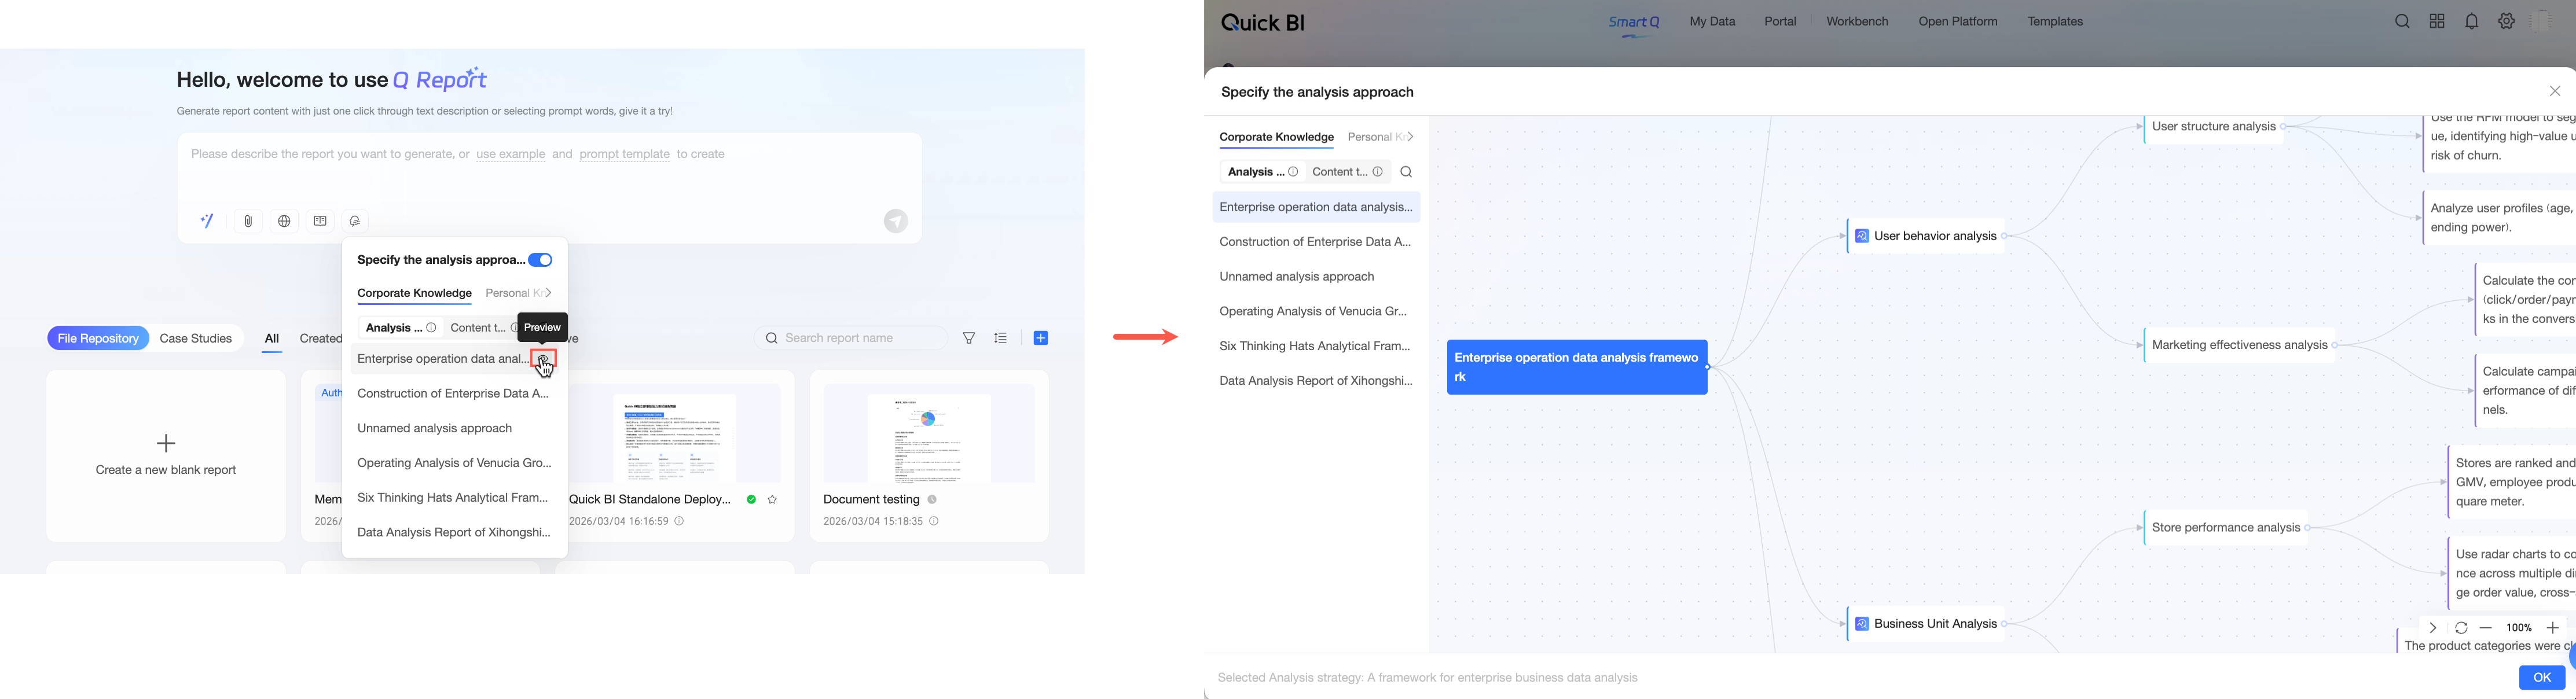
 After the system parses the file, a preview is displayed. Review the uploaded content, make any necessary edits, and then click Finish.
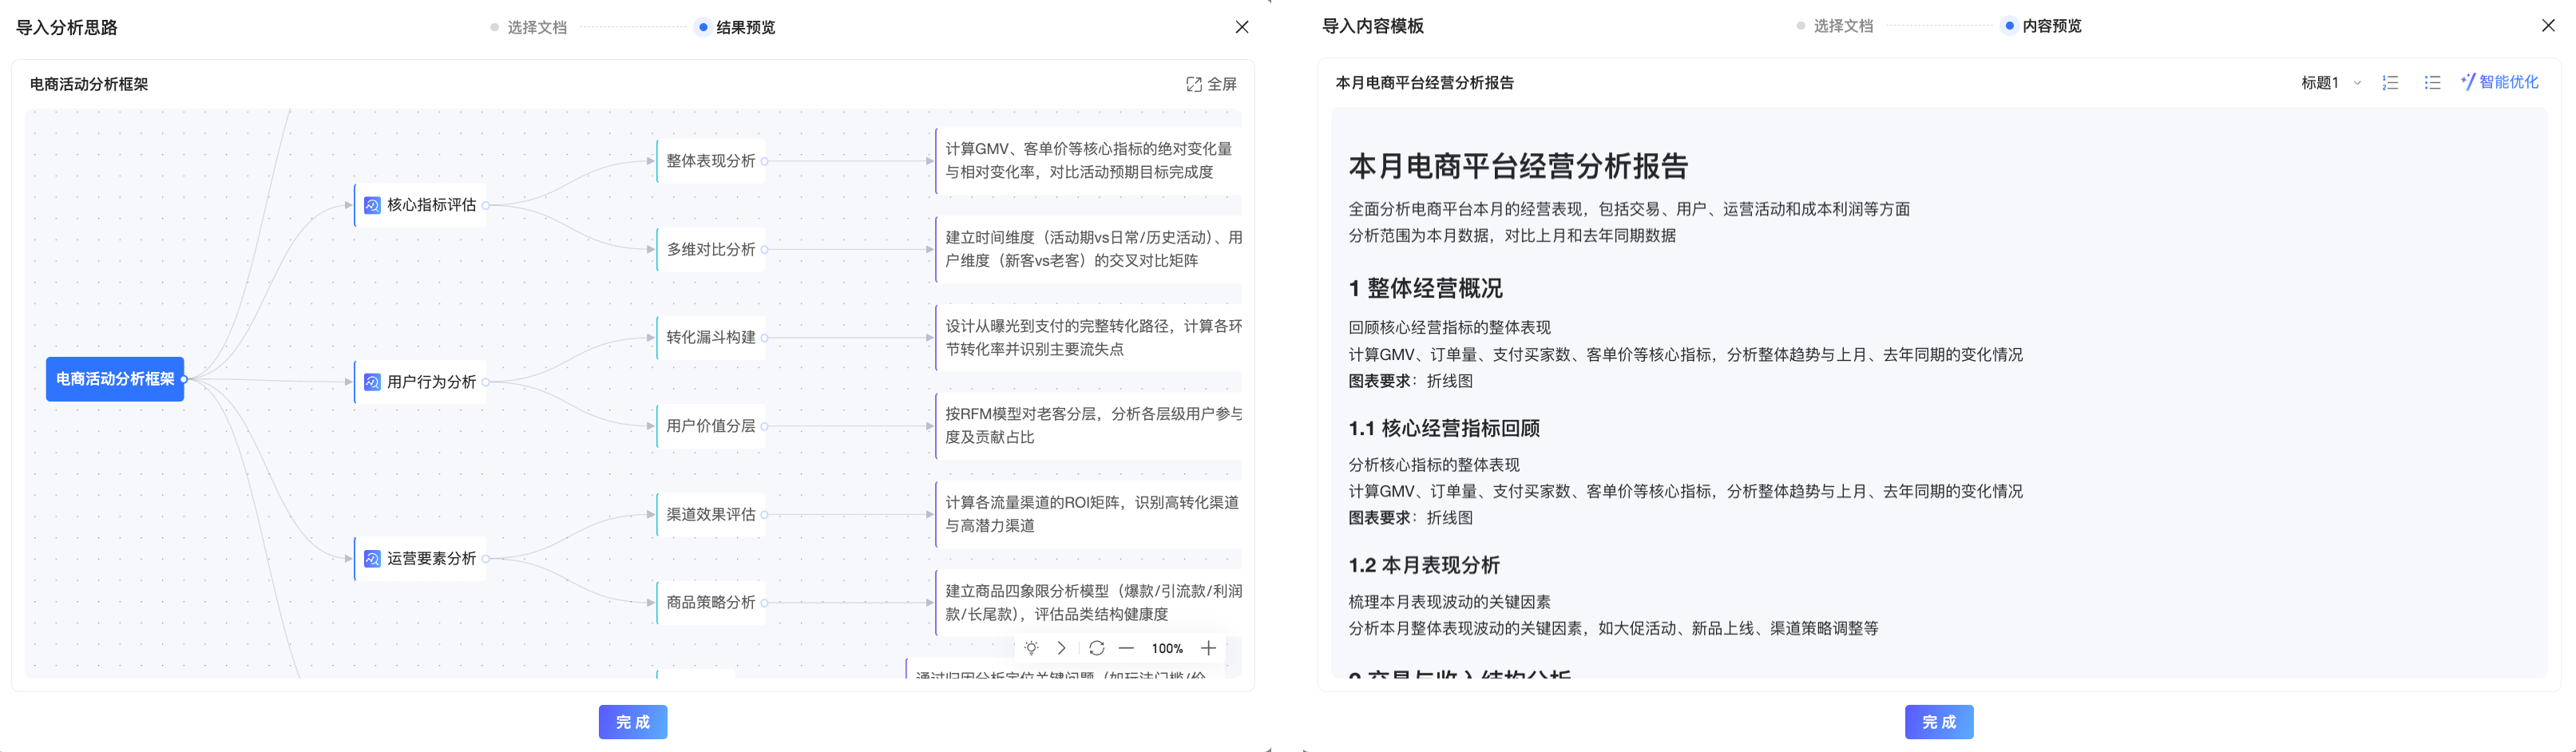
 icon to edit the knowledge content in the editing dialog box.
 icon in the lower-right corner of the dialog box to send the command. You are then redirected to the execution plan generation page, where the plan begins to generate. If you no longer need the plan, click the
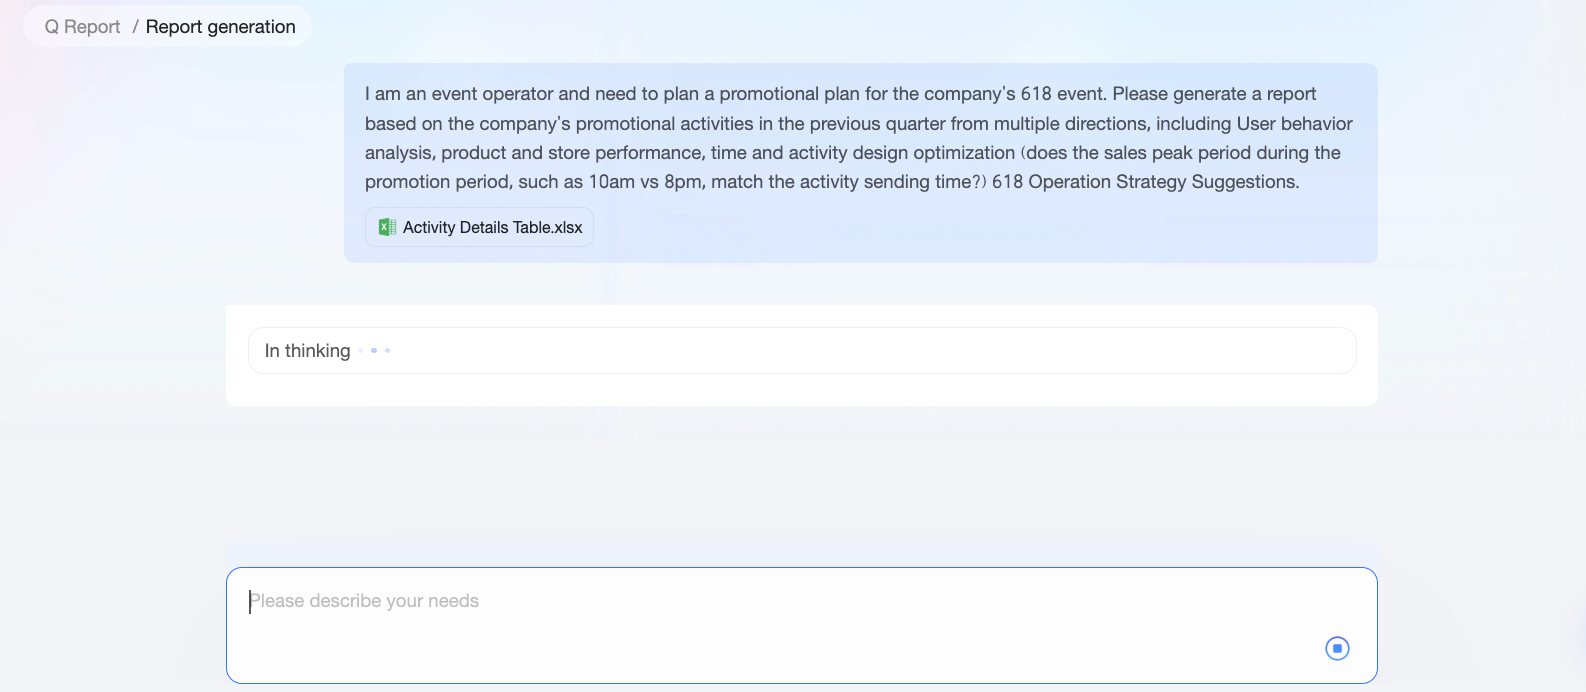
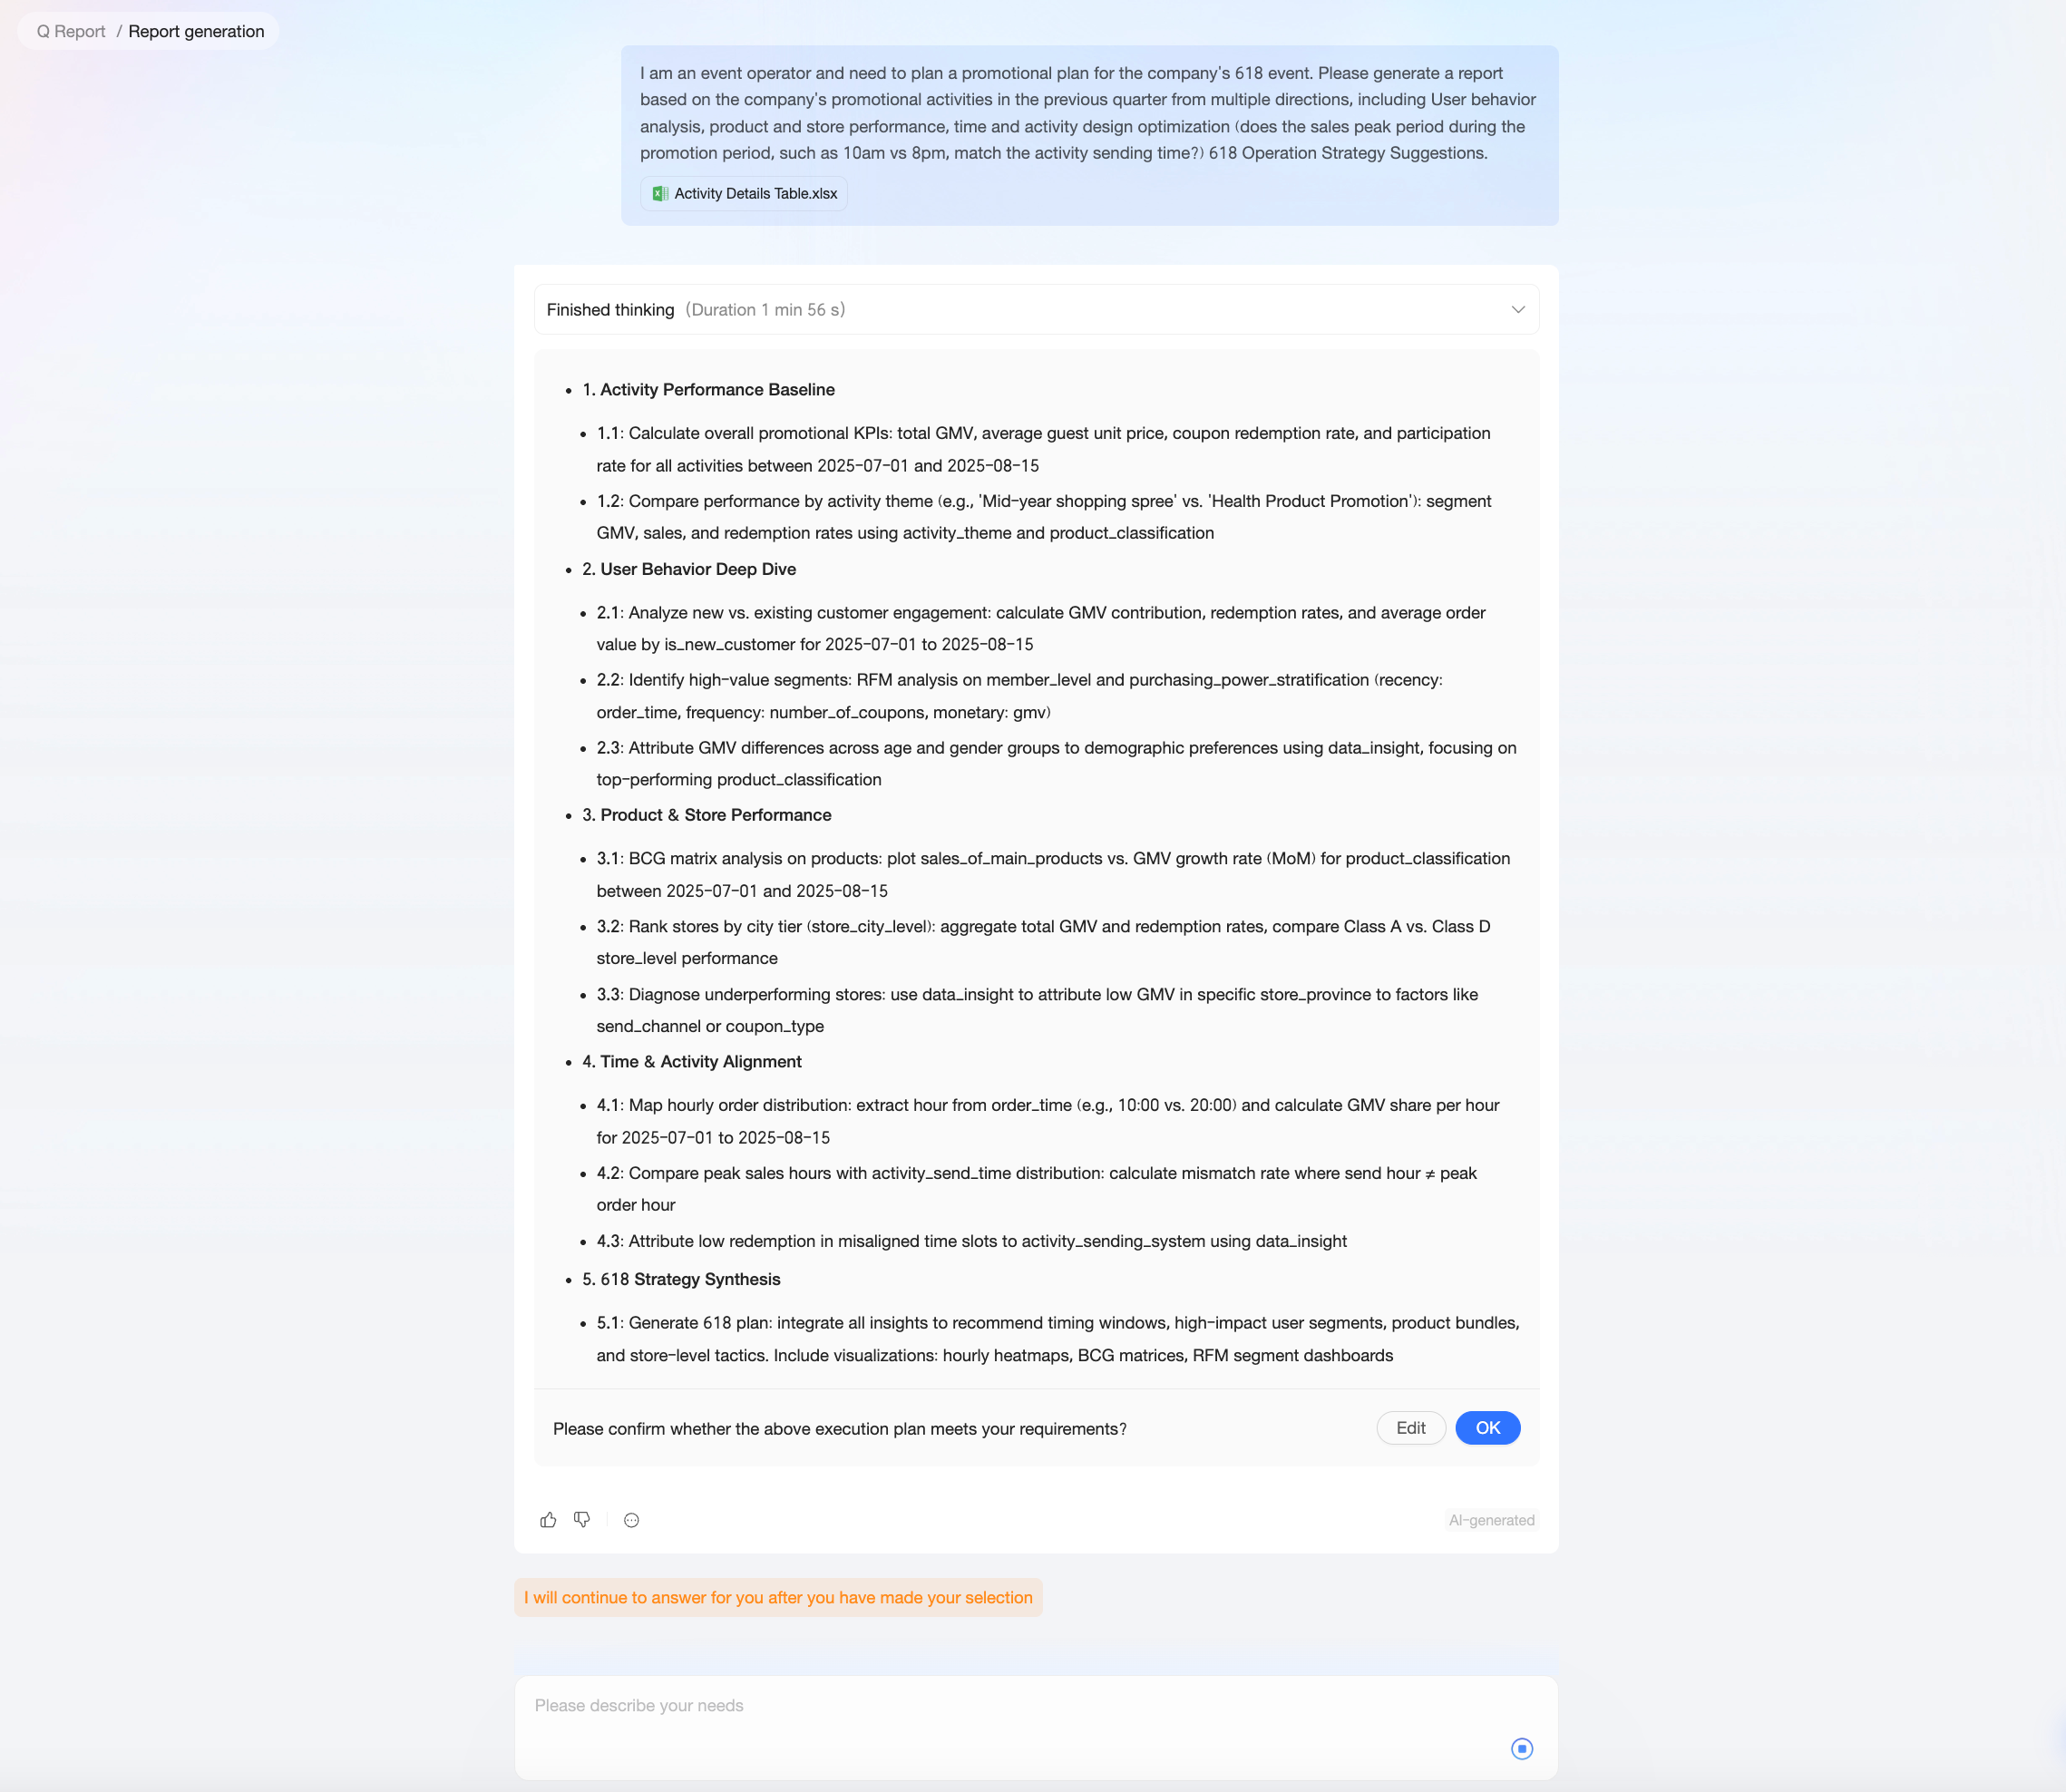
After the plan is generated, it is displayed in sections. You can perform the following actions:
Click the
icon next to Thinking complete to expand and view the large model's reasoning path. This helps you understand how the model generated each part of the execution plan and identify any of its potential misunderstandings.Click Modify to correct any unexpected output and optimize the execution plan. For example, you can delete unnecessary steps or merge several steps into one.
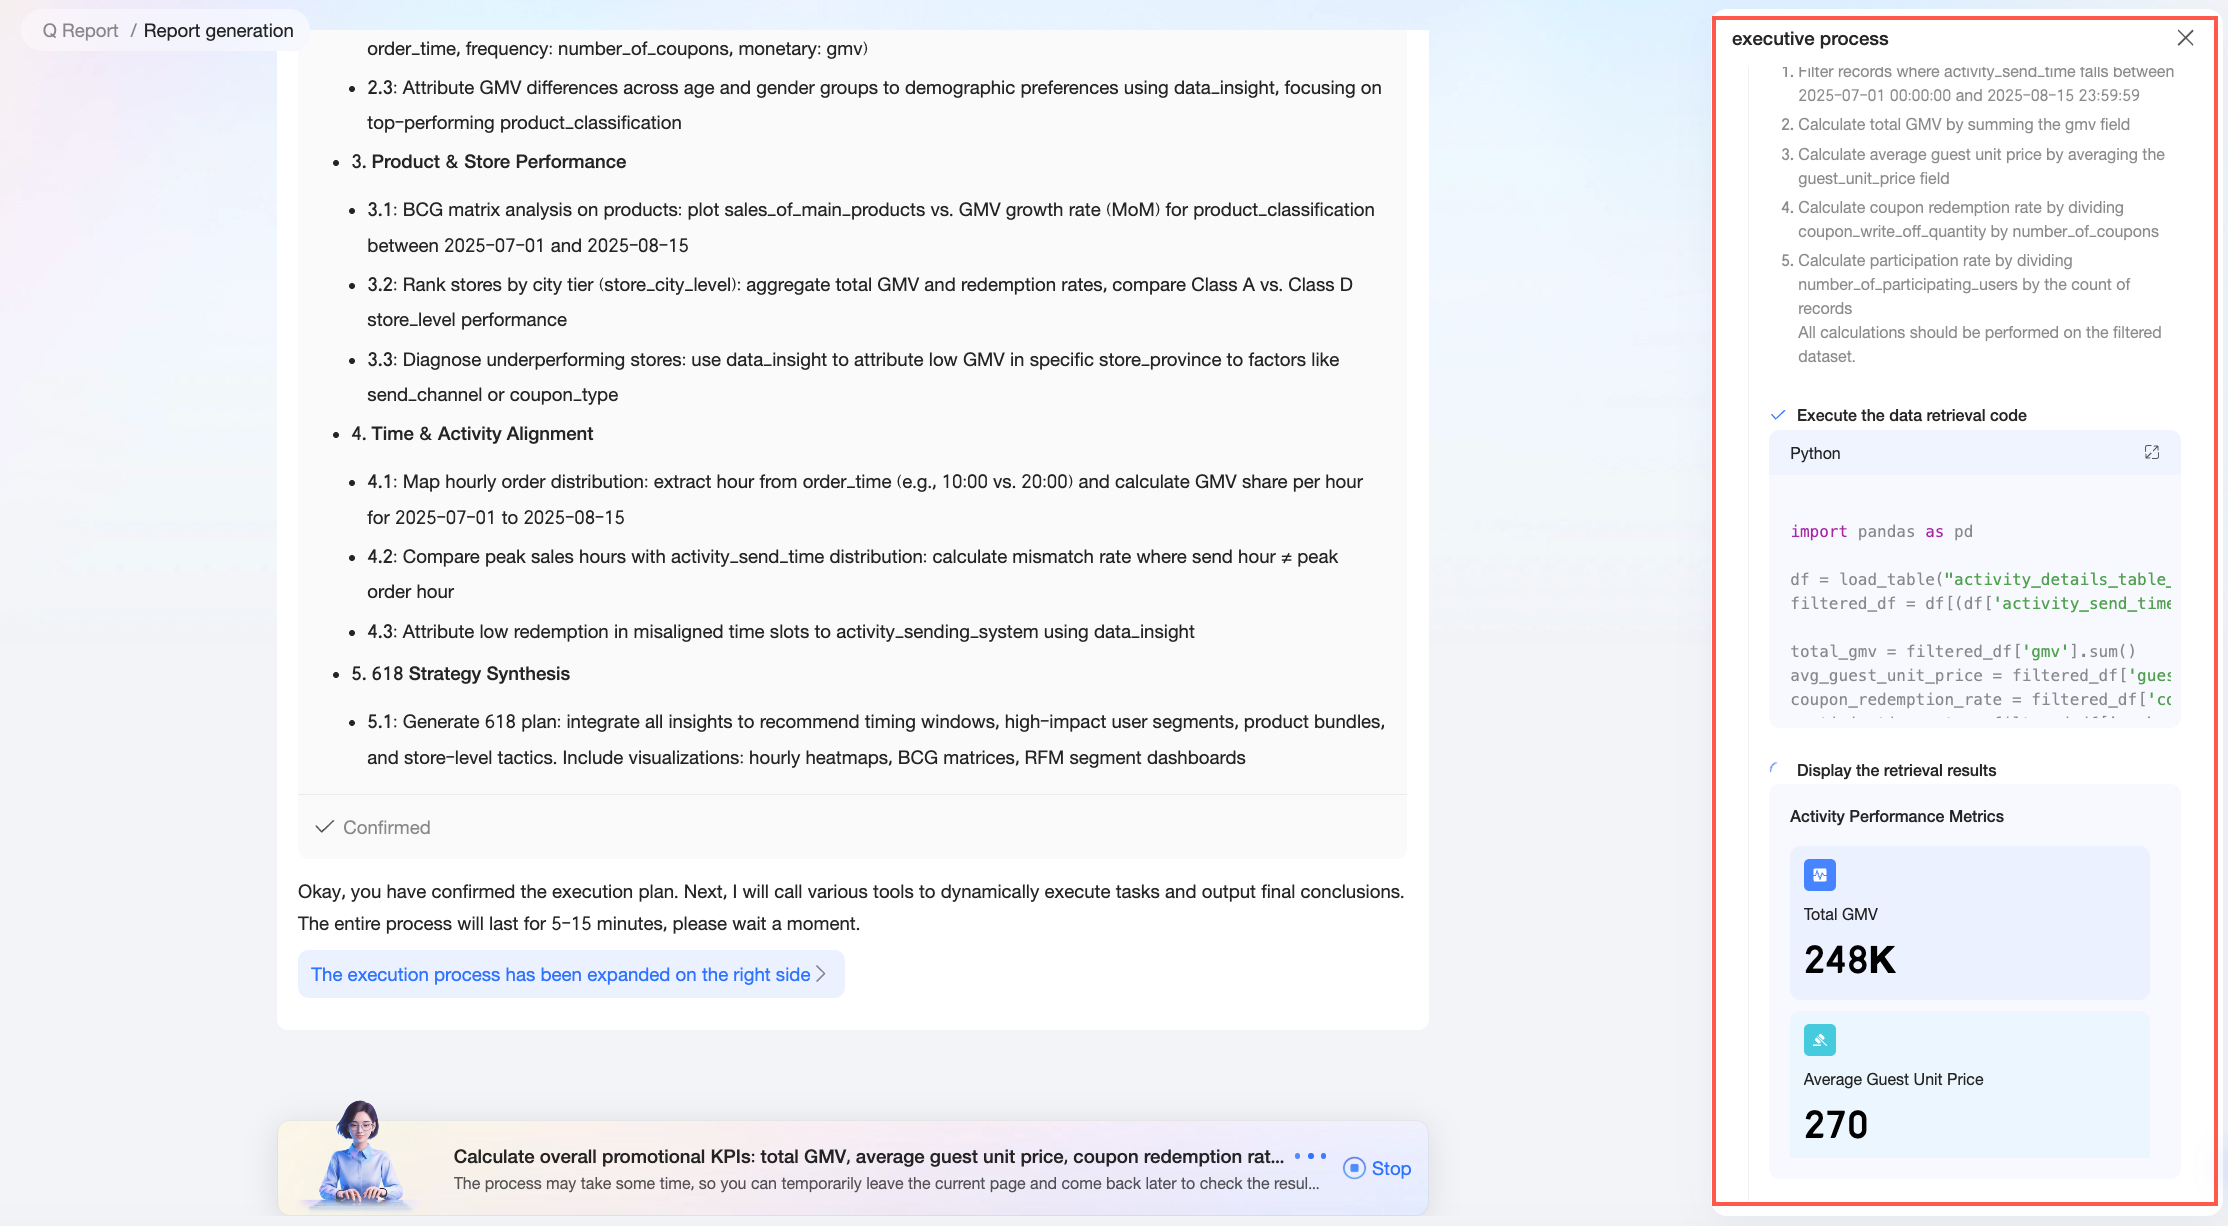
Click OK to confirm the plan. The system then automatically generates an intelligent data report based on the steps and content of the plan.
During the execution of the plan, the right side of the page shows the progress and the inference process.
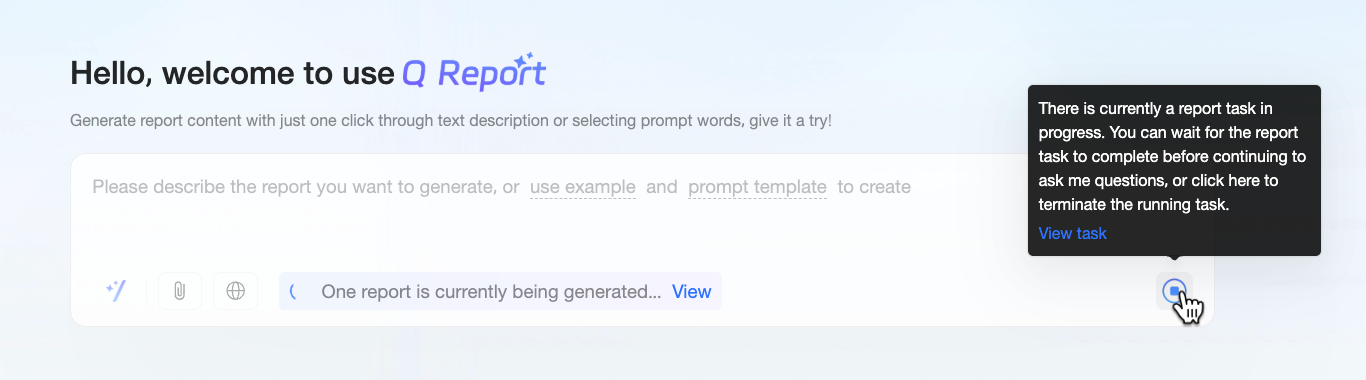
Generating the execution plan and report content can take time. To avoid long waits and improve efficiency, Q Report supports asynchronous generation, which allows the task to run in the background. If you accidentally close your browser or switch to other Quick BI pages to perform other tasks, such as data processing or dashboard building, the system continues to run the generation task. You do not need to keep the generation page open.
You can check the task status in the dialog box on the Q Report page and perform the following actions as needed.Execution status
Description
Actions
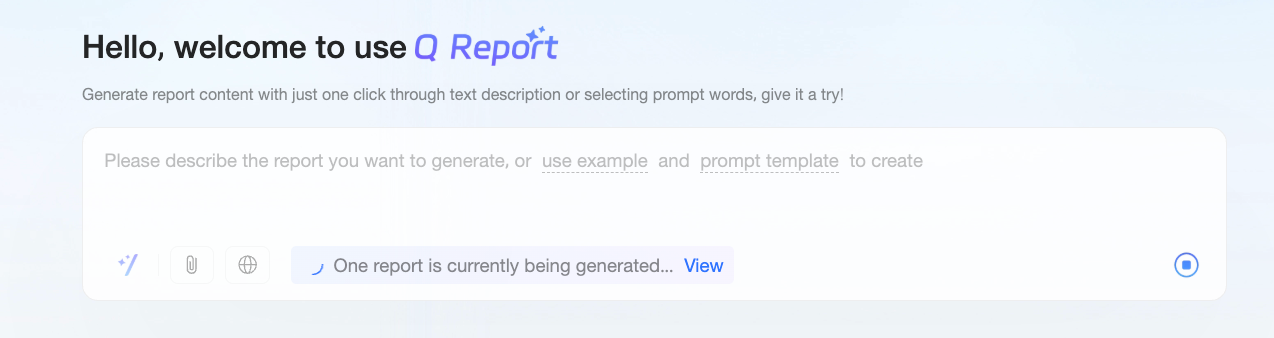
Generating report
The execution plan or report content is being generated.
View: Click View to go to the generation page and view the details of the execution plan or report.
Stop: Click the
icon to stop the task if you no longer need the content.
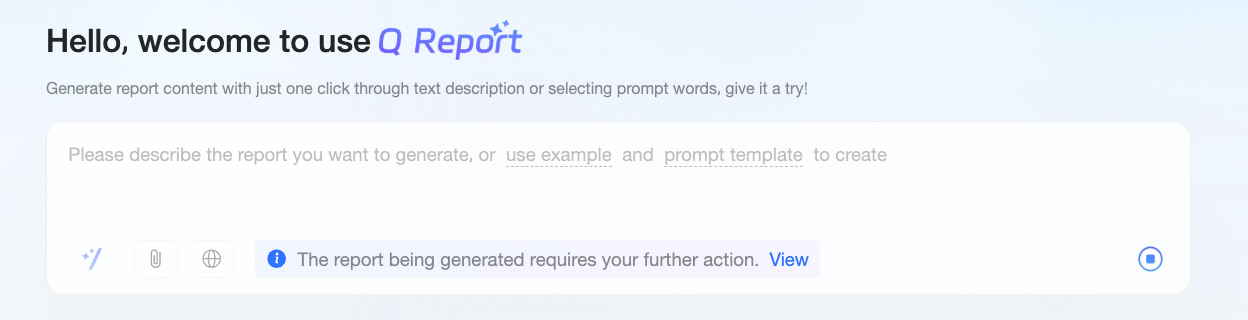
Report pending confirmation
The initial execution plan for the report is ready.
View: Click View to go to the generation page to confirm or adjust the analysis logic.
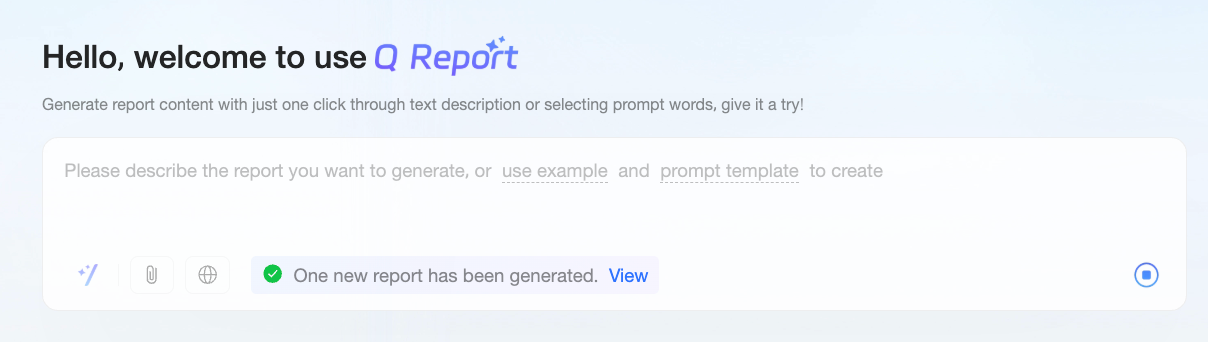
Report generation complete
The report content has been generated.
View: Click View to go to the report preview page and view the details.
Report generation failed
The execution plan or report content failed to generate, possibly due to a system error.
View: Click View to go to the generation page to see the reason for the failure. You can then choose to rerun or stop the task.
NoteYou can only generate one report at a time for each account. If a report is already being generated (including asynchronously in the background), you cannot start a new report generation task.
After the plan executes, the generated report appears on the left side of the page, and the execution process is collapsed in the right-side panel. To see how the results were generated, click the
icon next to Execution complete to expand the panel. If you are on another Quick BI page (such as Intelligent Q, My Dashboards, Enterprise Portal, Workbench, Open Platform, or Template Marketplace) when the report generation is complete, a Report generation complete notification appears. Click Open Report to go directly to the report preview page.You can also perform the following actions on the report preview page.
Action
Description
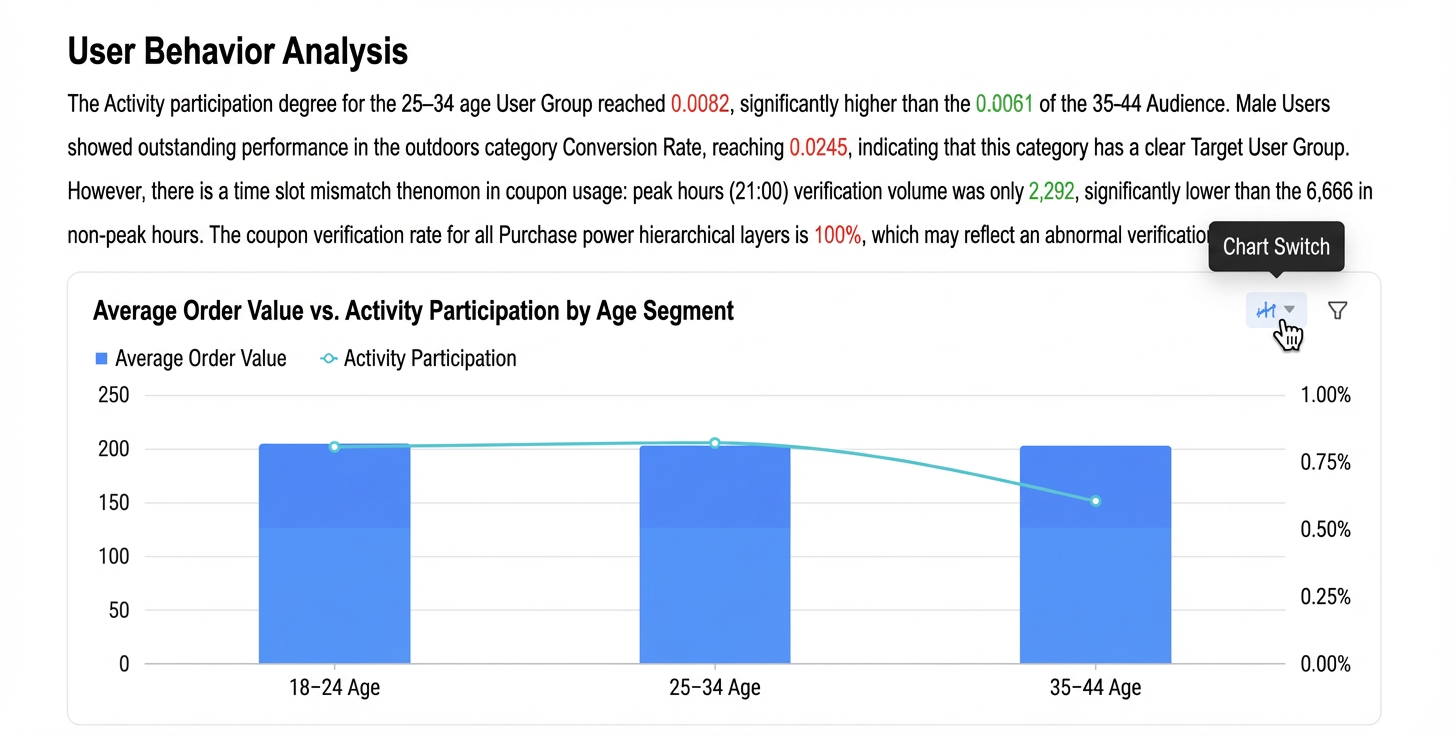
Change chart type
During report generation, the system automatically creates charts based on the use case and data content. If a chart does not meet your expectations, you can change its type to better fit your data visualization preferences.
View generation process
After the report is generated, an
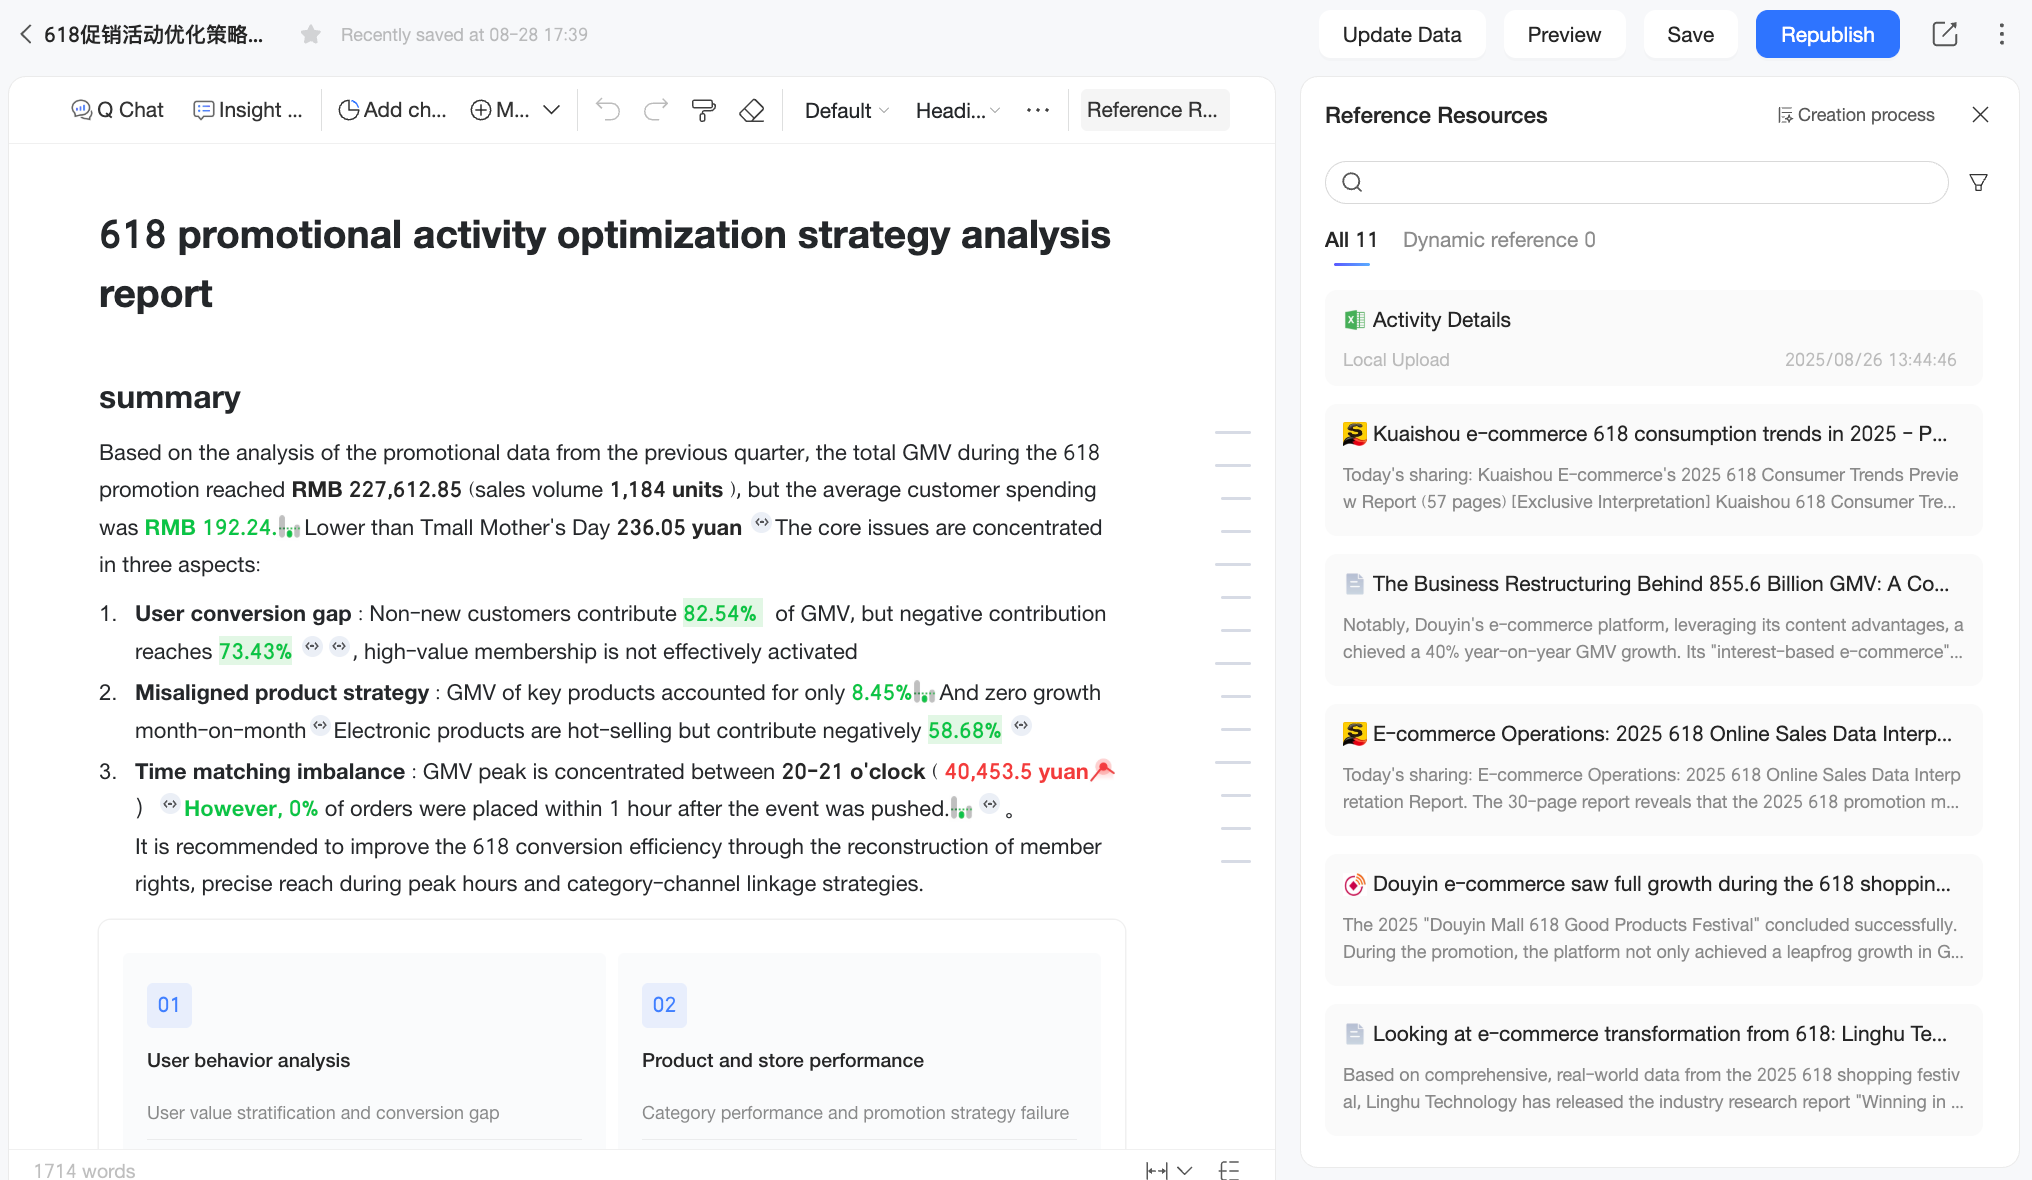
icon appears next to key metrics and important data conclusions. Click this icon to view the generation process for that specific content in the Execution Process panel. This helps you trace and verify the data analysis process.View referenced resources
If you enabled web search and the final report includes information from the internet, an
icon appears next to data conclusions that cite external information. Click this icon to view the external sources in the Web Search panel, ensuring the information is traceable and credible.Click Generate report document and edit to go to the report editing page. On this page, you can:
View the generation process and referenced resources: Trace the generation process for key data to verify the analysis. If web search was used, you can also view external sources to ensure the information is reliable.
NoteTo better simulate the final delivery and reading experience, you cannot view the generation process or referenced resources on the report preview page.
Adjust the execution panel width: Drag the edge of the execution panel to resize it. This allows you to customize the page layout to suit your workflow.
Edit the report content: Adjust the report's style and visual formatting, or insert resources like charts and Q&A components to enrich the content. This allows you to refine the report to better meet your specific business needs and customization requirements. For more information, see Edit a Q Report.
 icon next to Thinking complete to expand and view the large model's reasoning path. This helps you understand how the model generated each part of the execution plan and identify any of its potential misunderstandings.
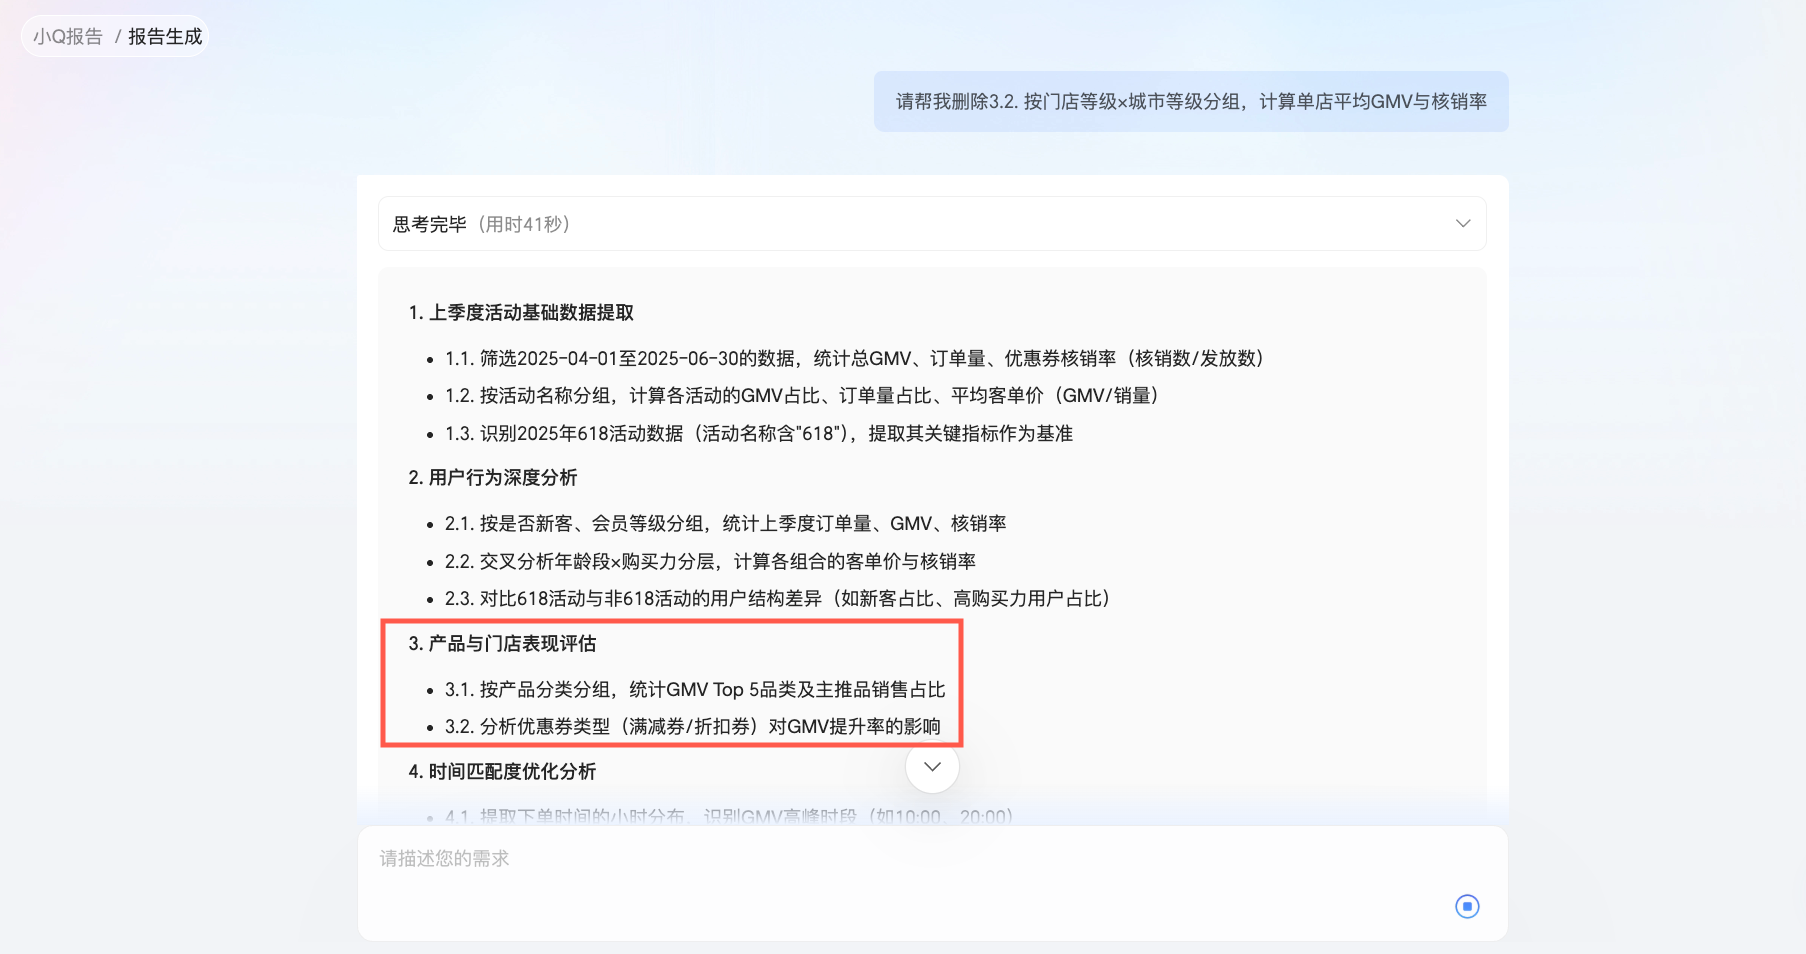
 You can check the task status in the dialog box on the Q Report page and perform the following actions as needed.
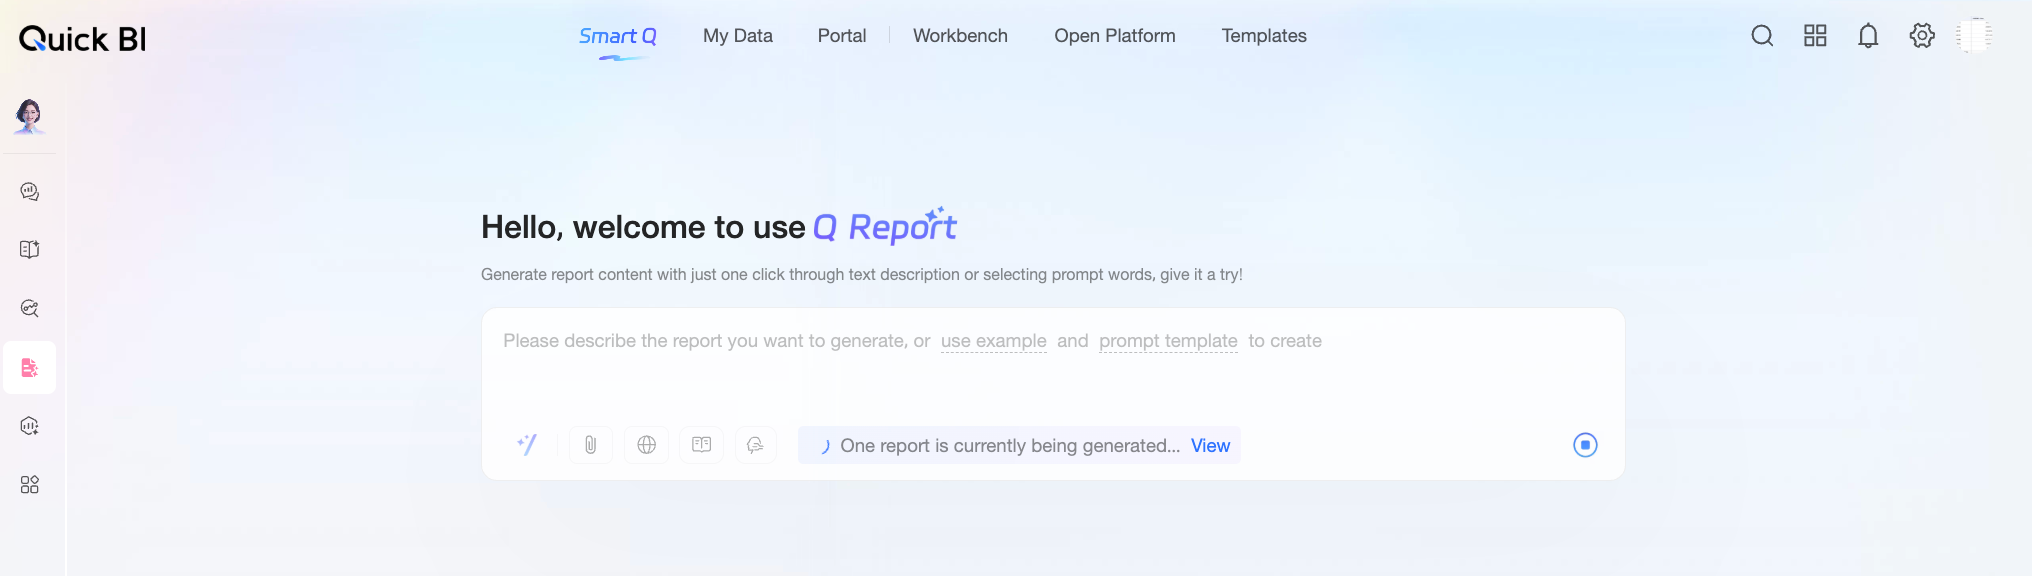

 icon next to Execution complete to expand the panel.
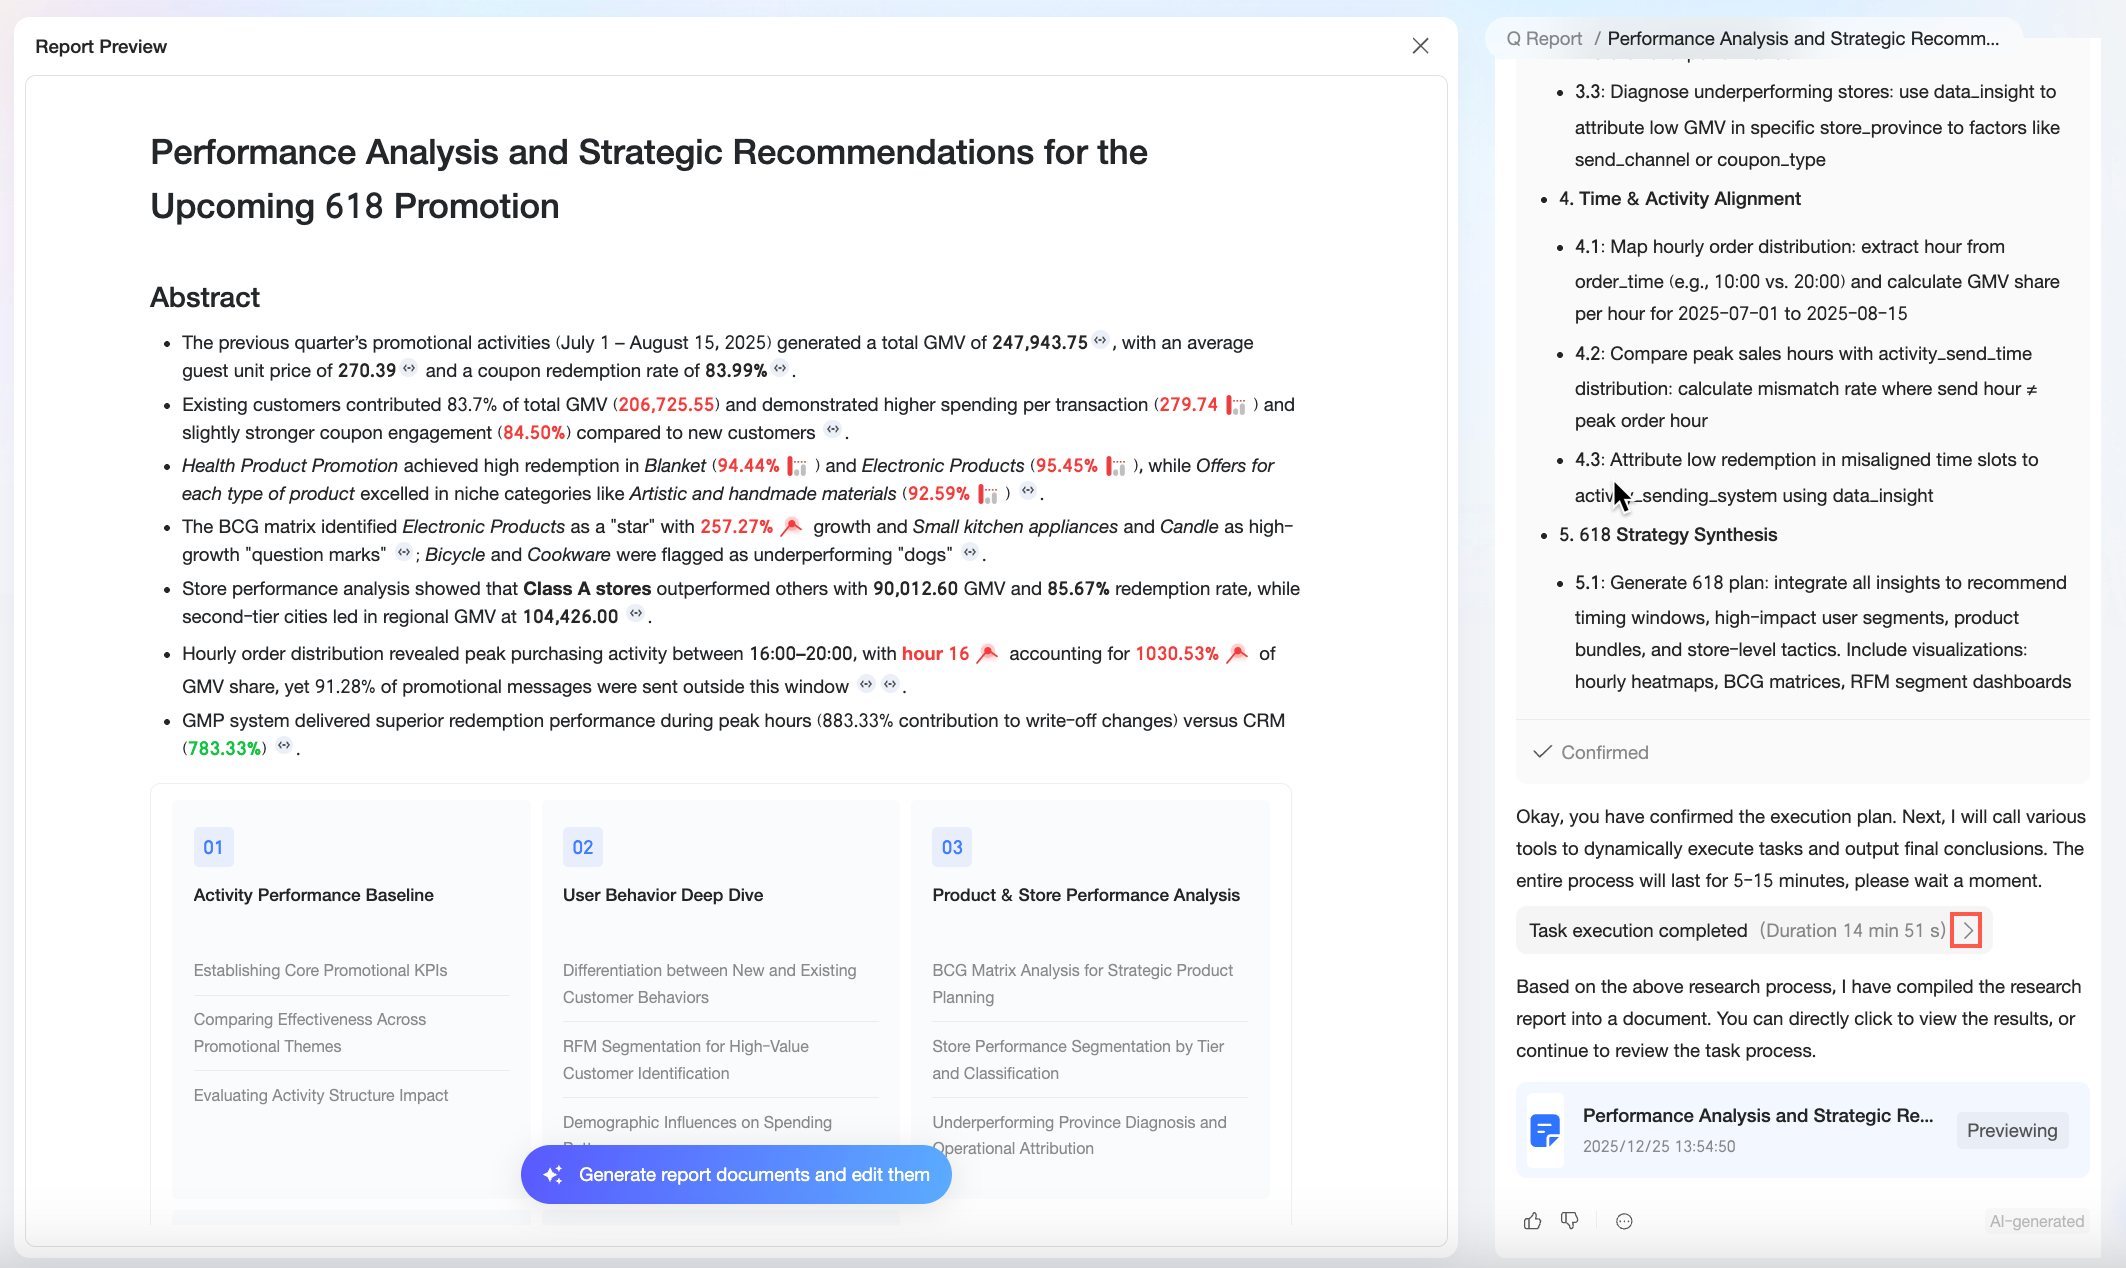 If you are on another Quick BI page (such as Intelligent Q, My Dashboards, Enterprise Portal, Workbench, Open Platform, or Template Marketplace) when the report generation is complete, a Report generation complete notification appears. Click Open Report to go directly to the report preview page.
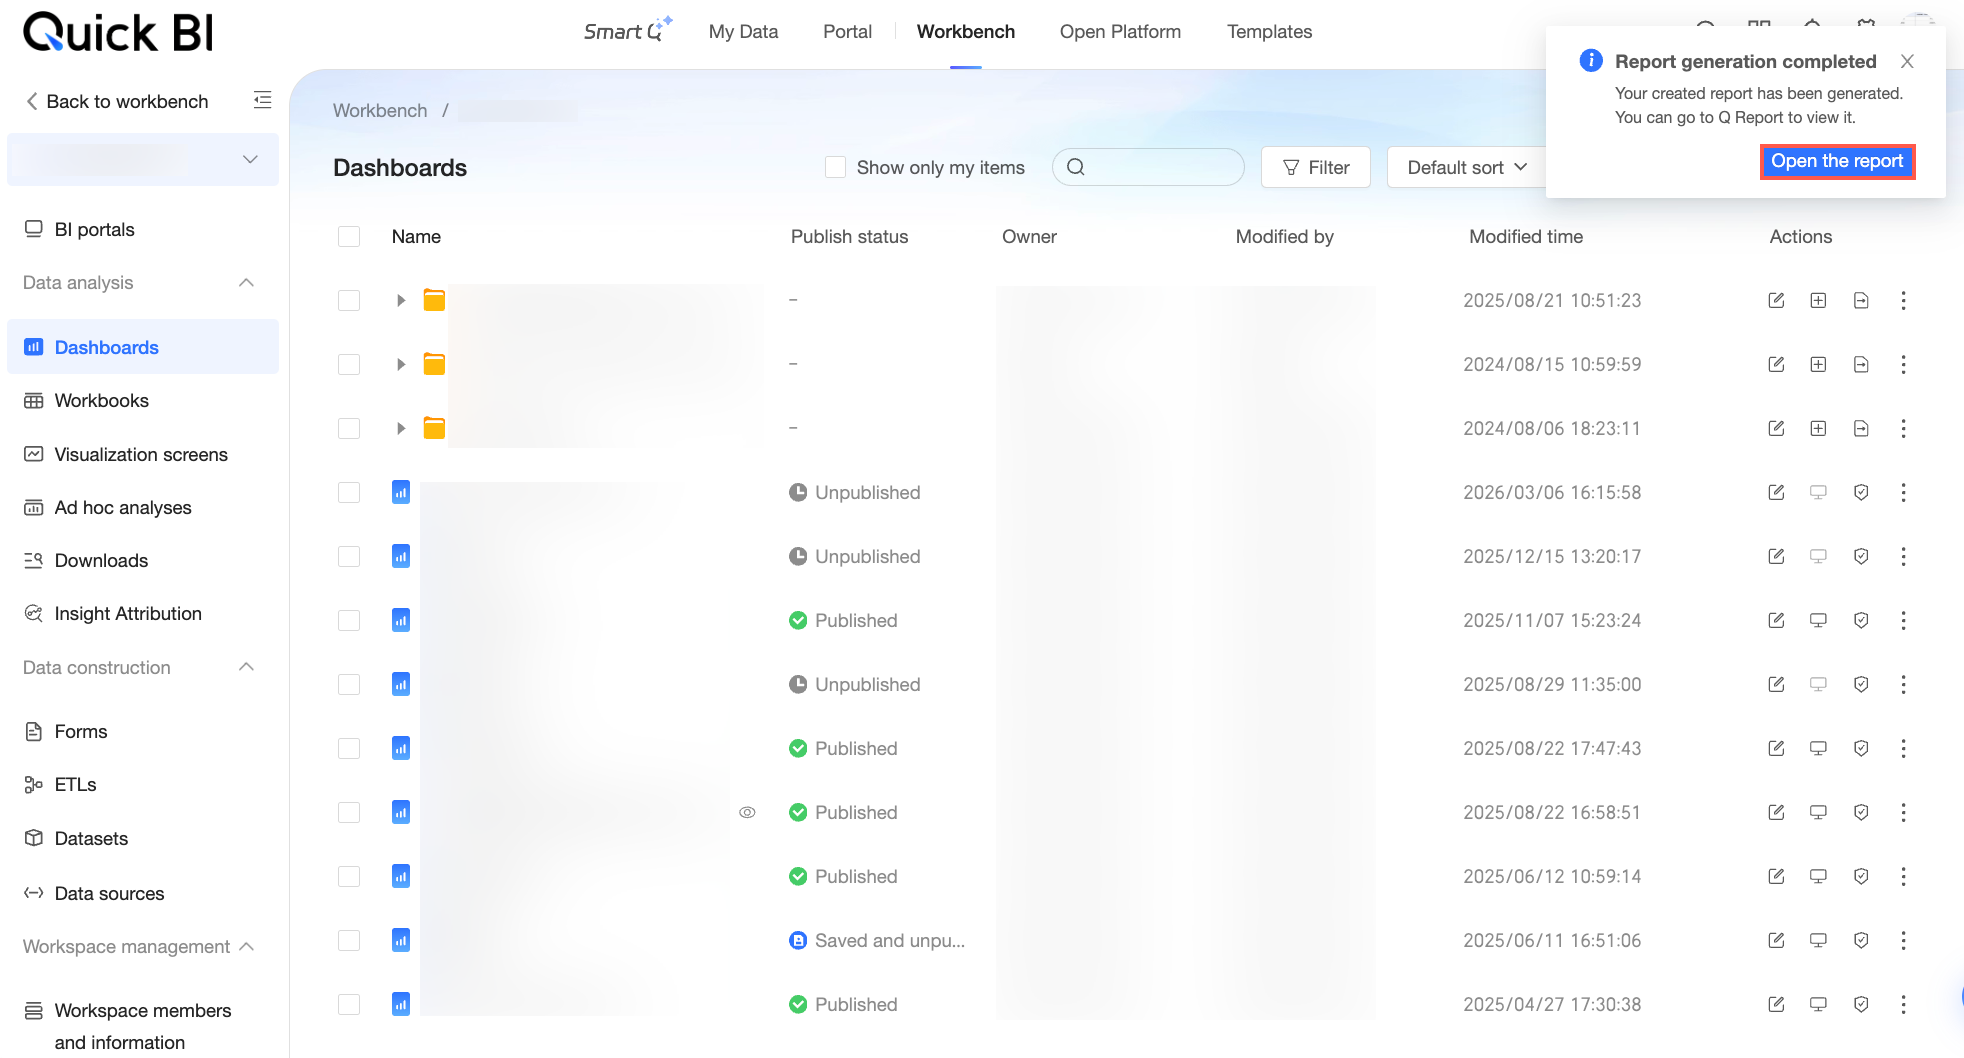
 icon appears next to key metrics and important data conclusions. Click this icon to view the generation process for that specific content in the Execution Process panel. This helps you trace and verify the data analysis process.
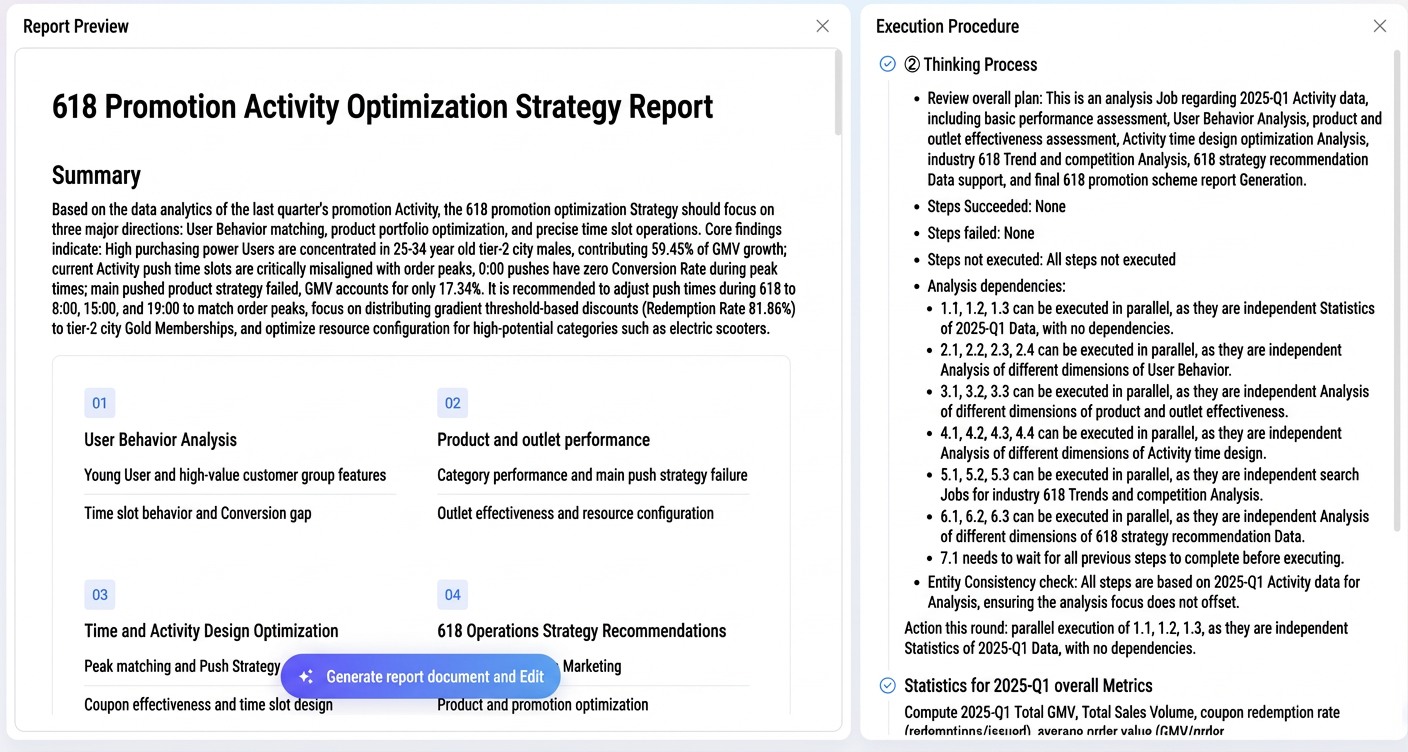
Method 2: Create a blank report
Use cases:
You need full control over the content: For highly creative reports with heavily customized content, you need more flexibility to tailor the report. In this case, you can create a blank report and use the document editing features and AI assistant in Q Report to build a report that is both professional and personalized.
Follow these steps:
Click Create Blank Report.
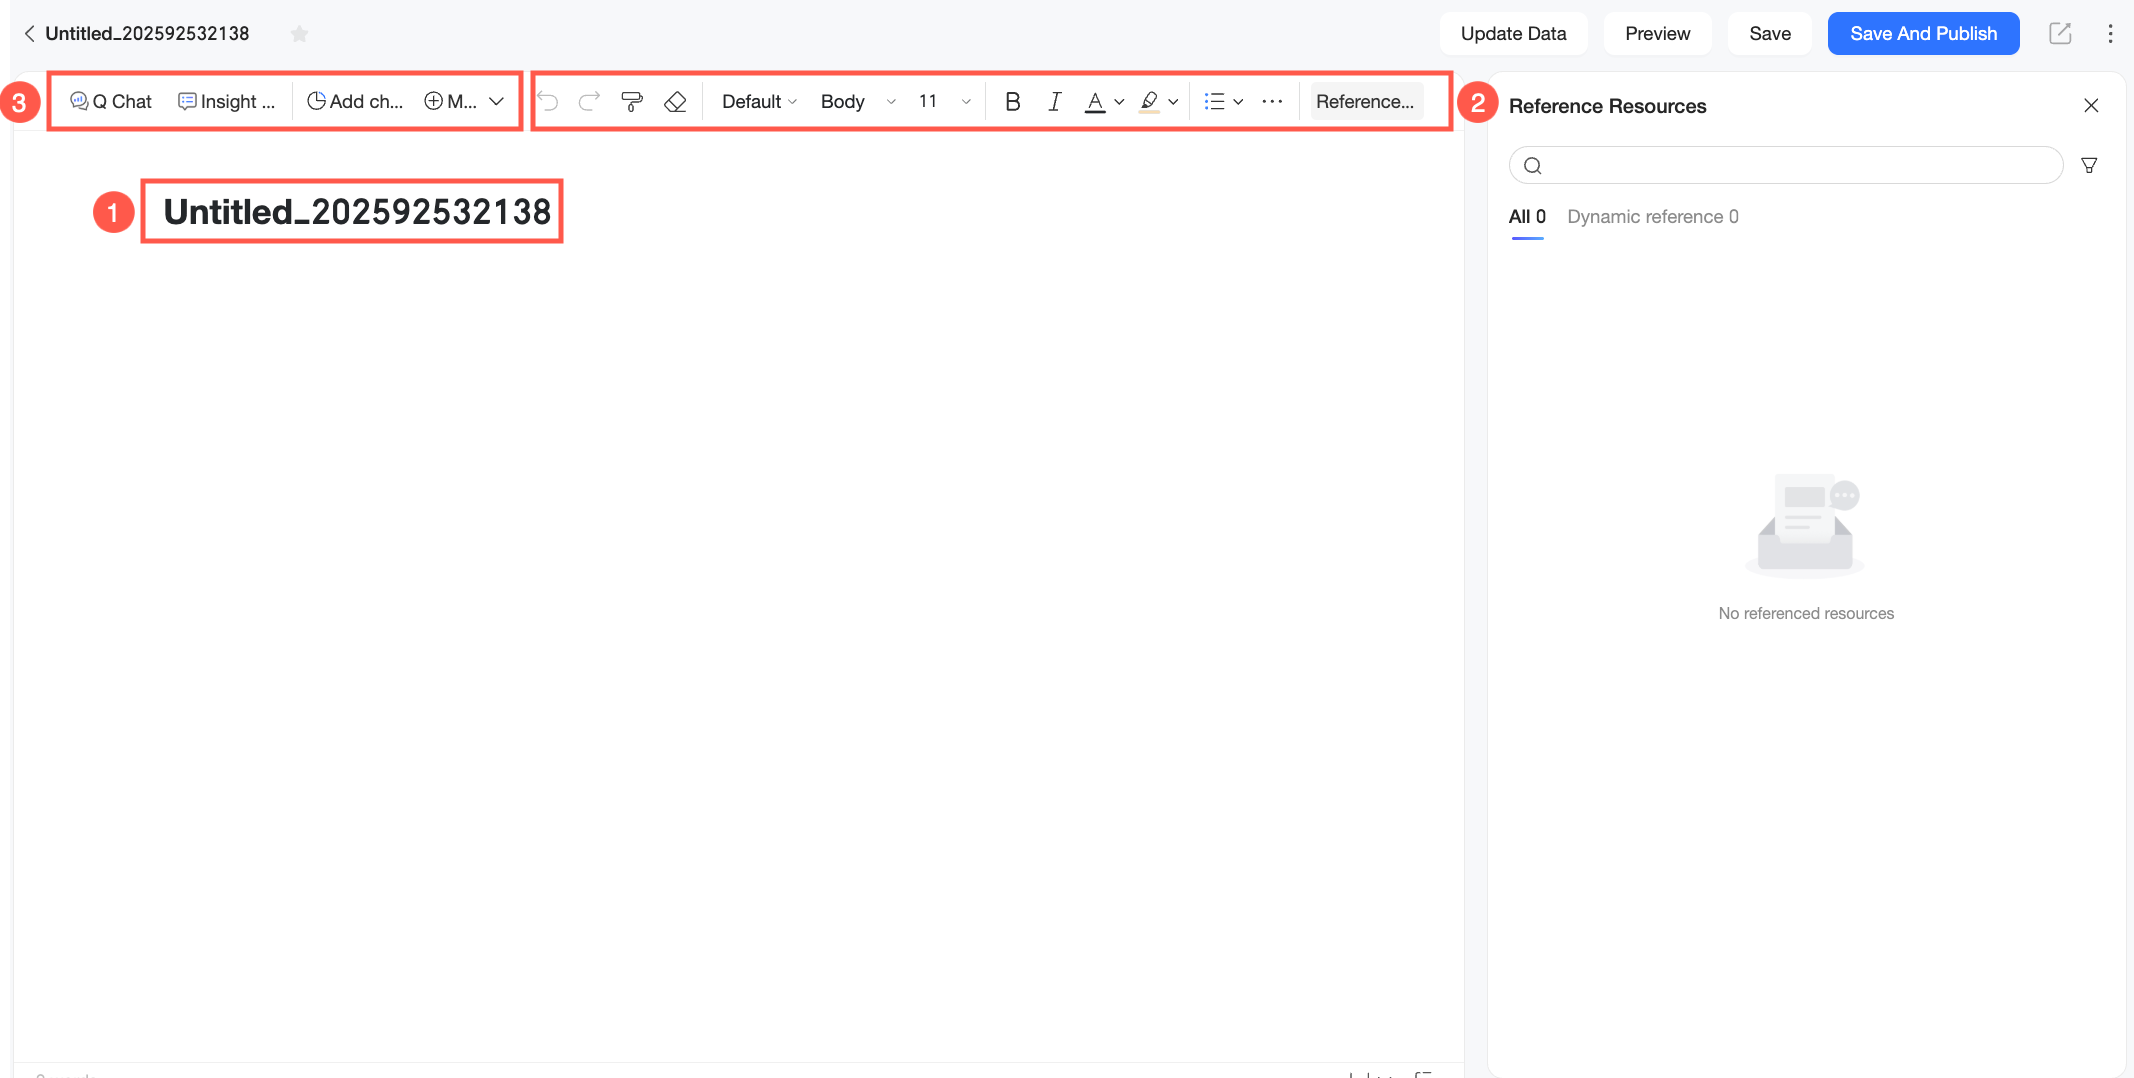
On the report editing page, you can ① change the report name, ② write and format the report content, and ③ add resources like charts and Q&A components. For more information, see Edit a Q Report.
After you finish creating the report, click Save or Save and Publish as needed.
NoteYou can only share reports that have been Published. Saved but unpublished reports cannot be shared.
Next steps
After you create a report, you can adjust its visual format, add resources like charts and Q&A components, and gain further data insights on the editing page. For more information, see Edit a Q Report.
After you finish creating a report, you can share it with others, configure its permissions, and manage your existing reports. For more information, see Manage Q Reports.