After you create and edit a Q Report, you can view, favorite, preview, publish, and share it, and manage its categories and permissions.
Prerequisites
You have created a Xiao Q report.
Favorite
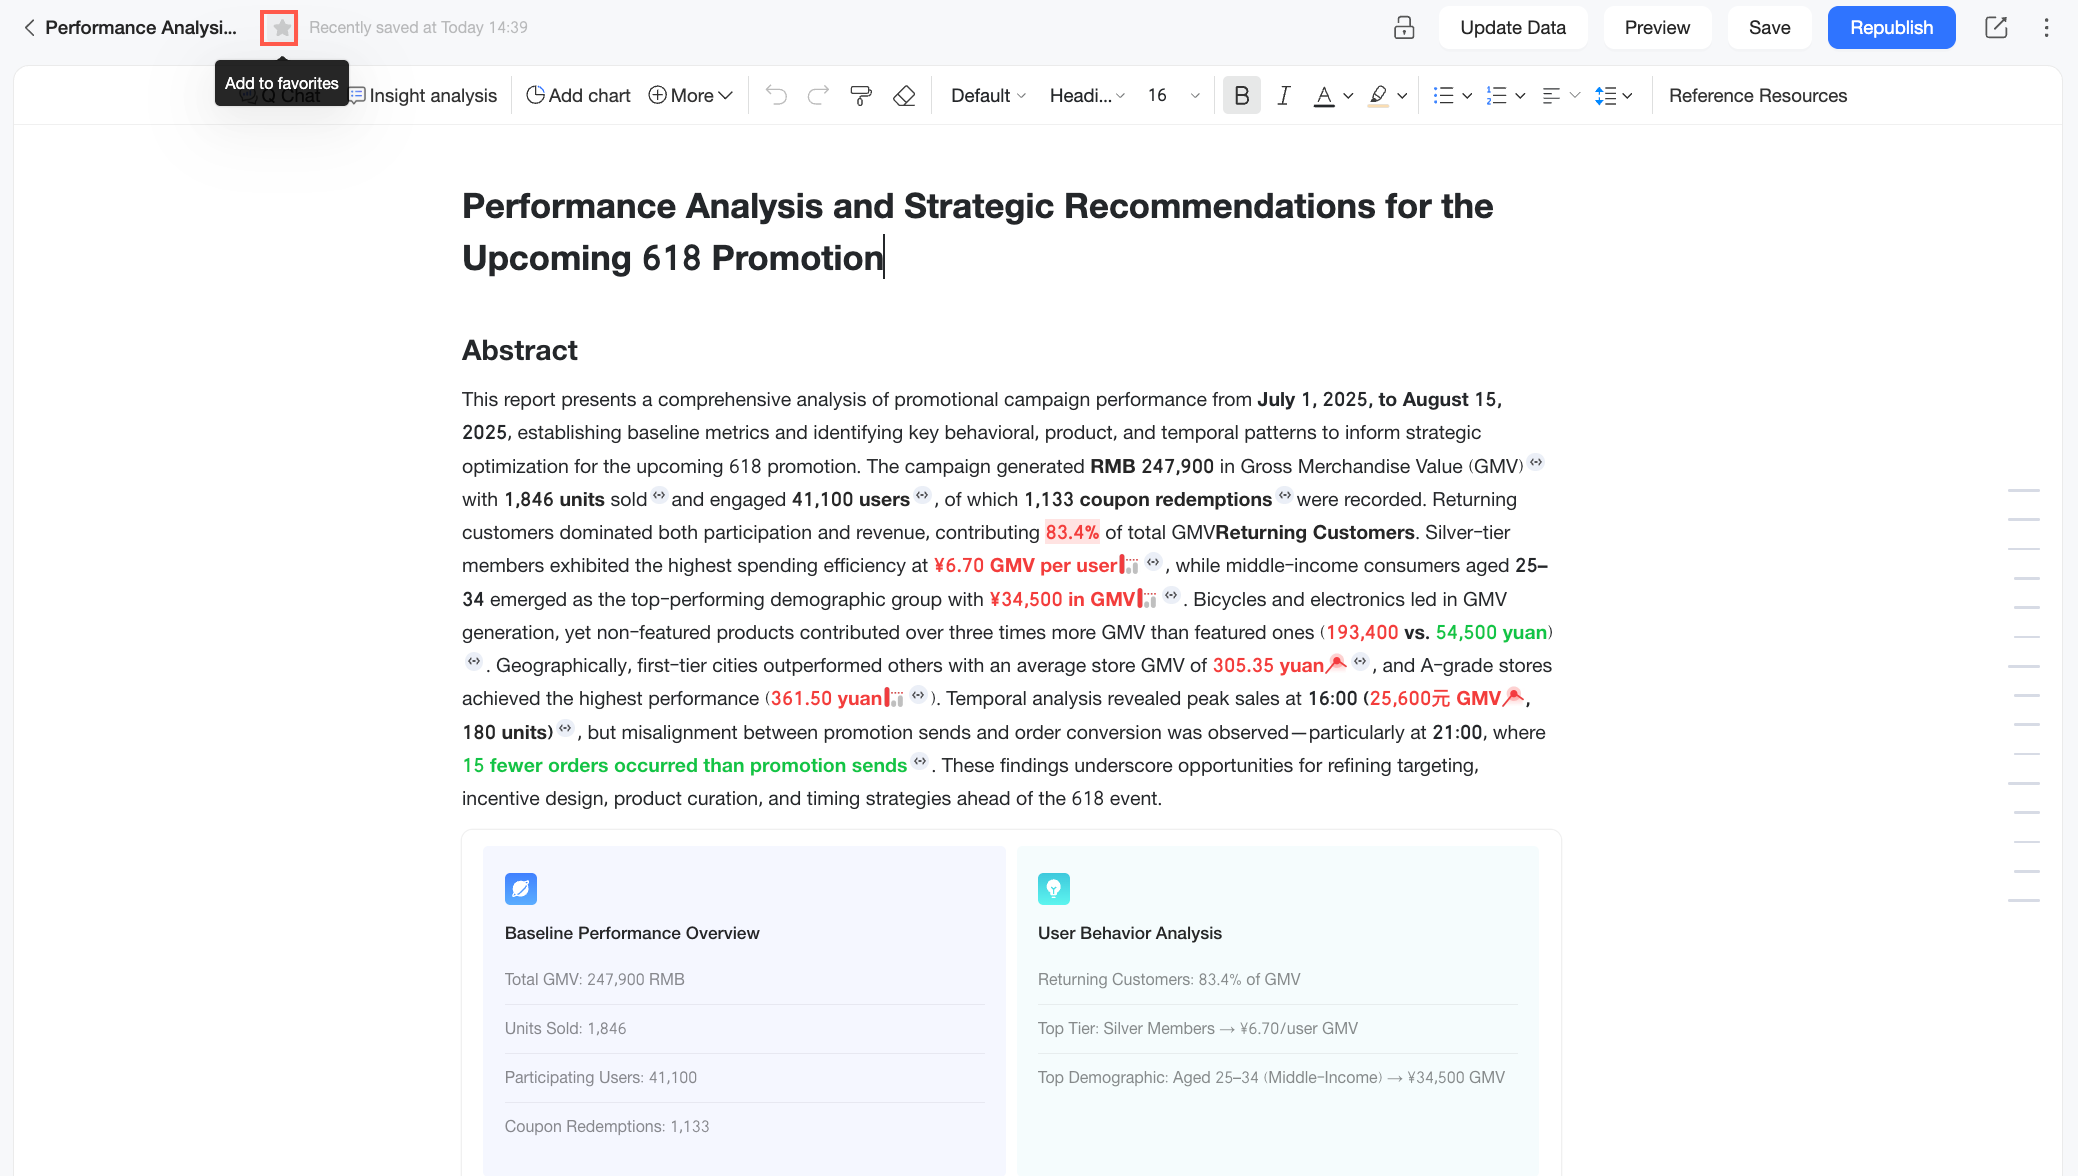
On the Q Report editing page, click the ![]() icon in the upper-left corner of the navigation bar to favorite the Q Report. To unfavorite it, click the
icon in the upper-left corner of the navigation bar to favorite the Q Report. To unfavorite it, click the ![]() icon again.
icon again.
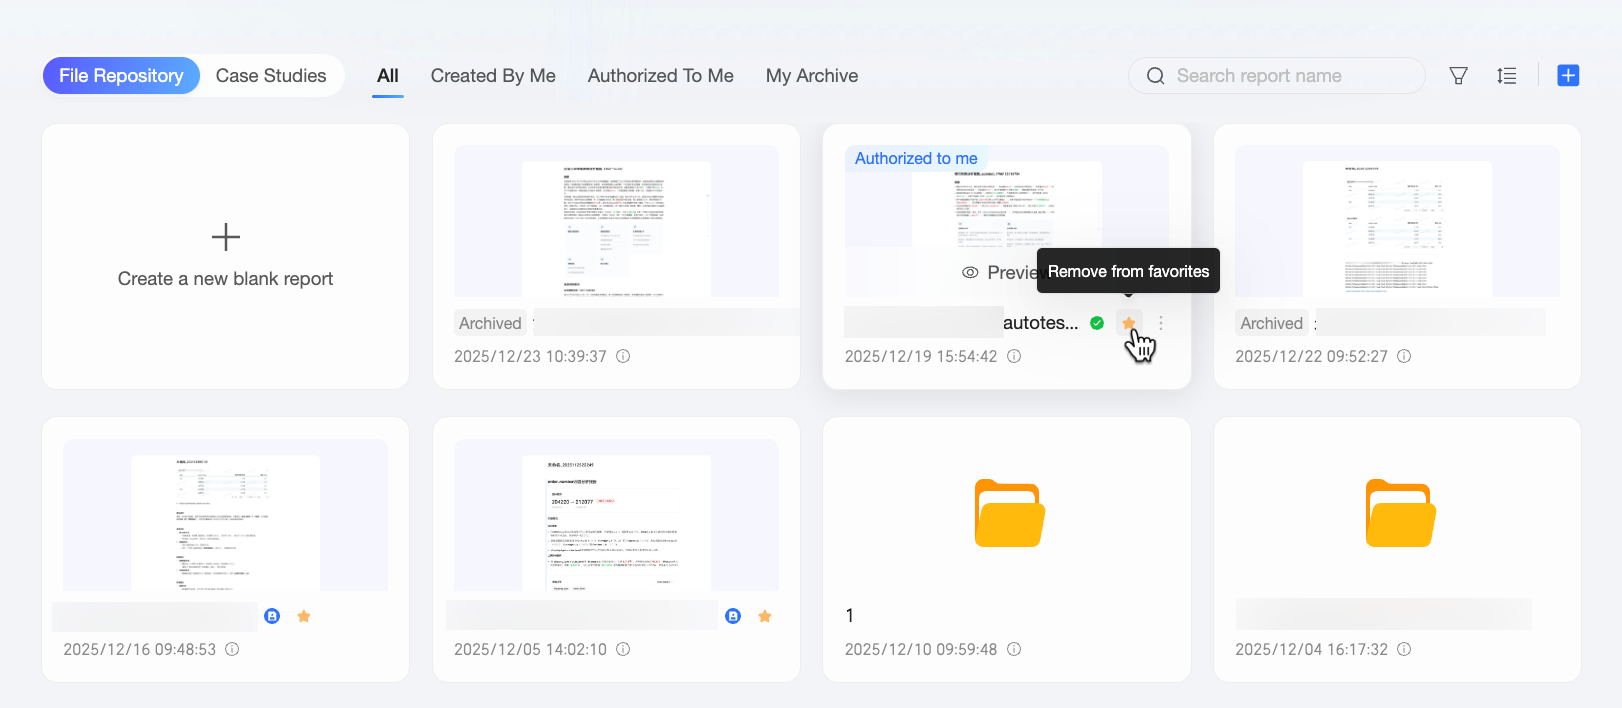
You can also favorite a Q Report from the list page by clicking its ![]() icon.
icon.
Exclusive Edit Lock
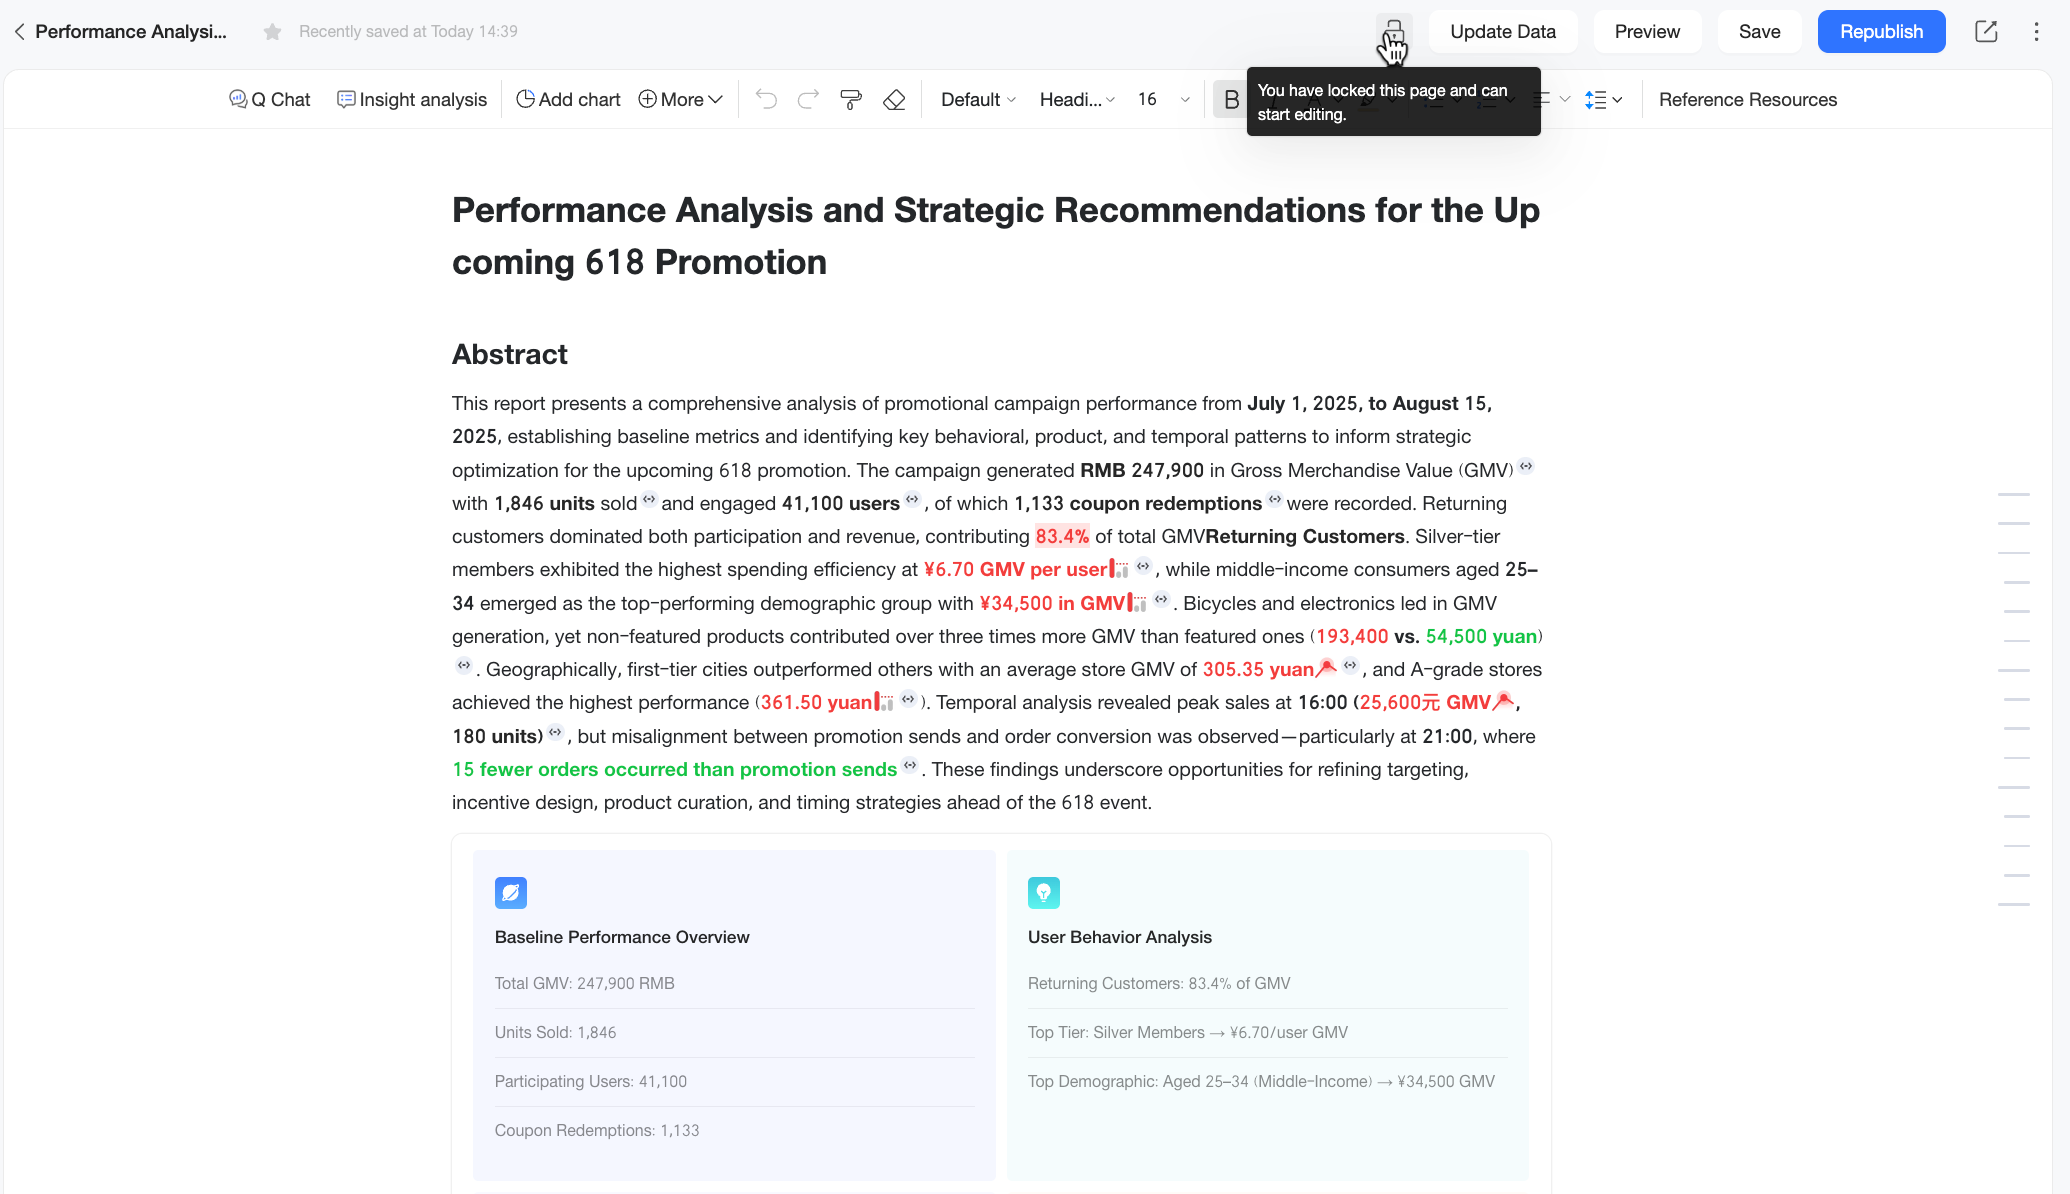
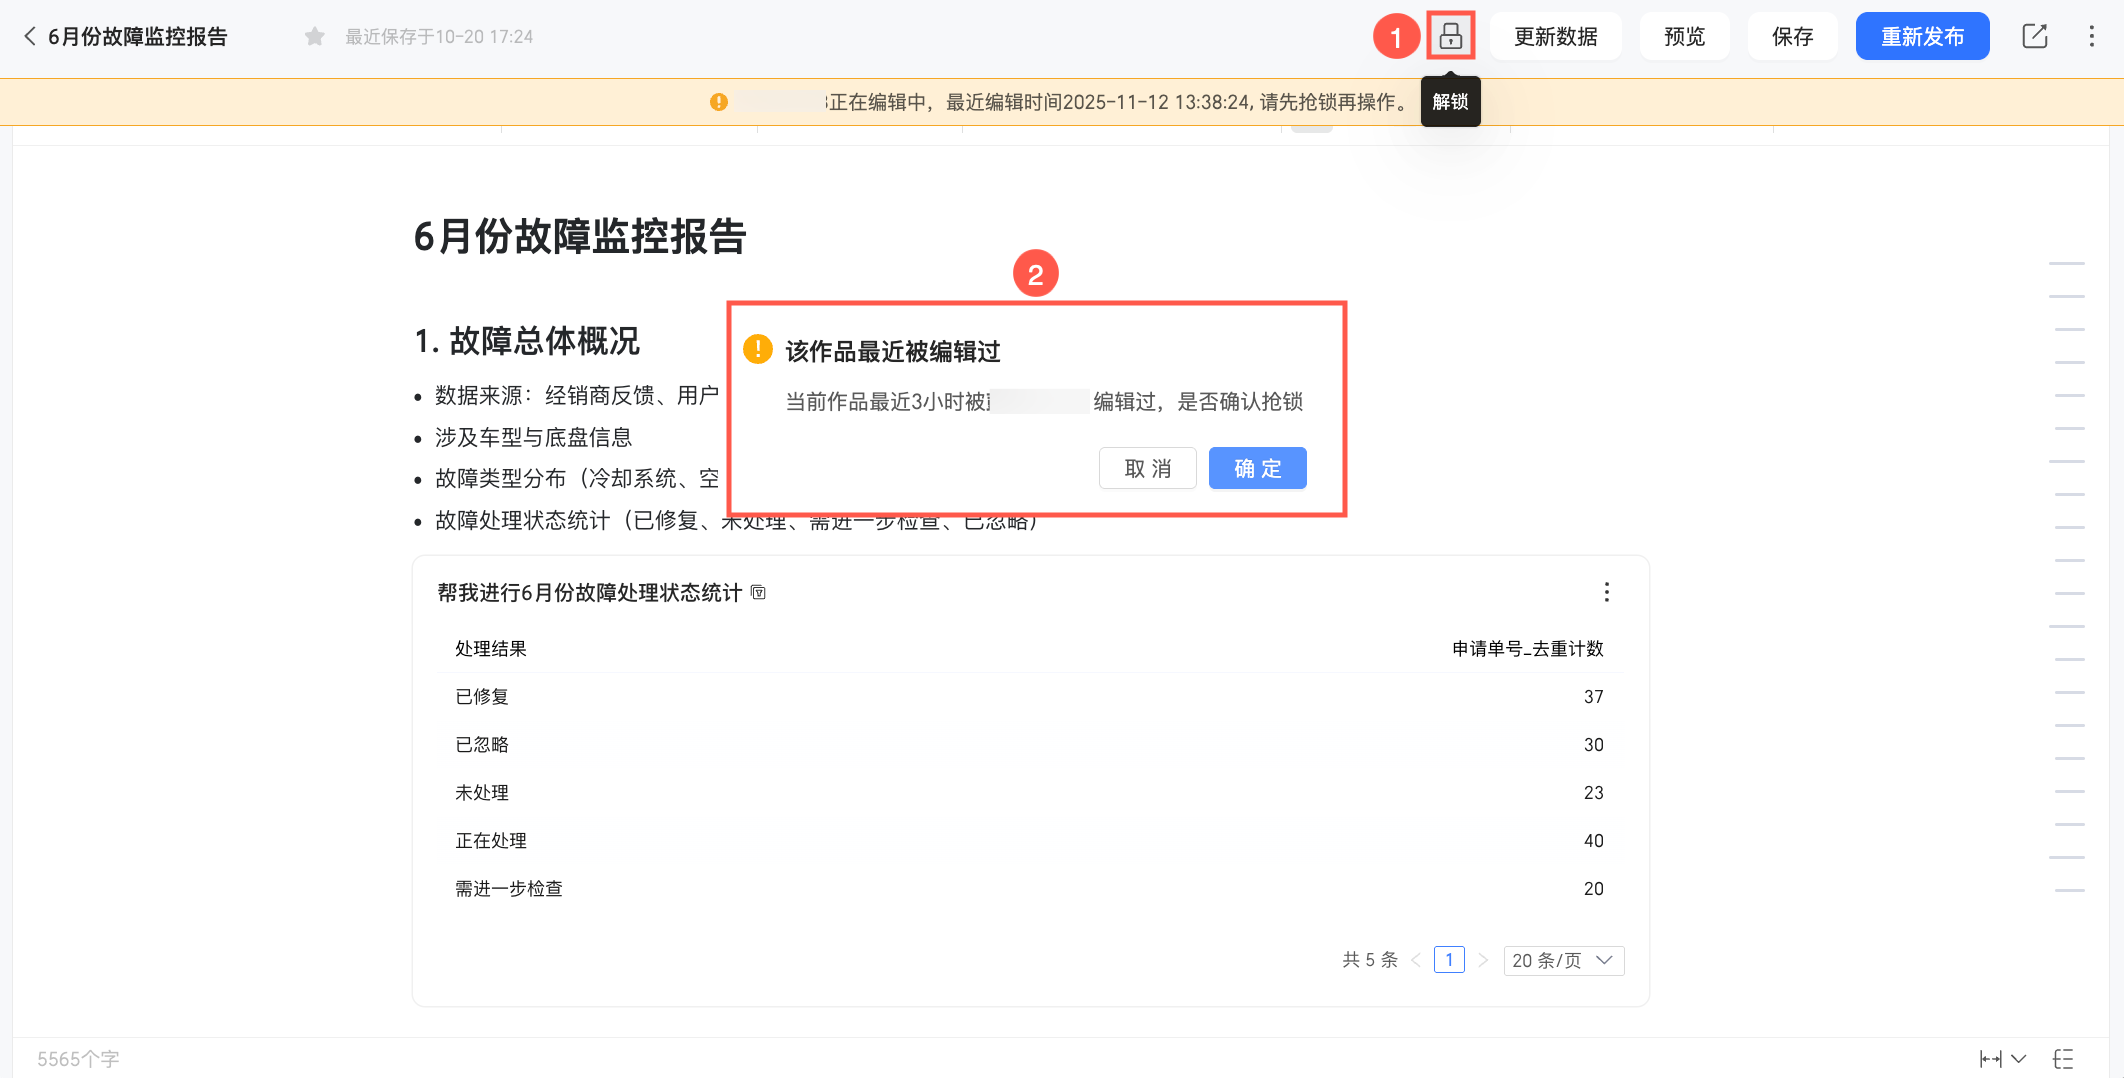
After you grant other users edit permissions for a report via collaborative permissions, the system activates an exclusive edit lock when multiple users try to edit the same report, ensuring only one user can modify it at a time. Check the lock status on the editing page using the edit lock ( ) icon.
-
A locked icon means you hold the edit lock and can edit the report.

-
An unlocked icon indicates that another user is editing the report. You can check the notification at the top of the page for their last edit time to see if they are still active. If they are inactive or you no longer need to wait, you can click the edit lock icon to request the lock. If your request is successful, the icon changes to a locked state, and you can modify the report.
Note the following limitations when inserting charts into a report during collaborative editing:
-
When editing a report, you can only insert charts you have permission to access. For example: If Collaborator A grants collaborator B collaborative permissions for a report, collaborator B can only insert charts that they have access to.
-
Inserting a chart into a report makes its content visible to all collaborators. For example: Collaborator A inserts a chart into a report that only they have access to and then grants collaborative permissions to collaborator B. After collaborator B acquires the exclusive edit lock, they can edit the report and view the content of the chart component inserted by collaborator A.
Therefore, before inviting collaborators, ensure all resources in the report are visible to them and do not contain sensitive or restricted data.
-
When you perform a data refresh on a report, the system verifies your data query permission for all chart components. If you lack permission for a specific component, the system displays an error message. The component remains in the report but cannot load the latest data. For example: If collaborator B holds the edit lock and tries to refresh the data for the entire report, the system will display the error "You do not have data query permission for the current component" for any chart component inserted by collaborator A that collaborator B lacks permission to query.
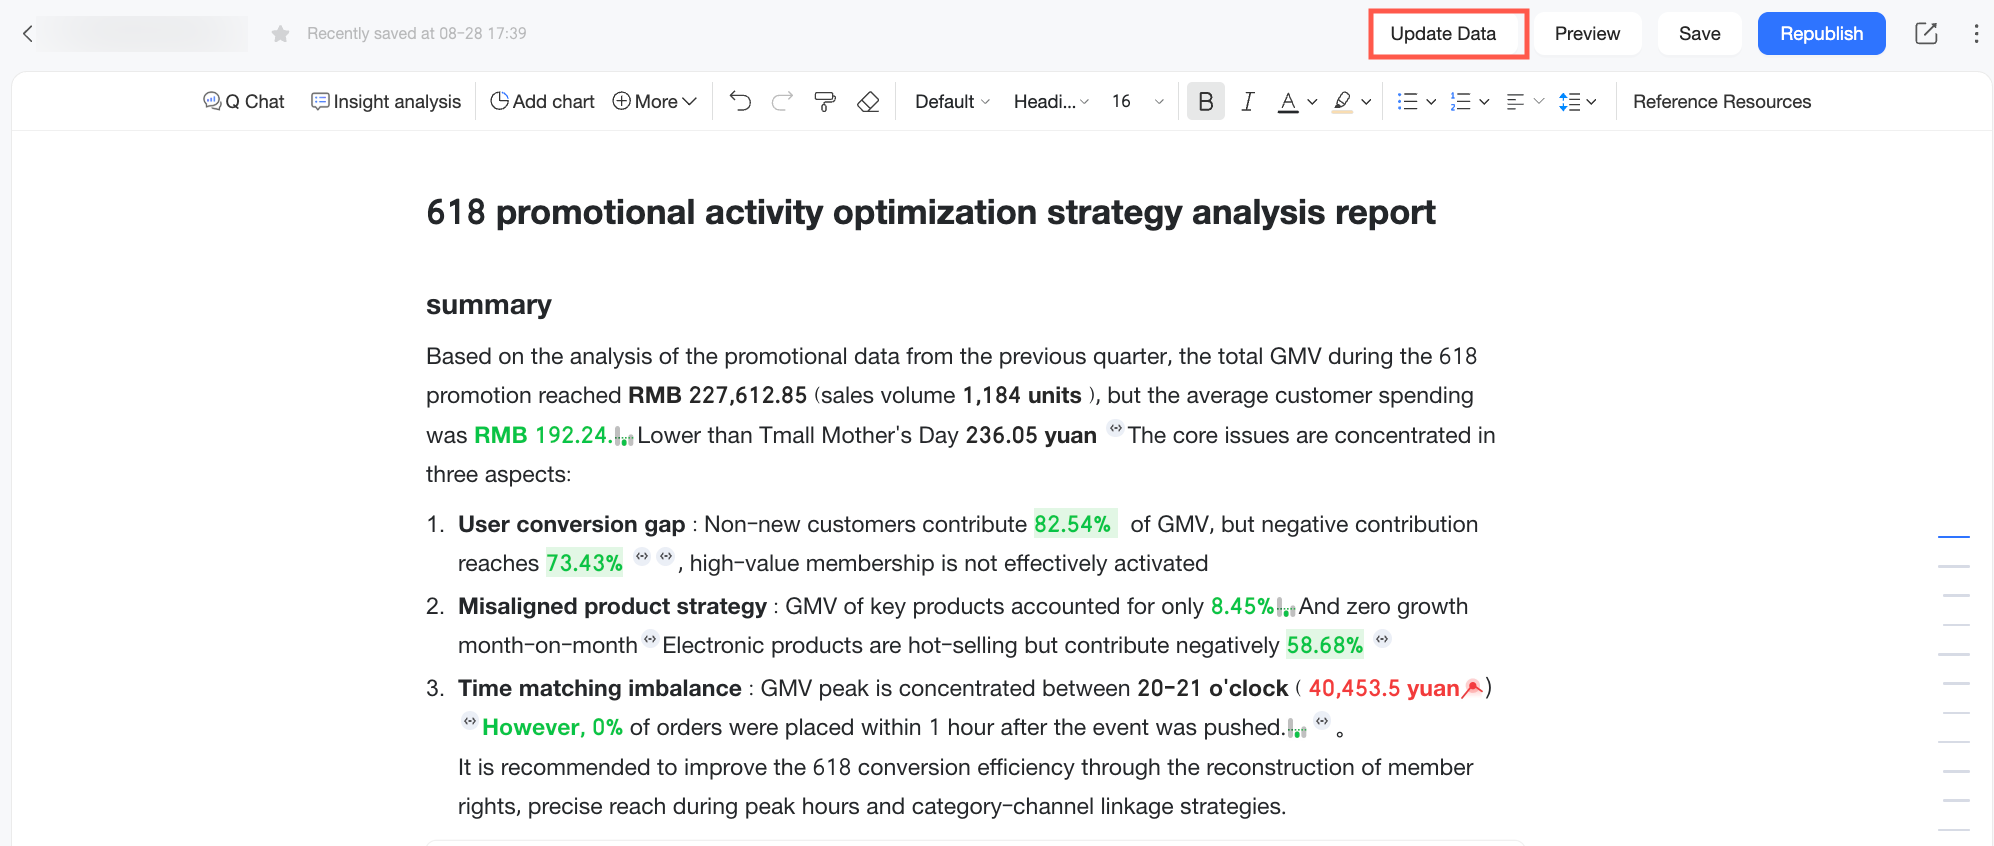
Update Data
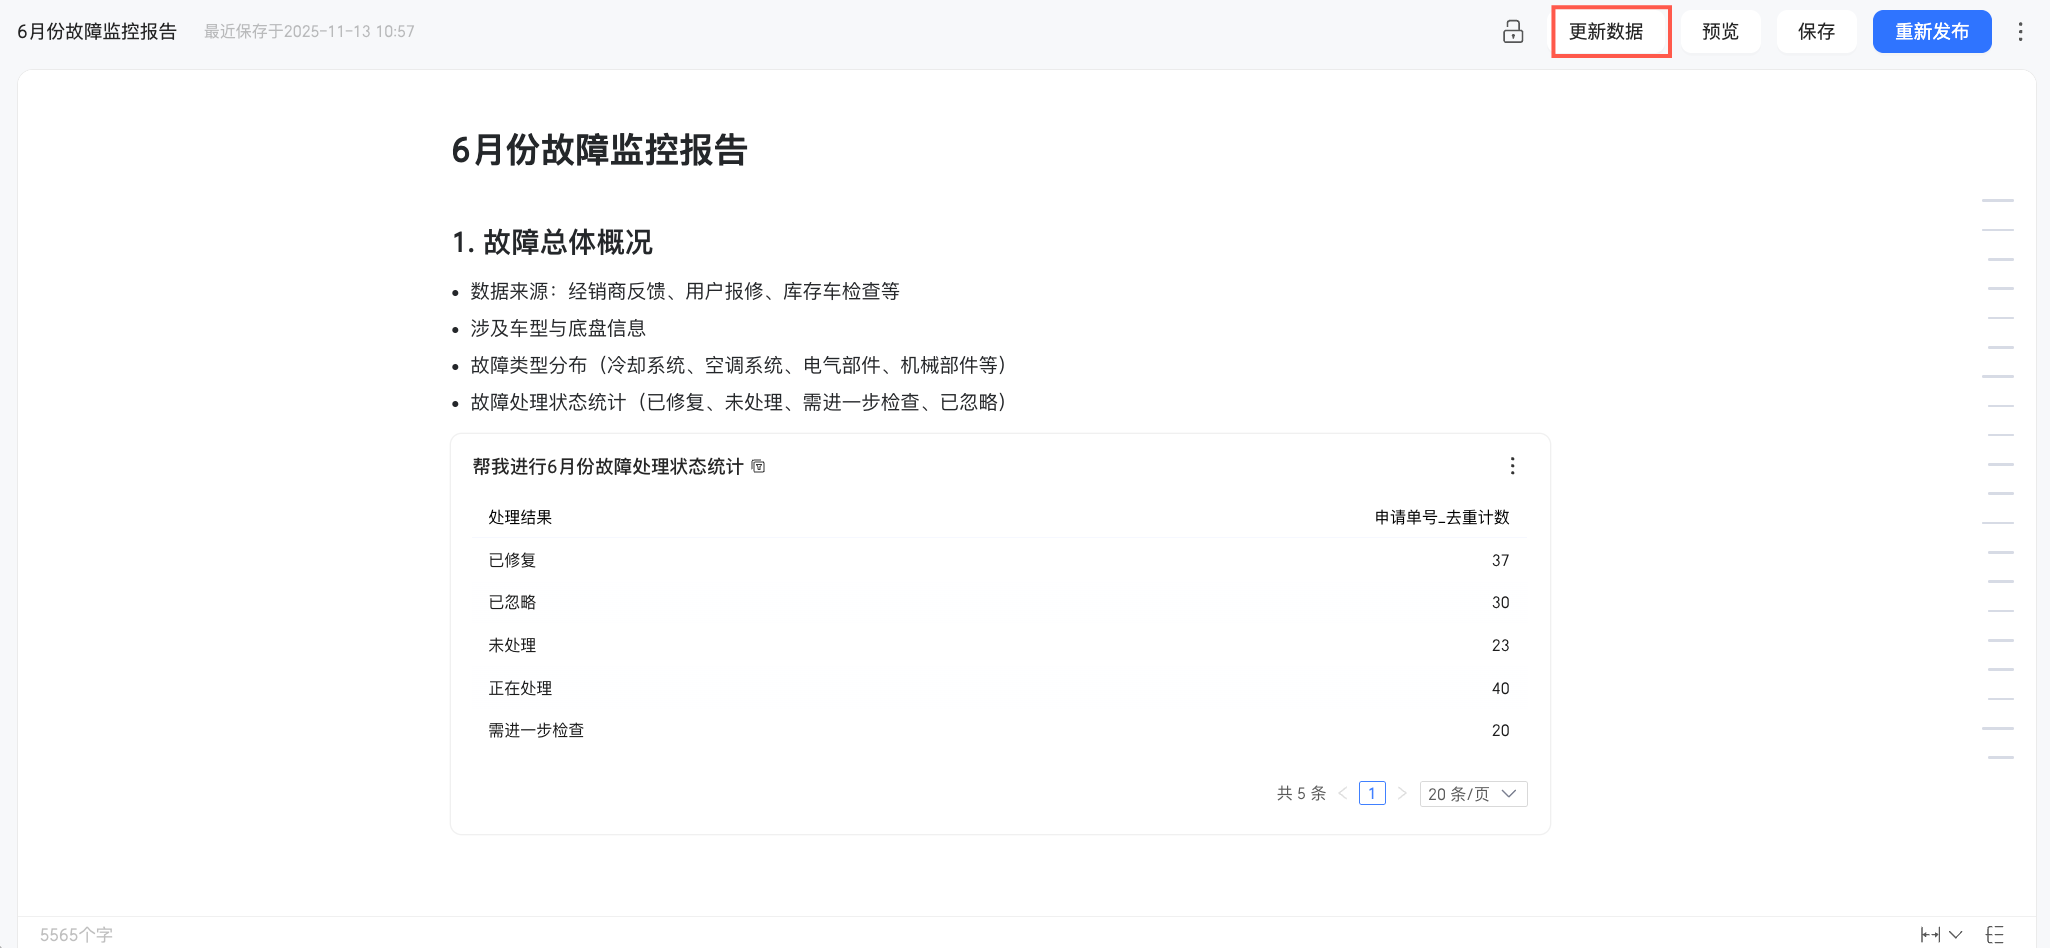
On the Q Report edit page, click Update Data in the navigation bar to refresh the report with the latest data. This is useful for recurring tasks, such as updating a monthly fault monitoring report.
-
Updating the data also updates all dynamically referenced content in the report. This includes dashboard charts, Intelligent Query results, insights and analysis, and attribution reports. Verify the regenerated content.
-
This action updates the entire report. If you only need to update specific dynamic content, such as Intelligent Query results or insights and analysis results, you can update them individually without affecting other content. For instructions, see Update Intelligent Query results and Update insight results.
-
After you enable data permissions for a report, you can update its data on the preview page. For details, see Data Permissions.
If you generated the report from a dataset in one click, you can configure the data update mode in the Report Content Update Prompt dialog box.
You can choose between two modes: Partially Update Components or Full Update.
-
Partially Update Components: Updates only the dynamically referenced content in the report, including inserted dashboard charts, Intelligent Query results, and insights and analysis.
-
Full Update: Regenerates the entire report based on the latest data from the referenced dataset. This action overwrites all existing content.
Note-
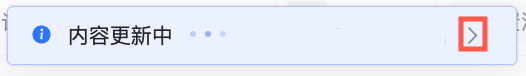
While a full update is in progress, a panel automatically expands on the right to display its status. While the update is running, configuration settings on the report page are unavailable.
-
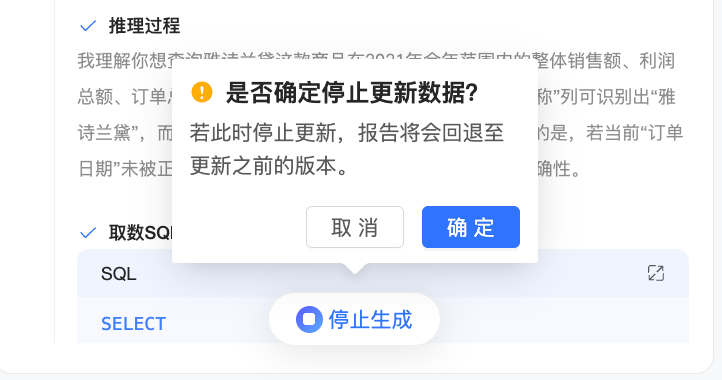
If you click the Stop Generation button and then Confirm while the update is running, the report reverts to its previous version.
-
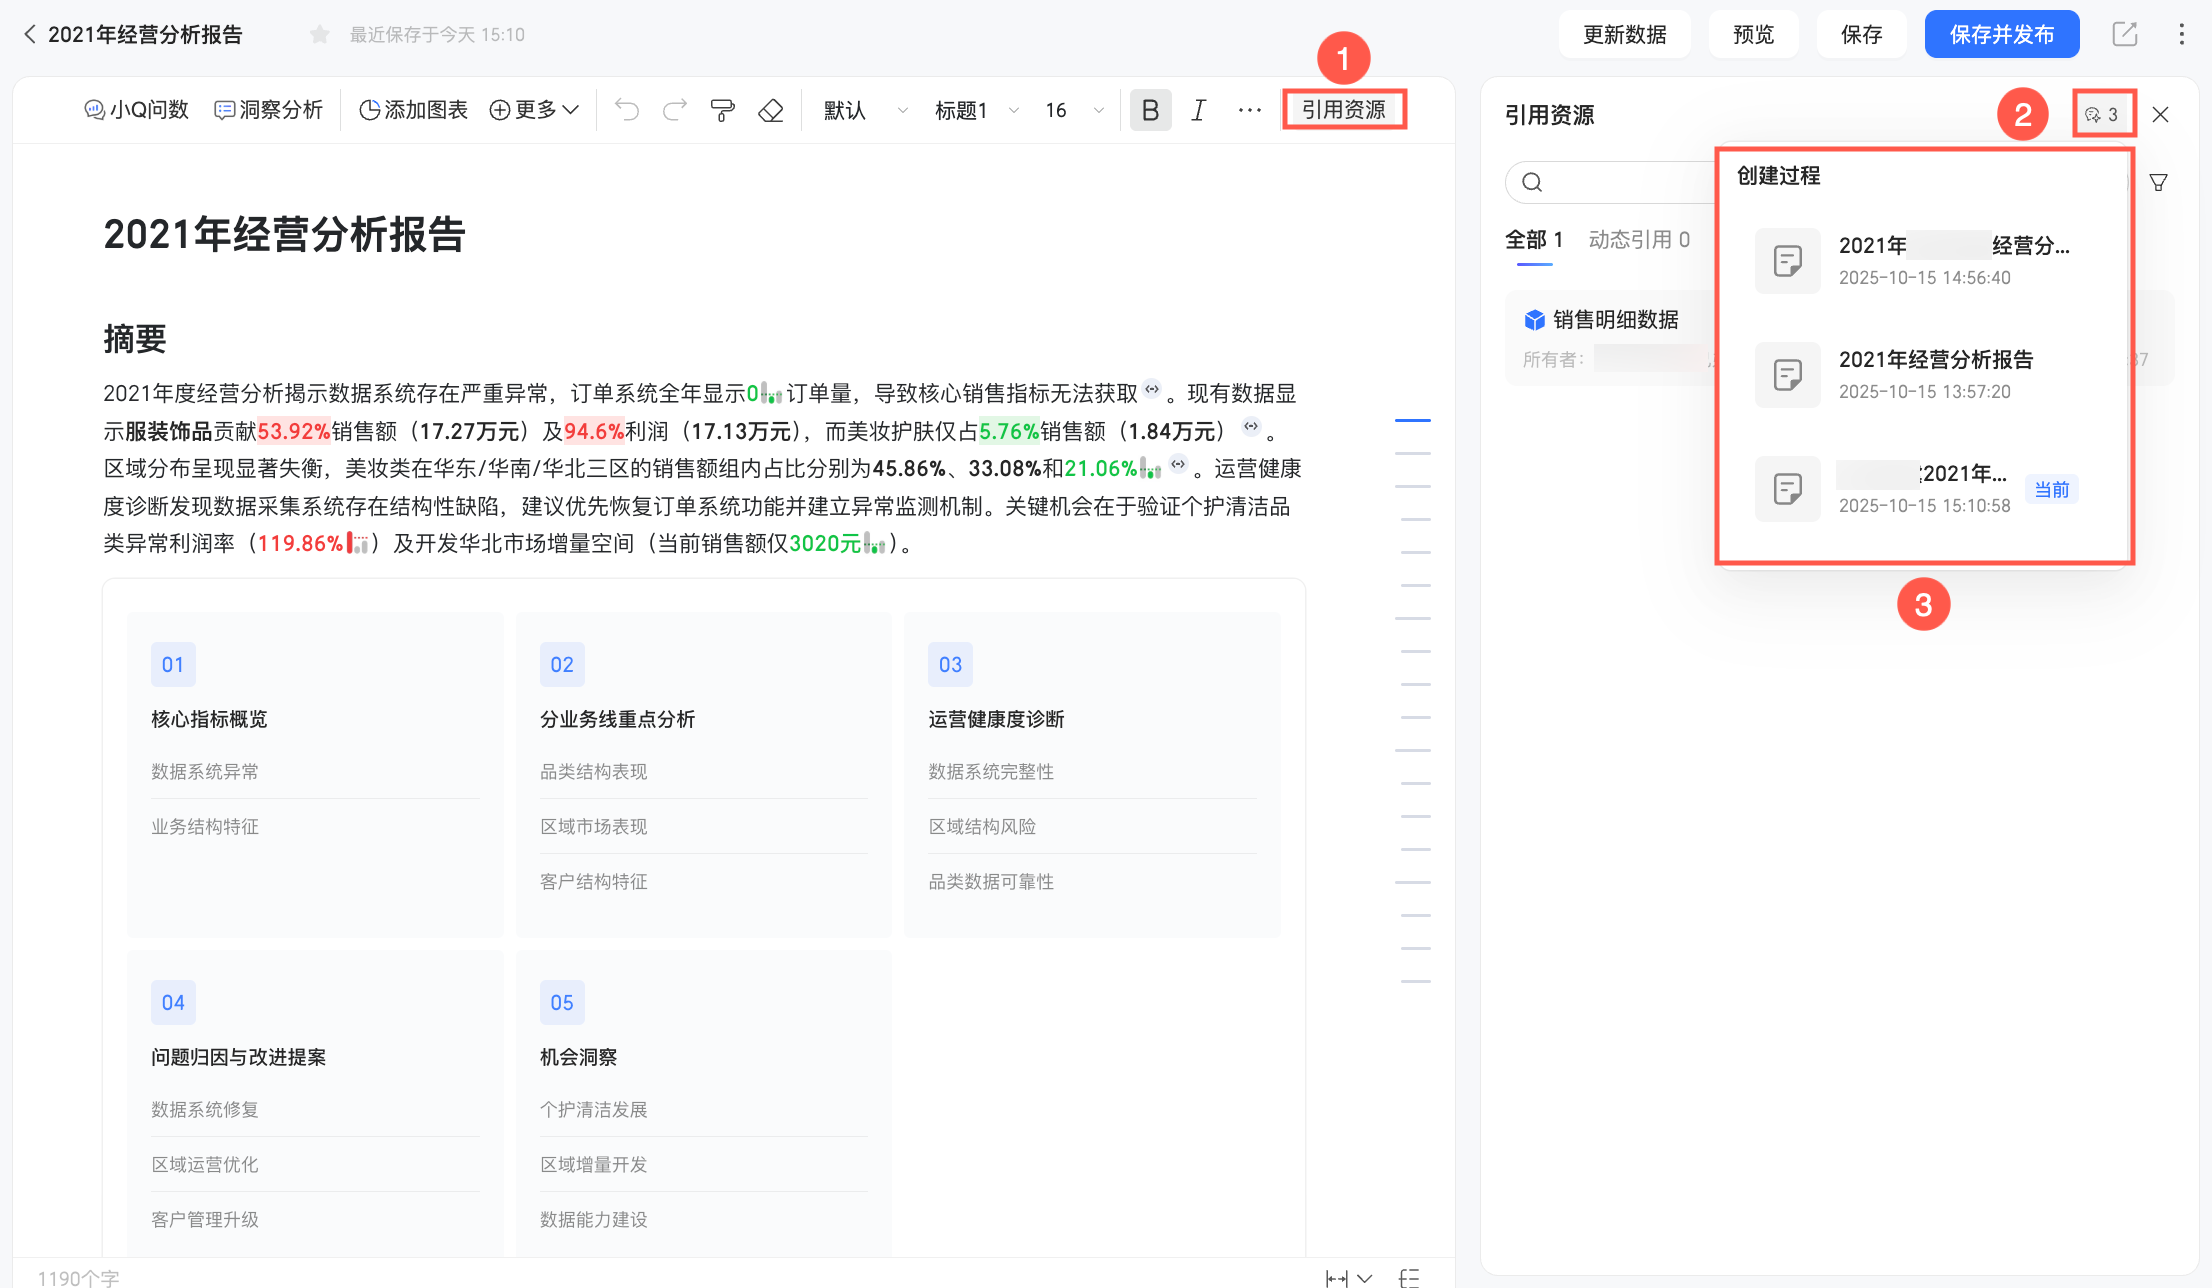
If you accidentally close the progress panel during the update, click the
icon in the notification bar to reopen it. -
After the update completes, you can view the report's creation history under Referenced resources > creation process, even if you have closed the progress panel.
-

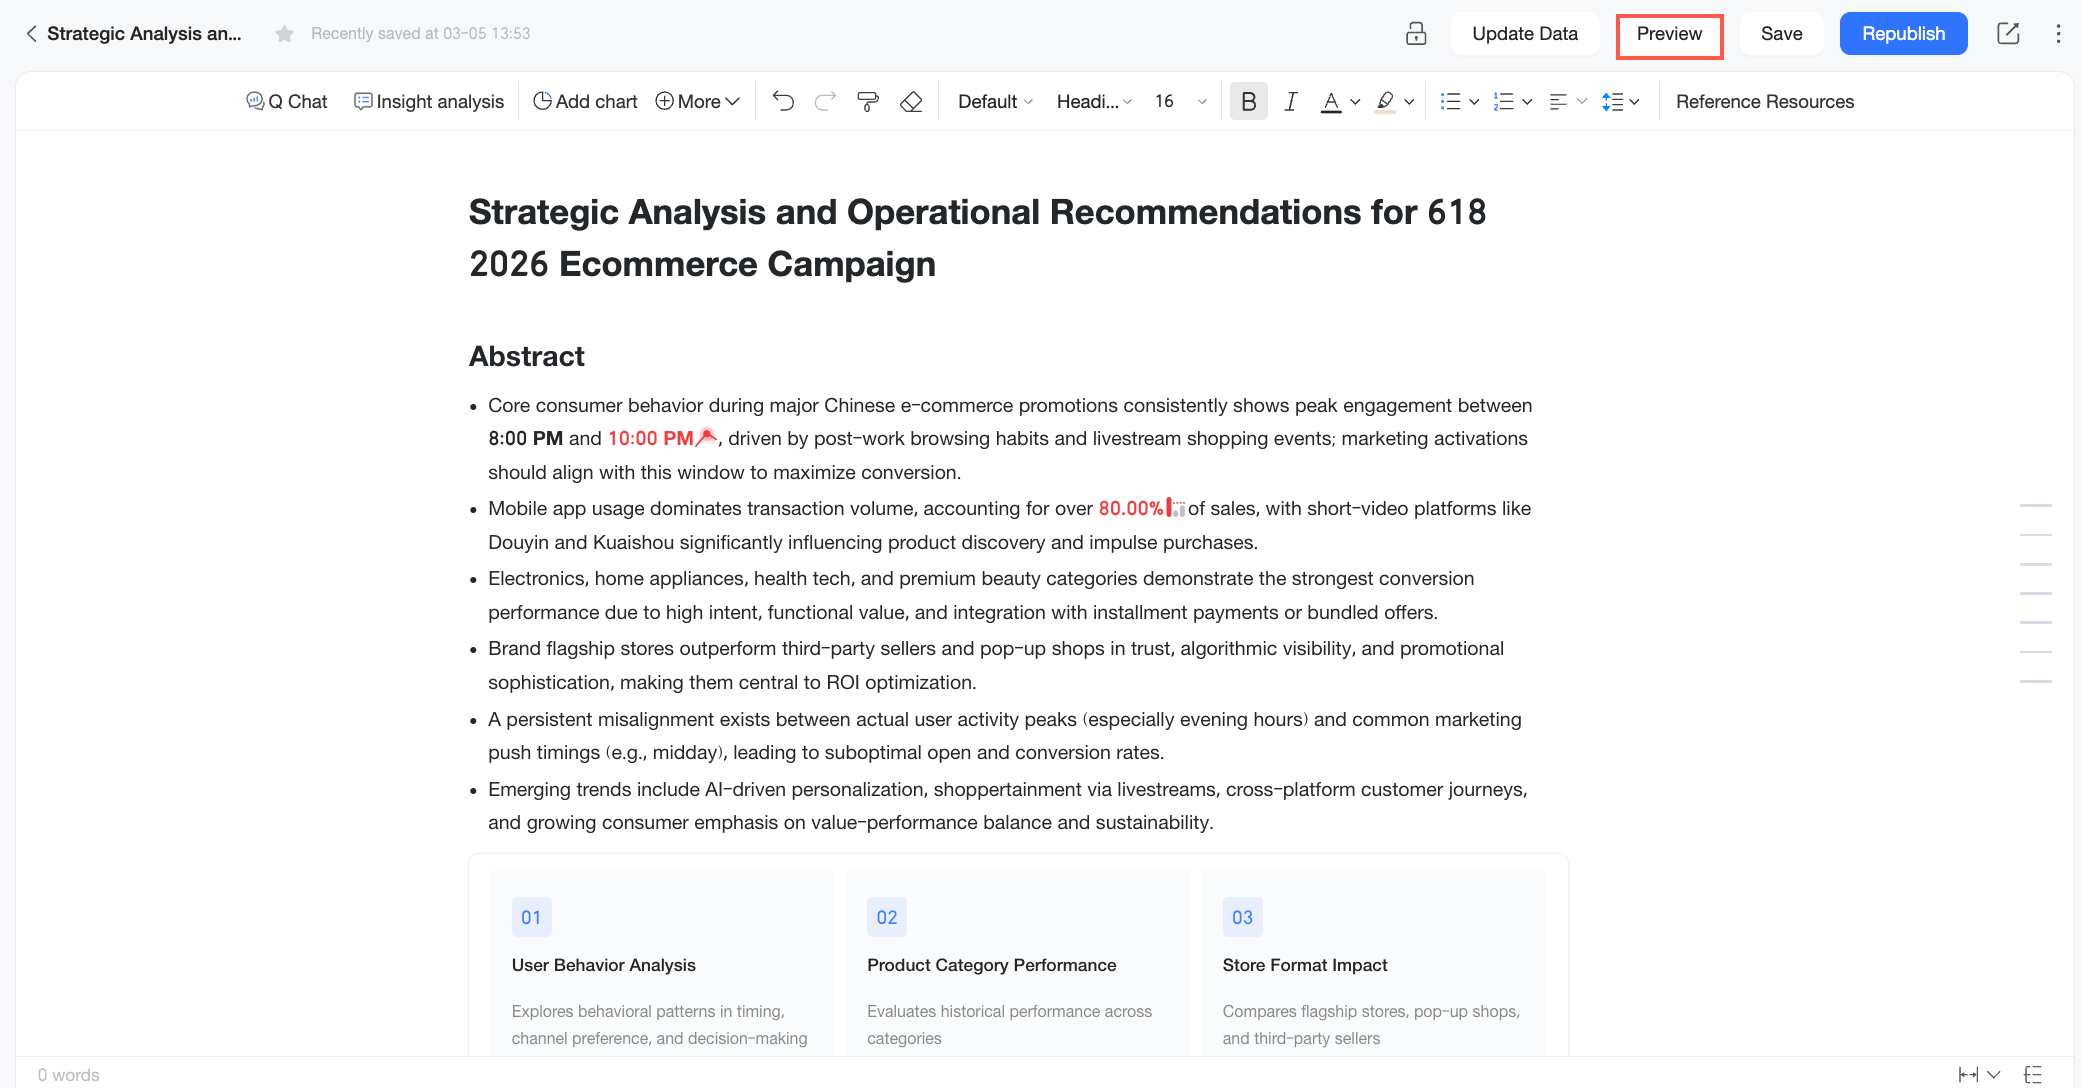
Preview
On the report editing page, click Preview in the navigation bar to preview the report.
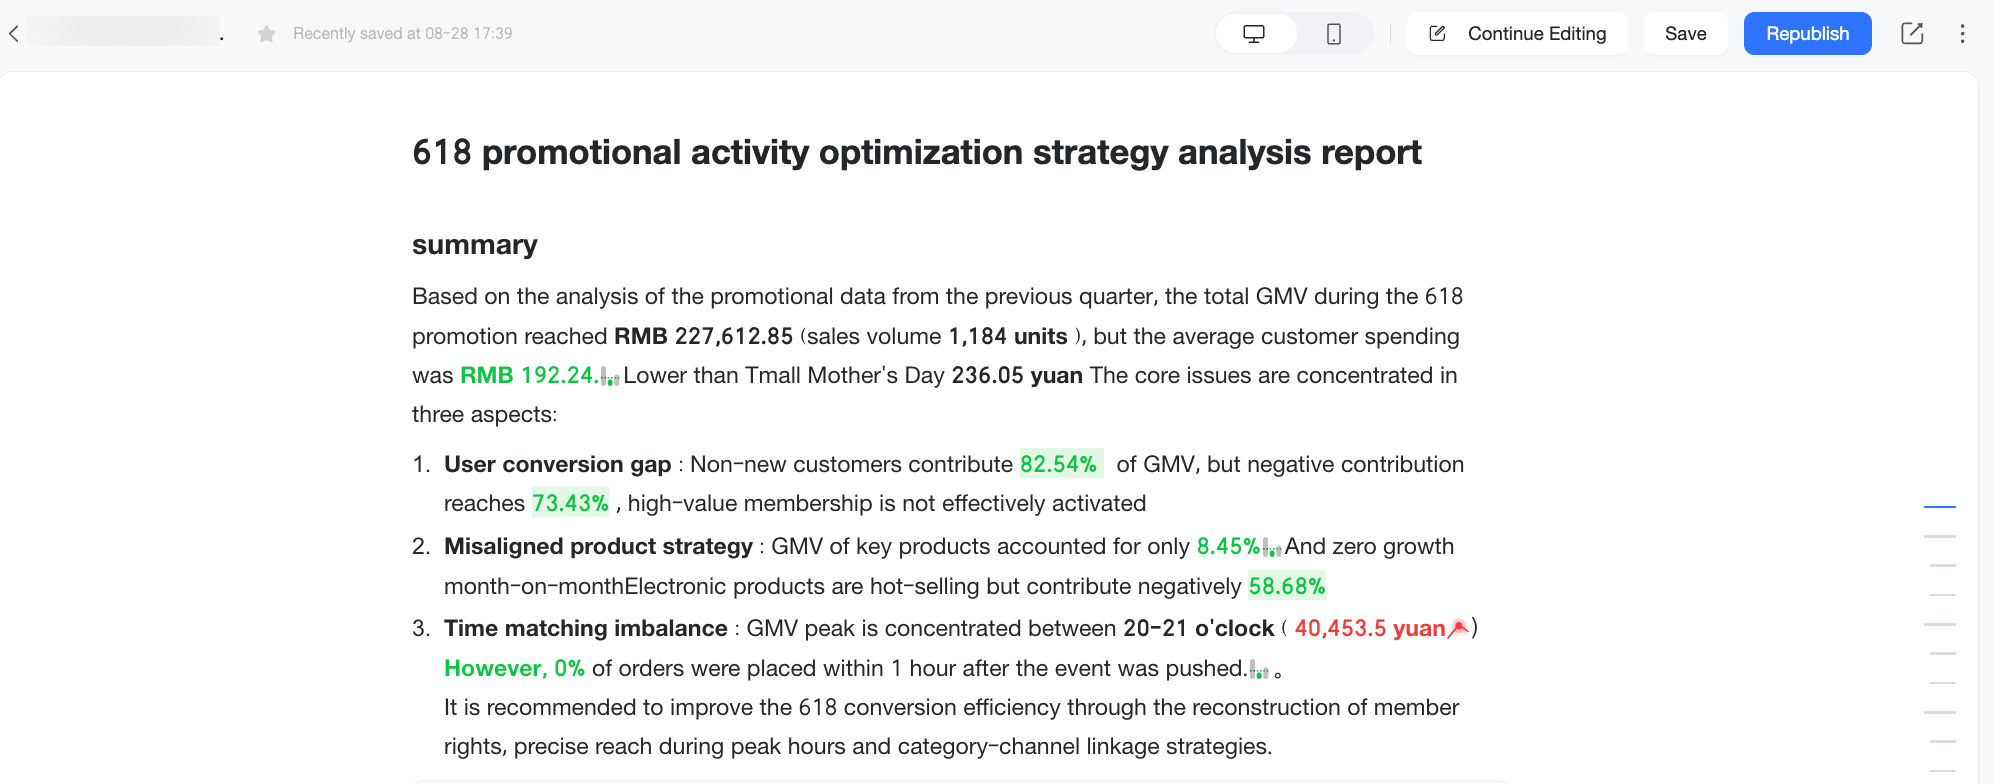
In preview mode, click Continue Editing in the navigation bar to return to the report editing page.
Archive
Use cases: Archive a report to track how data evolves over time or compare multiple versions. For example, archiving the same report for January, February, and March lets you compare trends in key business indicators during a monthly review.
You can archive a Q Report in preview mode. Any viewer can create an archive that captures the report content at a specific moment, including updates based on their dynamic data permissions, for future reference and comparison.
-
This feature is exclusive to paid subscribers of the Quick BI report service and is not available to trial users.
-
You can only archive reports in preview mode.
-
Each user can archive the same report a maximum of 100 times. Once you reach the limit, you cannot create new archives for that report.
-
You cannot archive a report from a preview page that was accessed through a public sharing link.
-
Published reports can be archived, but unpublished reports or reports that have been taken offline cannot. After a report is taken offline, you cannot view its archive history.
Follow these steps to archive a report:
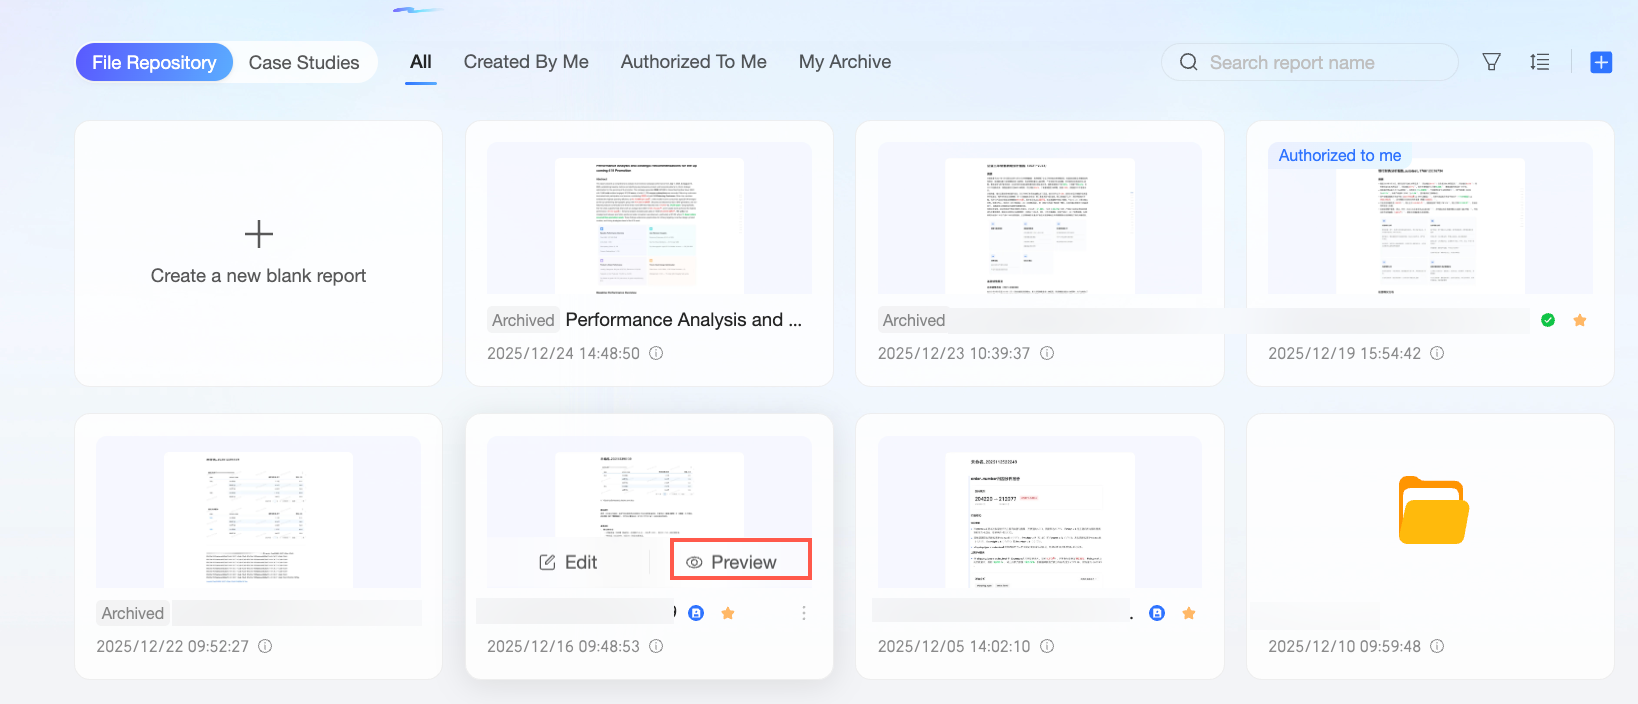
-
On the report list page, hover over the target report and click Preview.
You can also click Preview on the report editing page.
-
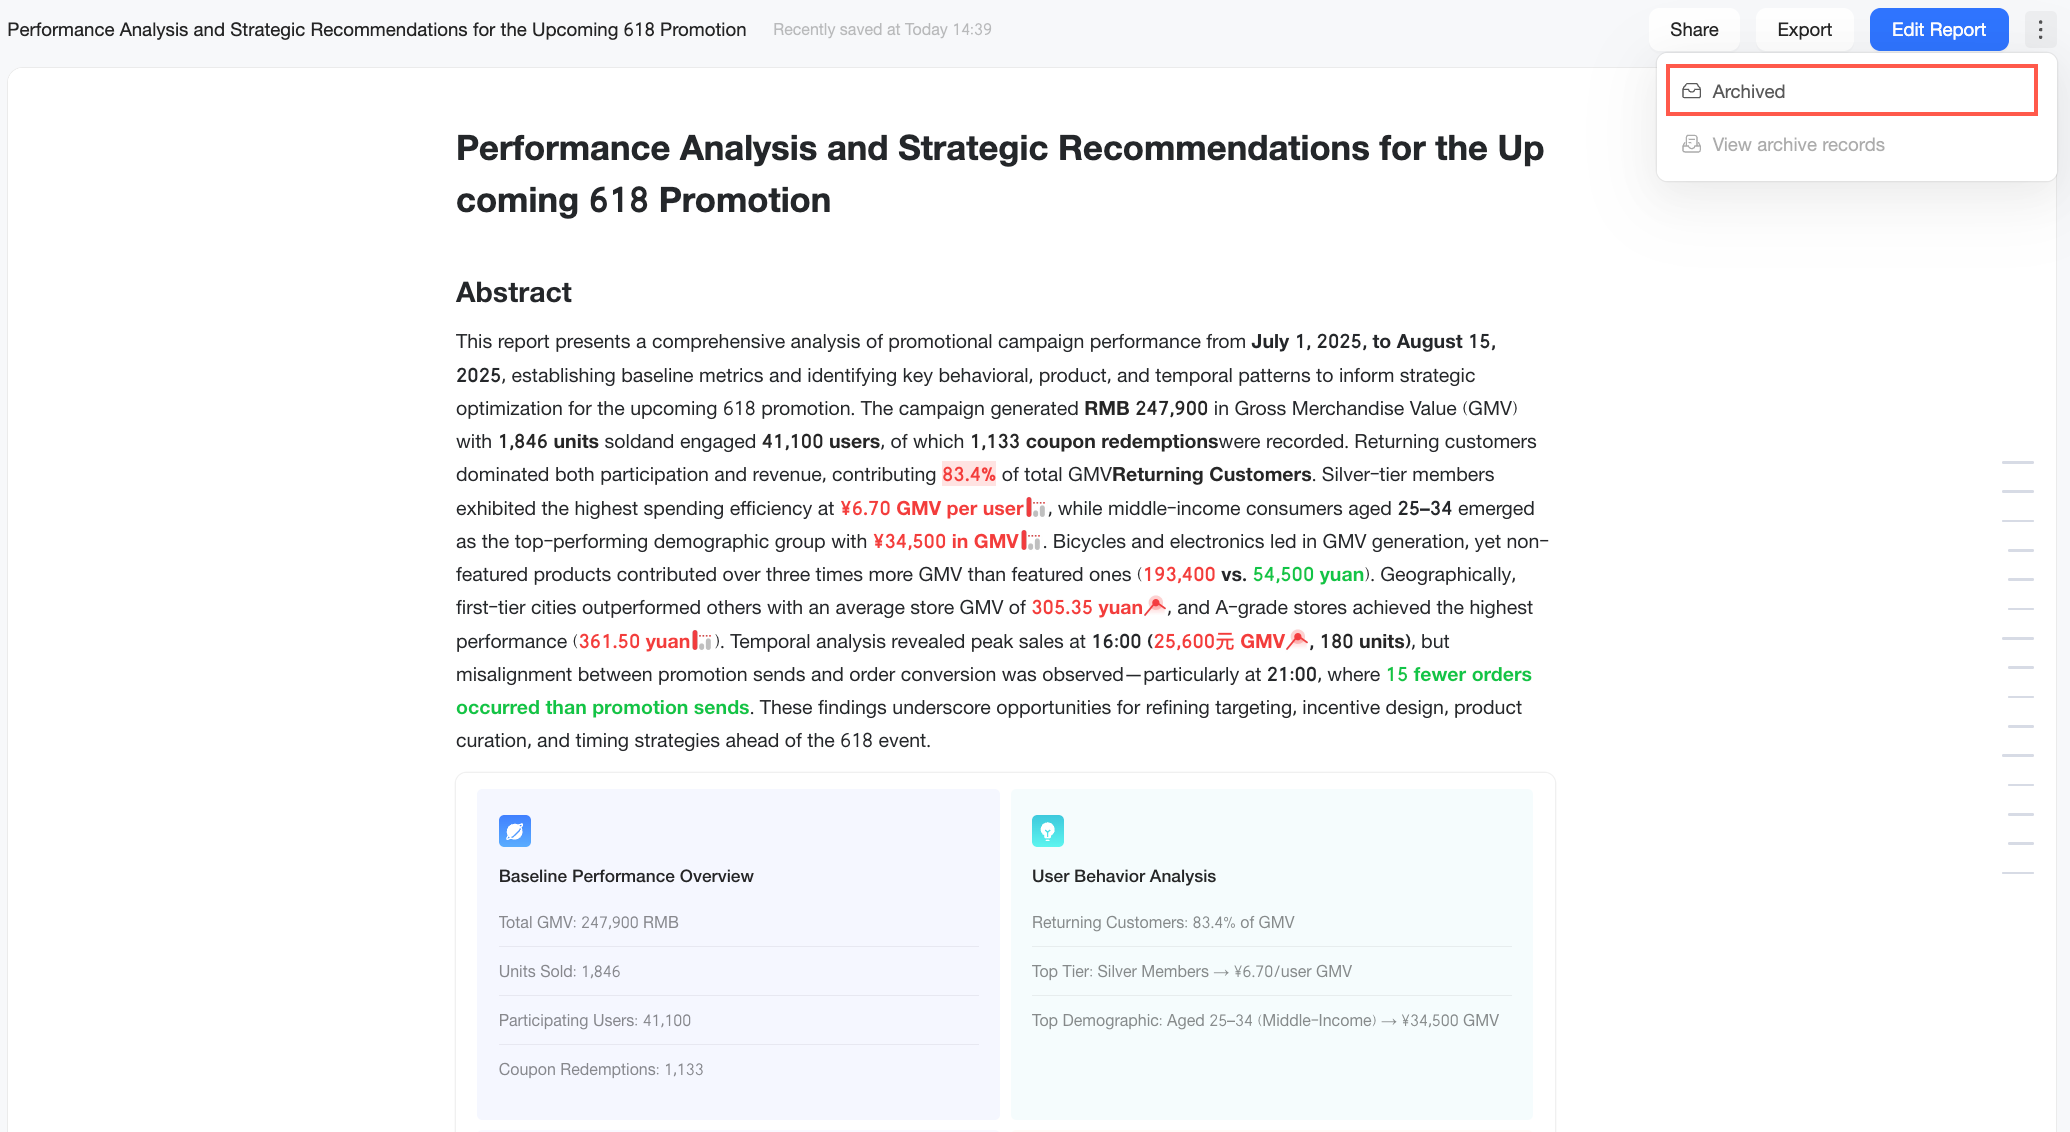
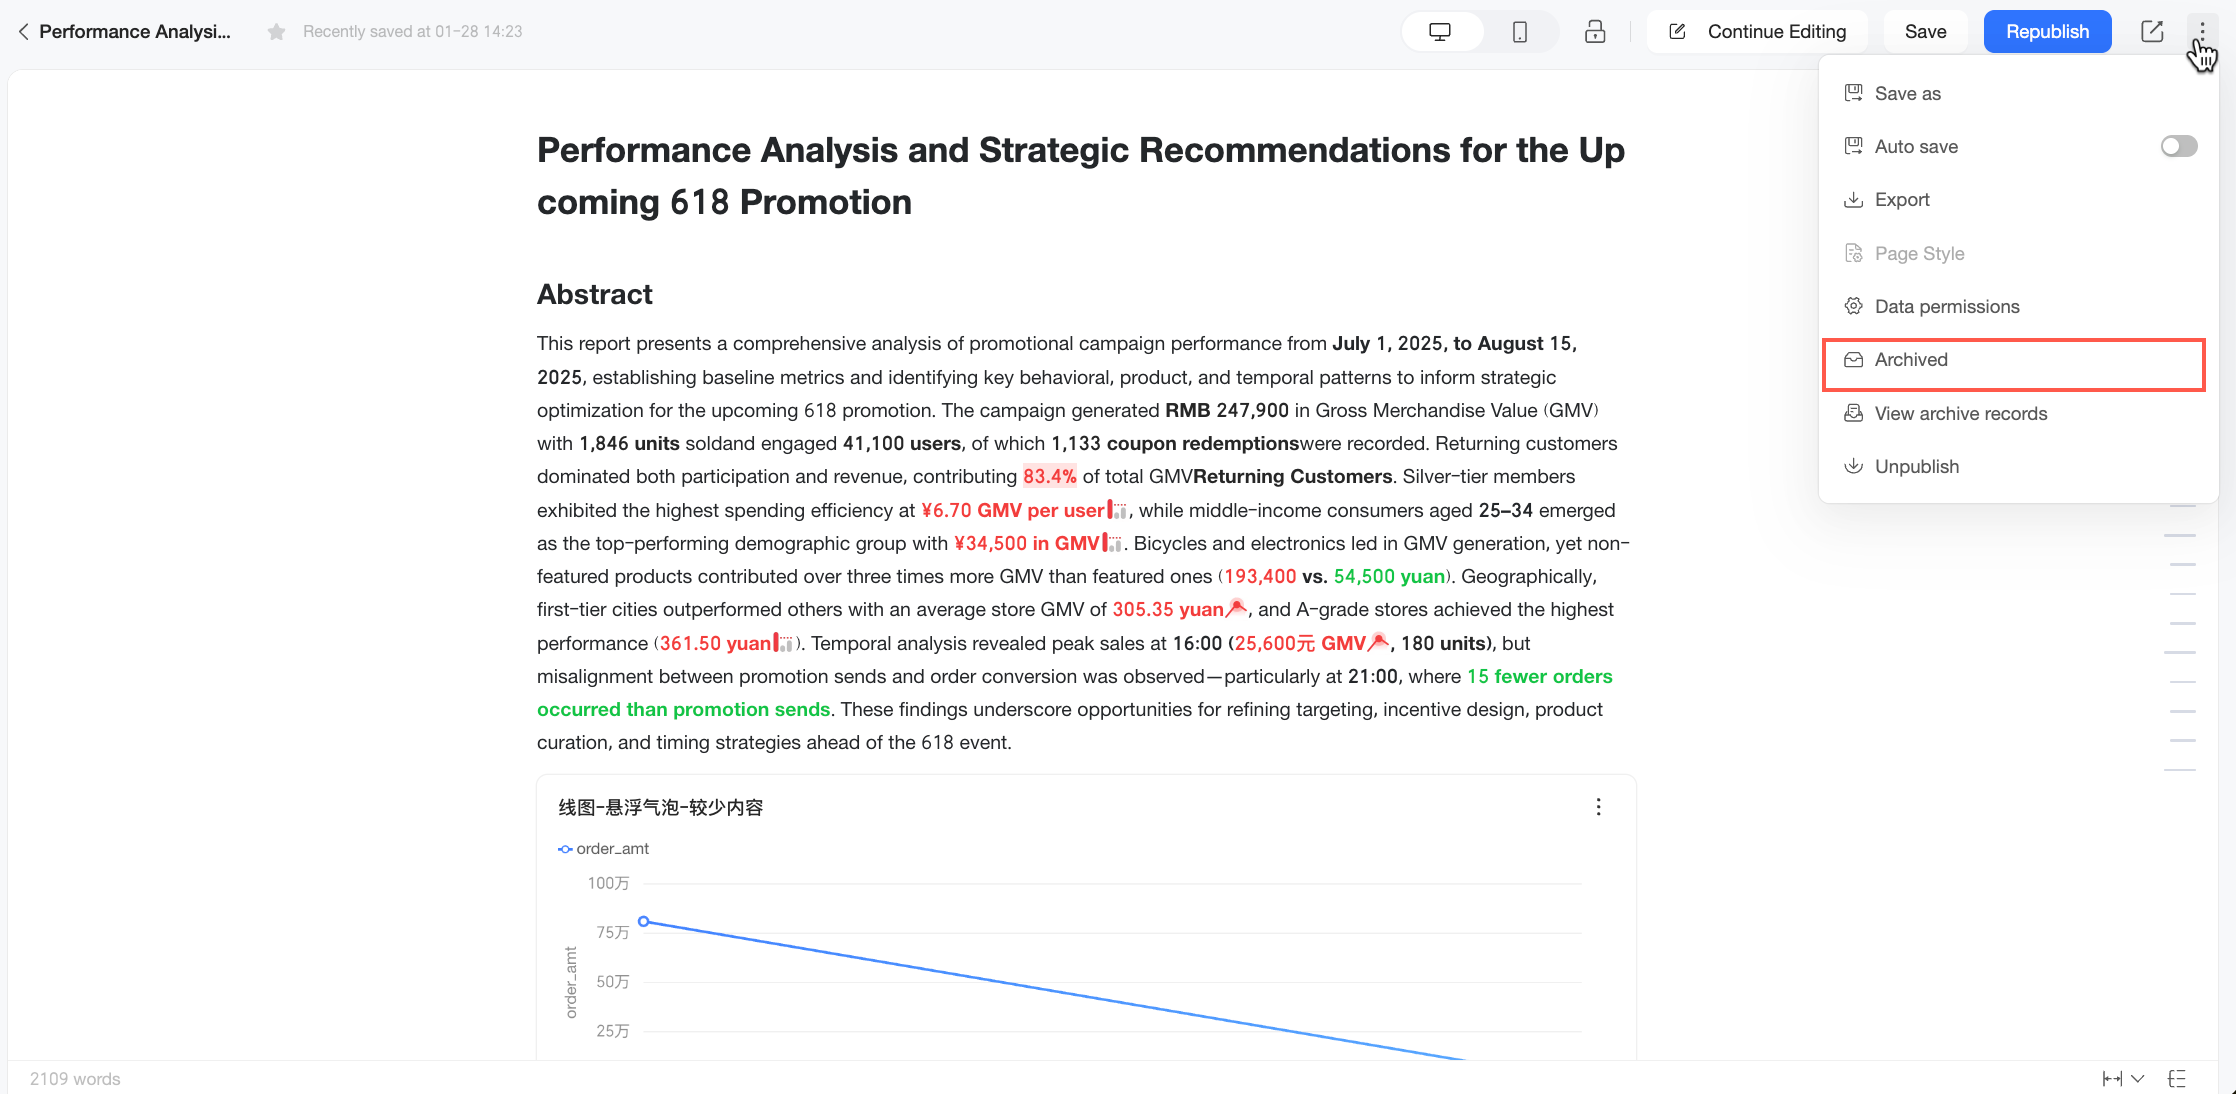
On the report preview page, click the
icon in the top toolbar and select Archive from the drop-down list.You can also click the
icon and select Archive while in preview mode on the editing page.NoteWhen you archive from the editing page, the system saves the content currently displayed in preview mode.
-
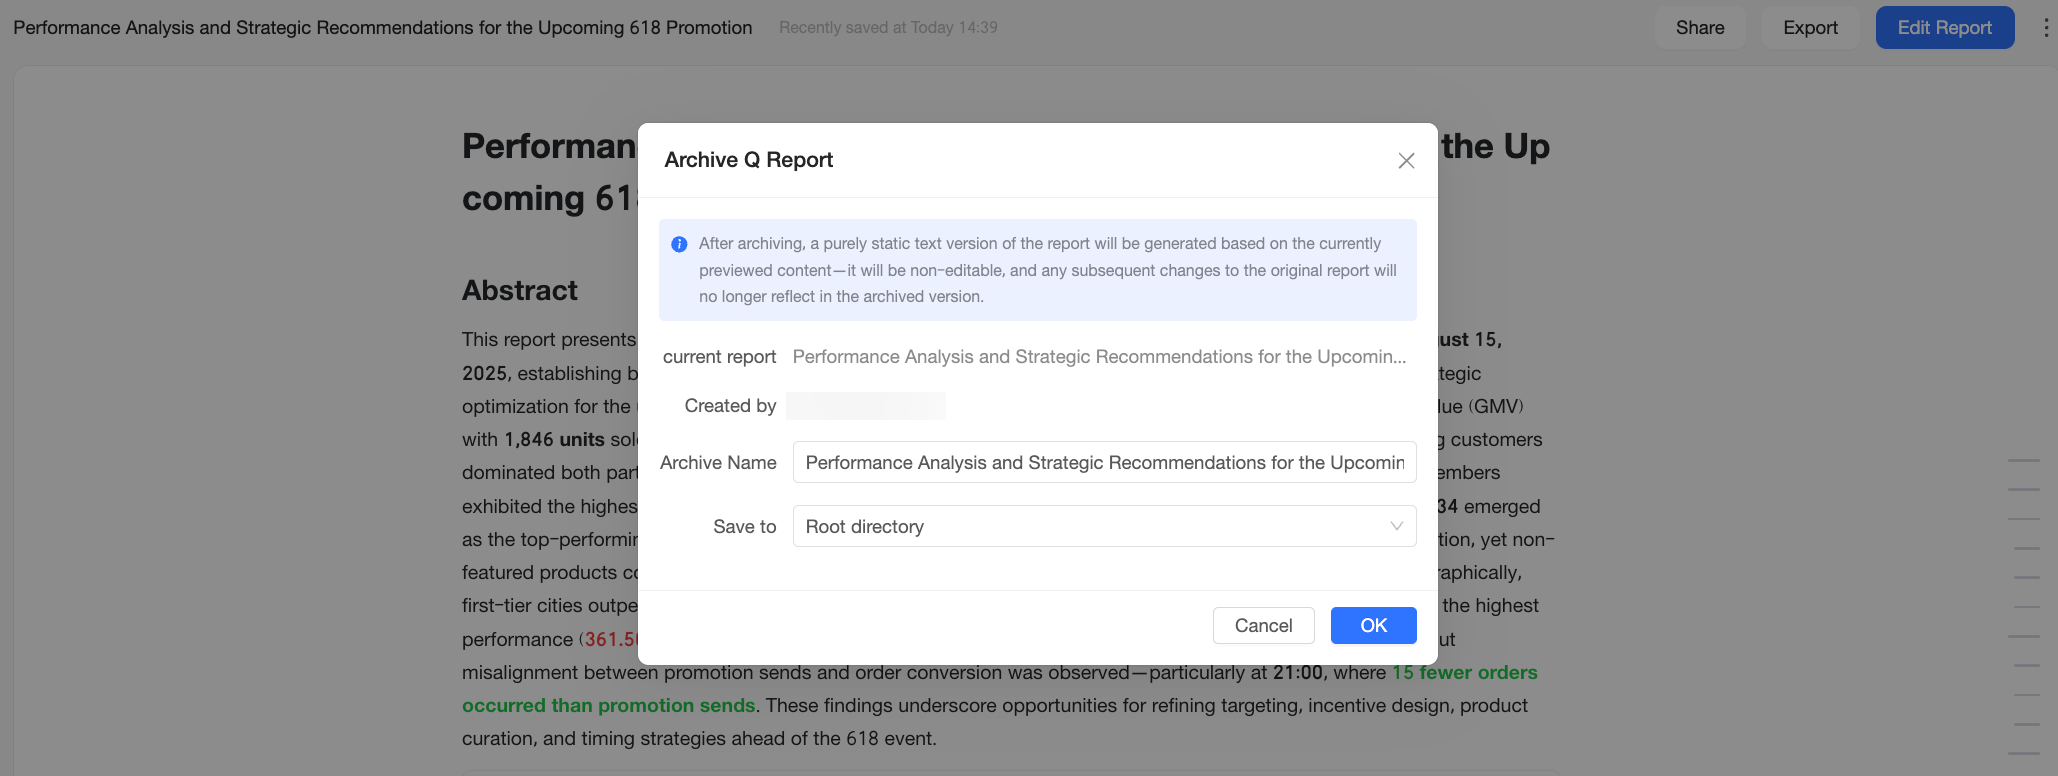
In the Archive Quick BI Report dialog box, the current report's name and creator are displayed. You also need to configure the Archive Name and Location.
-
Archive Name: The name for the archived report. The system automatically generates a name in the format
ReportName_Archive_YYYYMMDD_HH_MM_SS. You can customize this name to reflect its business purpose, making it easier to identify the archive's version and content later. -
Location: The directory where the archived report will be stored. By default, it is saved to the root directory. Click the drop-down box to select an existing folder and organize archives by department, project, or topic.
-
-
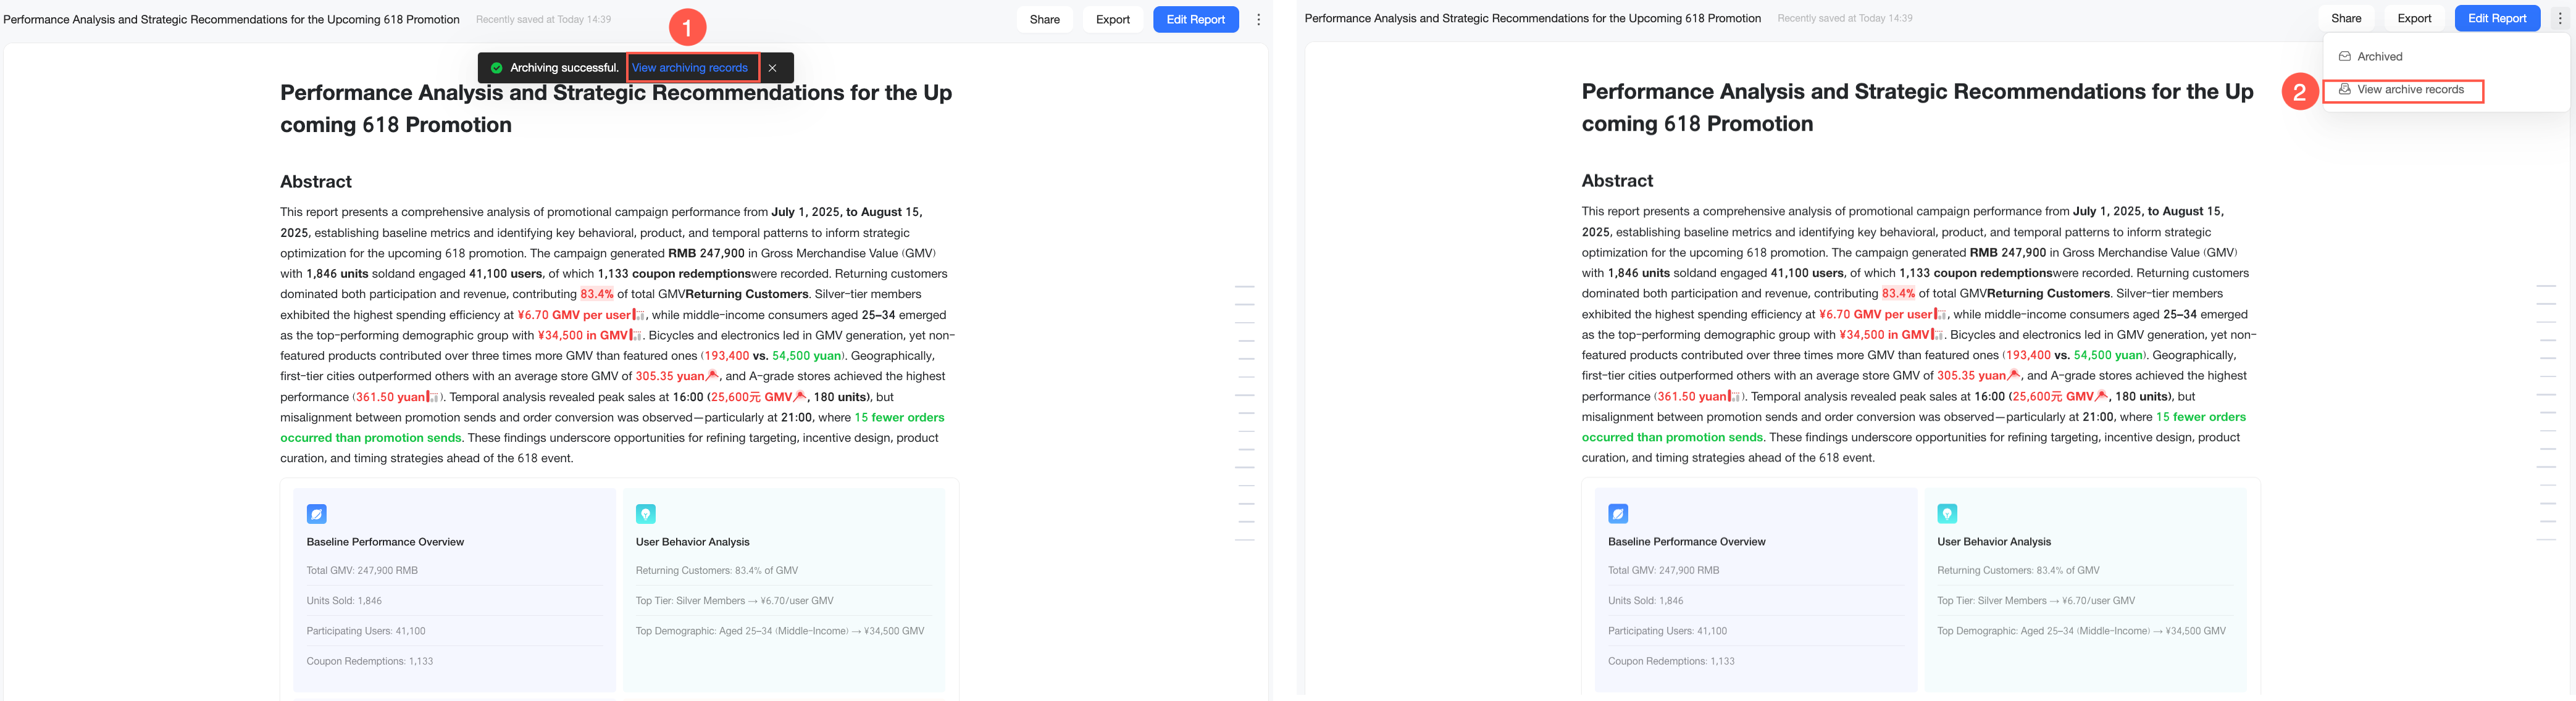
Click OK to create an archive based on the current view. Once the archive is created, you can go to the Archive History page by clicking View Archive History (①) in the success message or by selecting View Archive History (②) from the more options list.
NoteThe View Archive History option appears in the more options list only if the current report has been archived at least once.
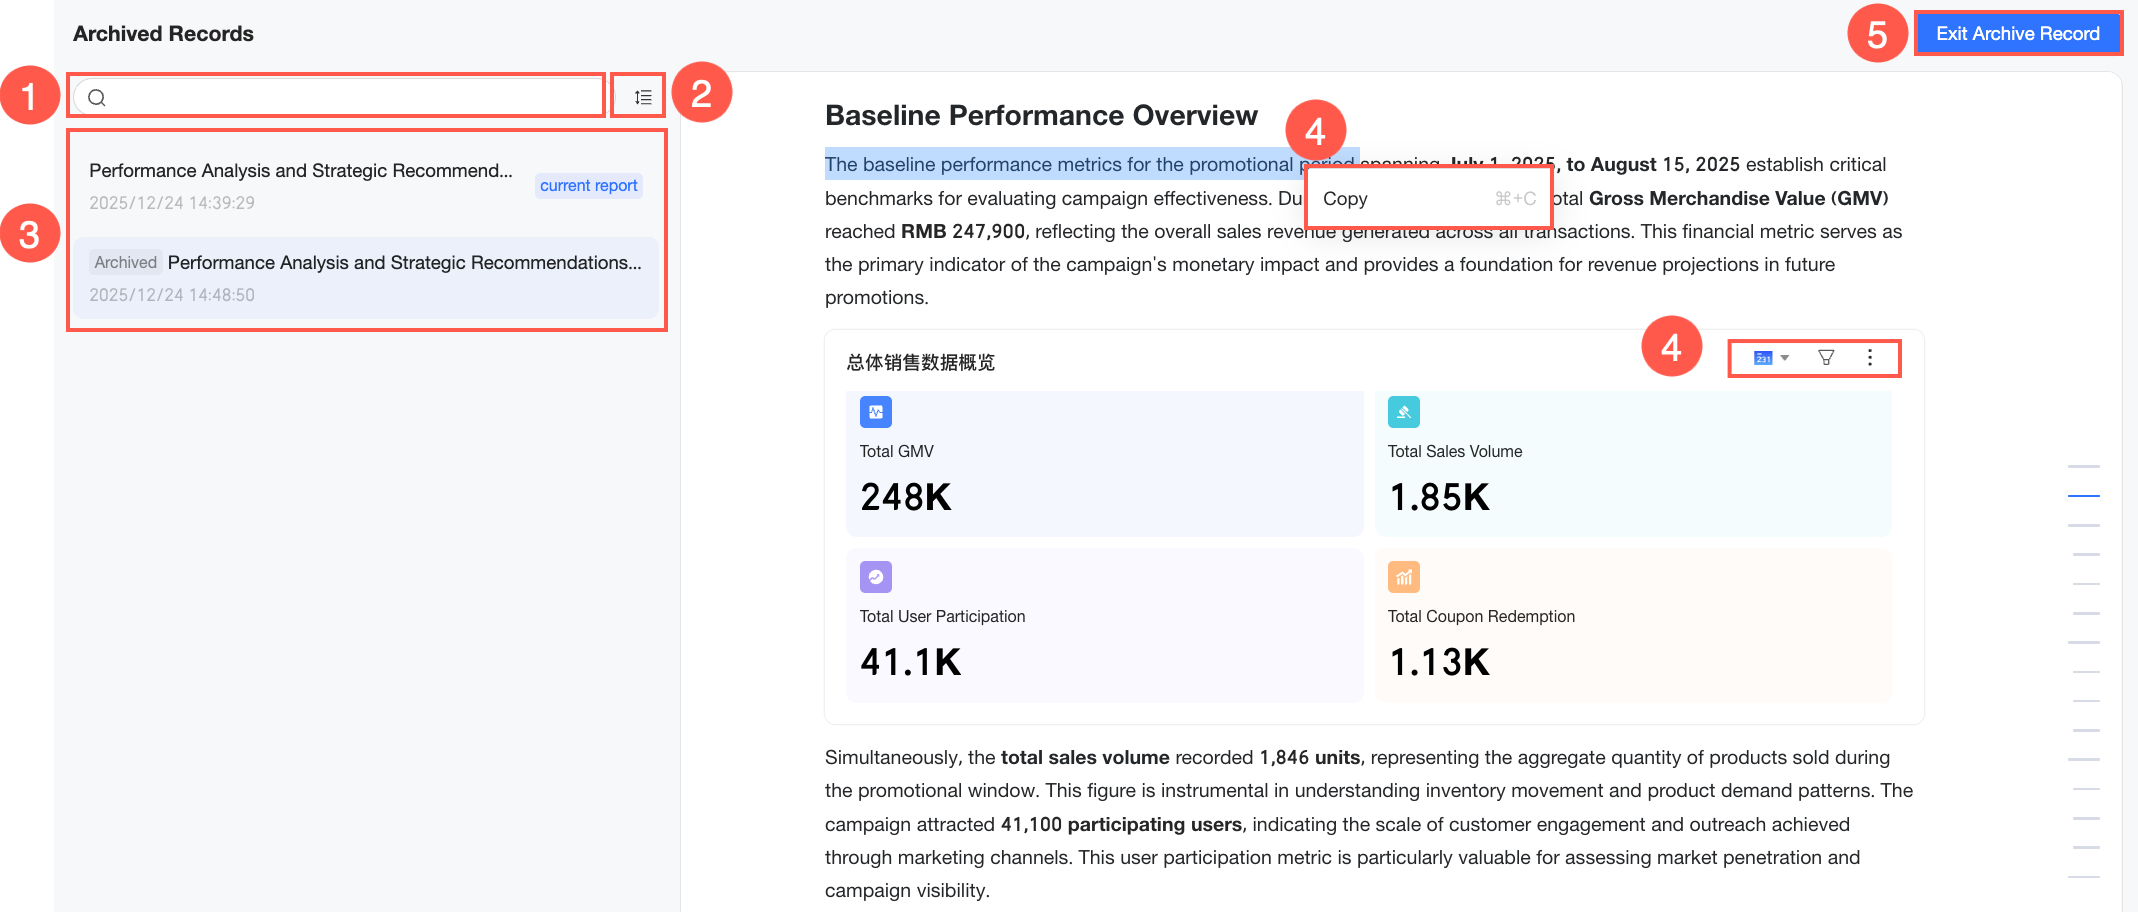
The Archive History page displays the original report and all of its archived versions. You can perform the following operations here.
-
① Search: Enter keywords from an archive name into the search box to quickly locate a specific version.
-
② Sort: Sort archives by Latest (newest to oldest) or Earliest (oldest to newest).
-
③ Version switching: Switch between different versions in the list on the left to quickly view and compare their content.
-
④ Content operations: You can select and copy text content within an archived version, but you cannot edit it.
-
⑤ Exit Archive History: Click to return to the original report's preview page.
-
-
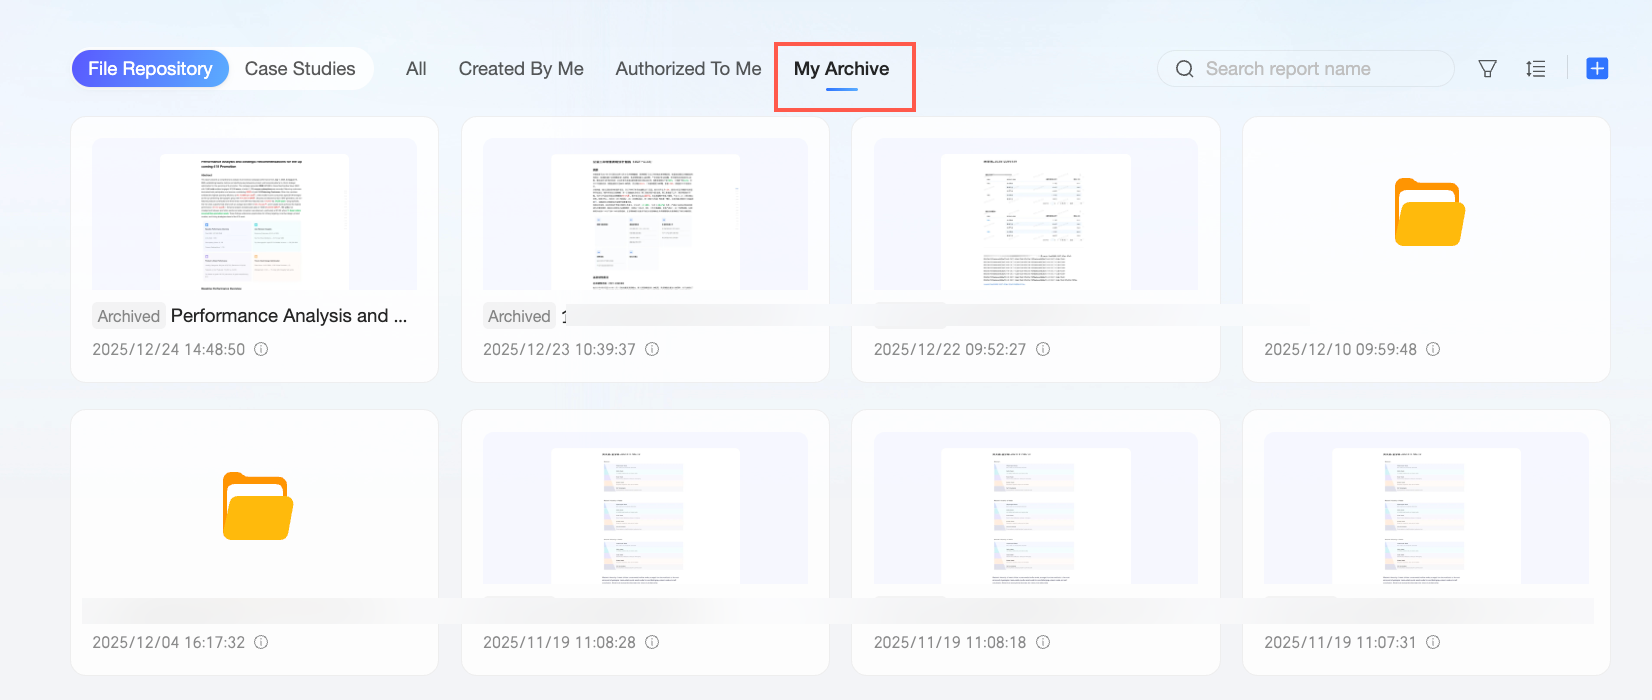
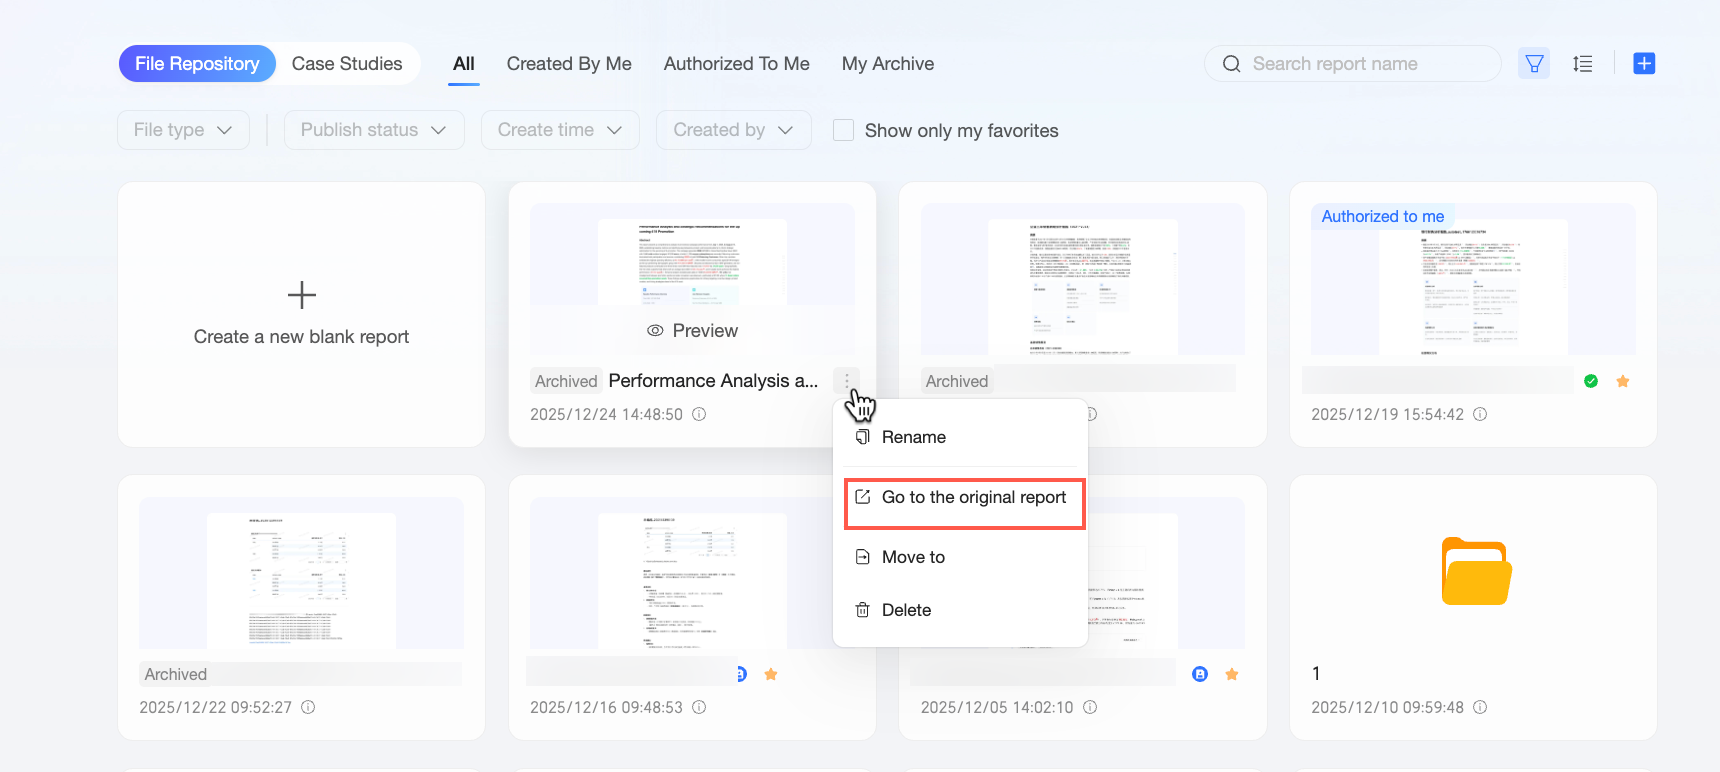
An archived report is stored as an independent copy. Its content is fixed and will not change, even if the original report's data is updated or its content is modified. You can find your archives on the My Archives tab on the report list page.
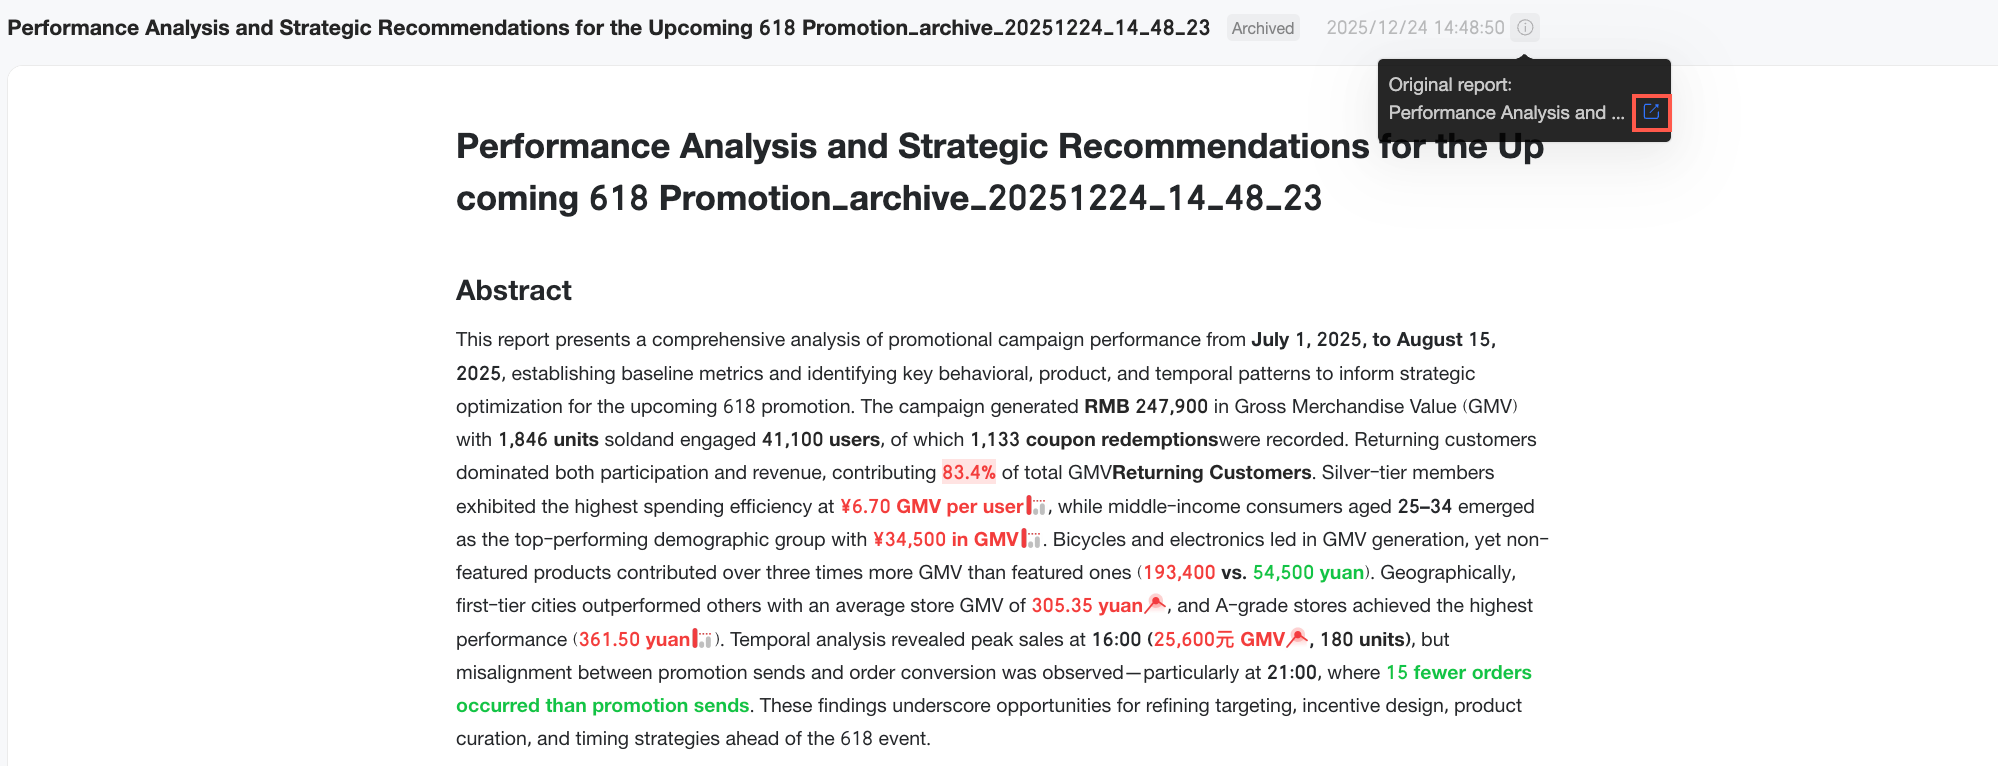
Hover over the archived report, click the icon, and select View Original Report from the options list to go to the preview page of the original Quick BI report.You can also open the original report from the preview page of an archive.
 Hover over the archived report, click the
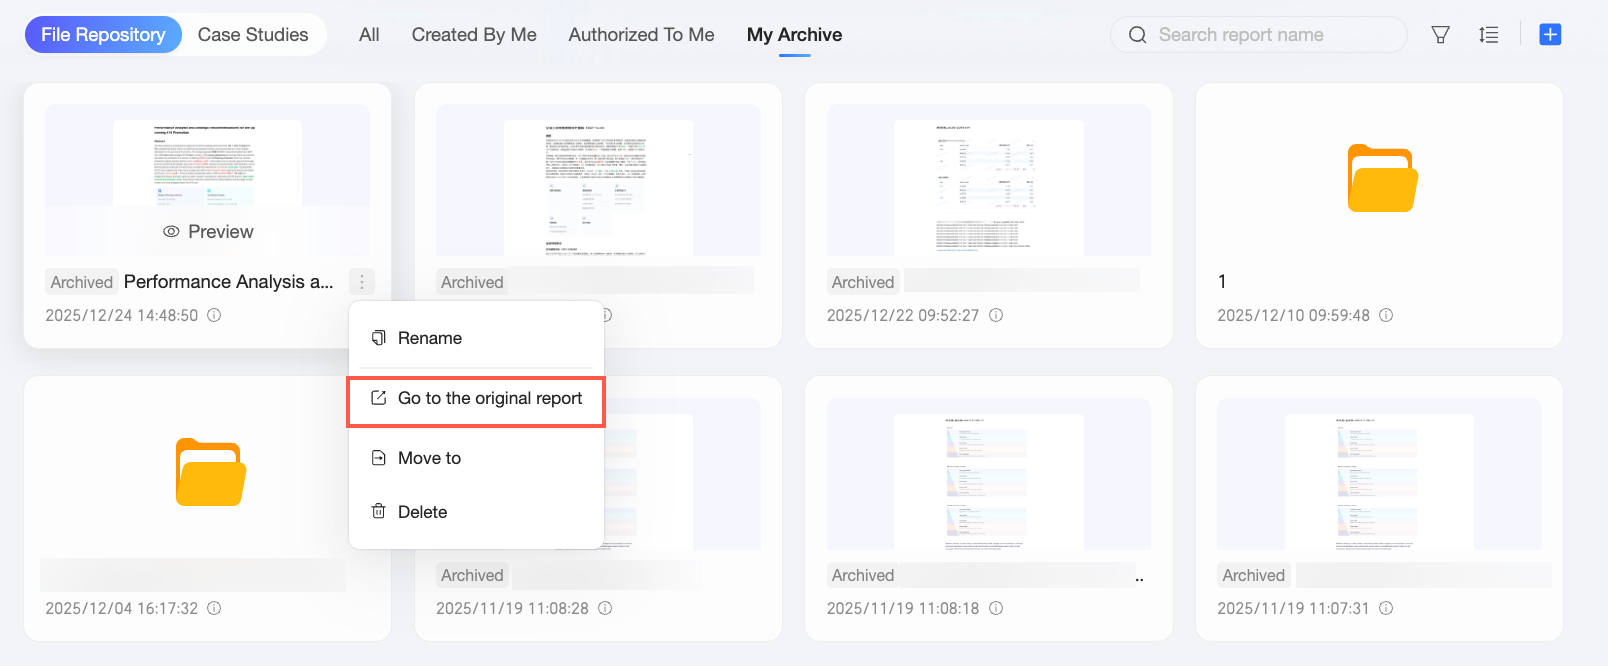
Export
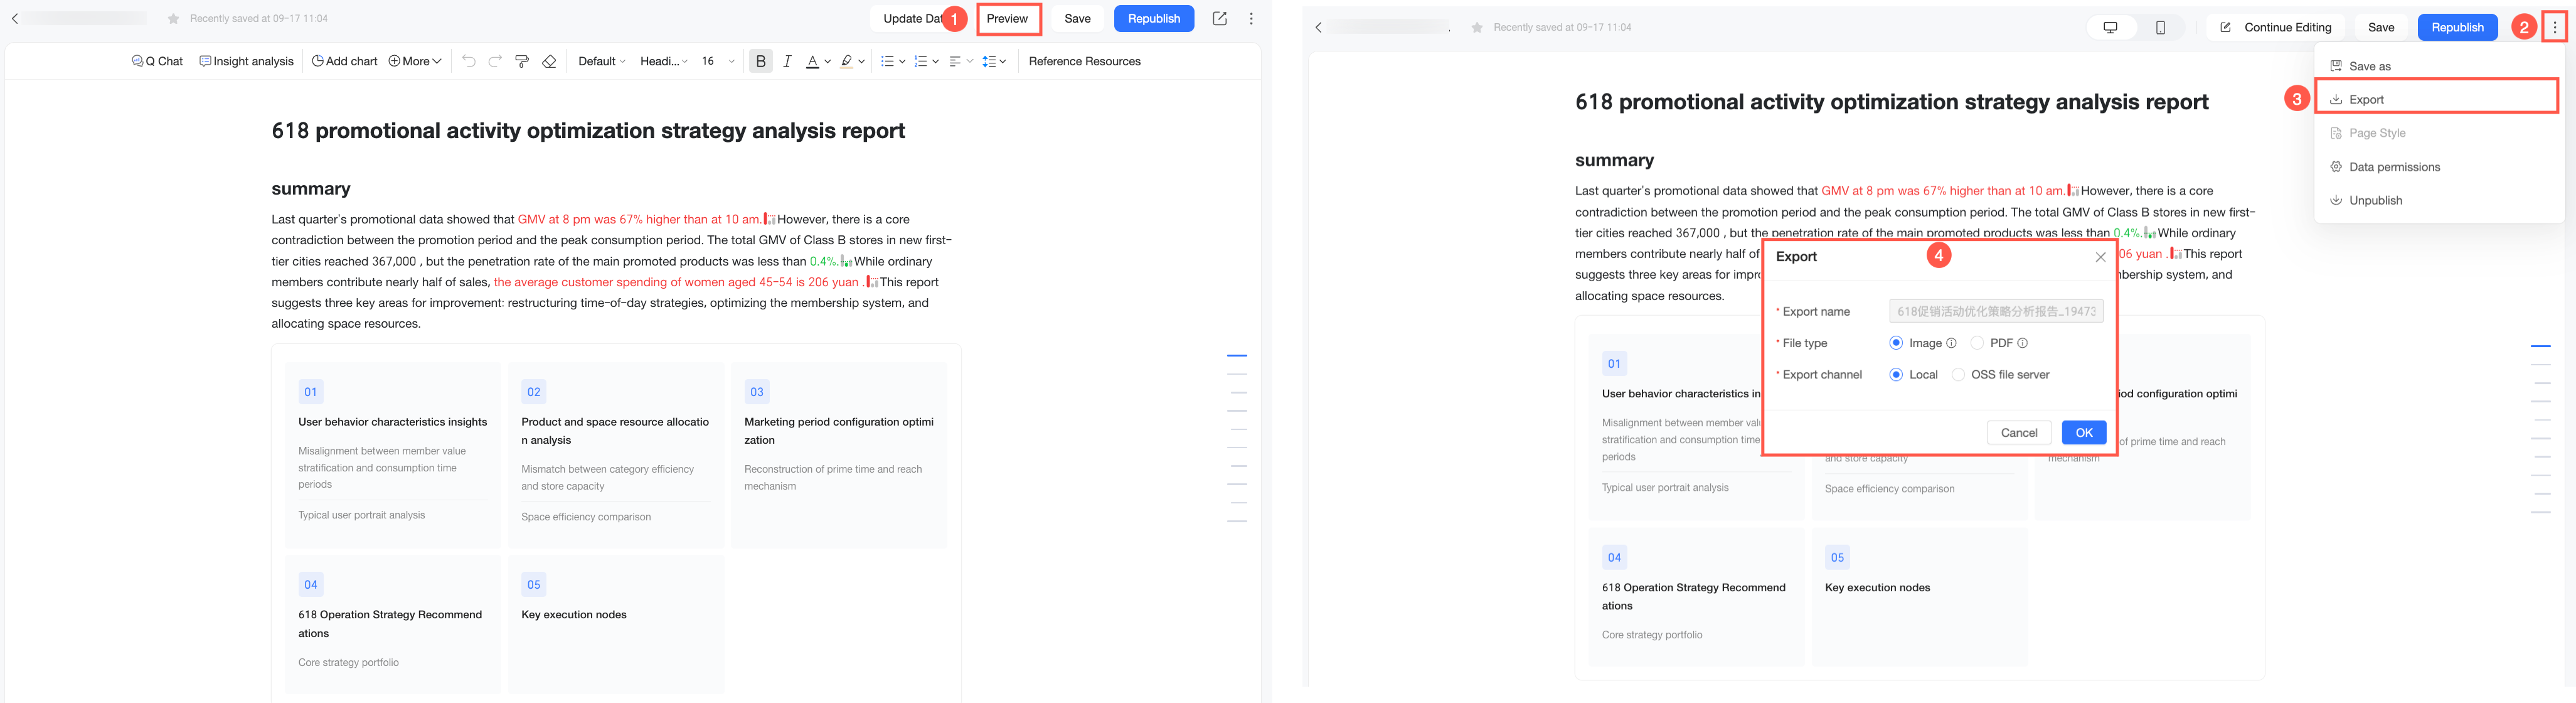
Export a Q Report from preview mode as an image, PDF, or Word file for archiving, presentations, or sharing.
-
To export a report, first open it in preview mode from one of the following locations:
-
Entry point 1: On the report edit page, click Preview in the upper-right corner. On the preview page, click the
icon in the upper-right corner and select export from the drop-down list. -
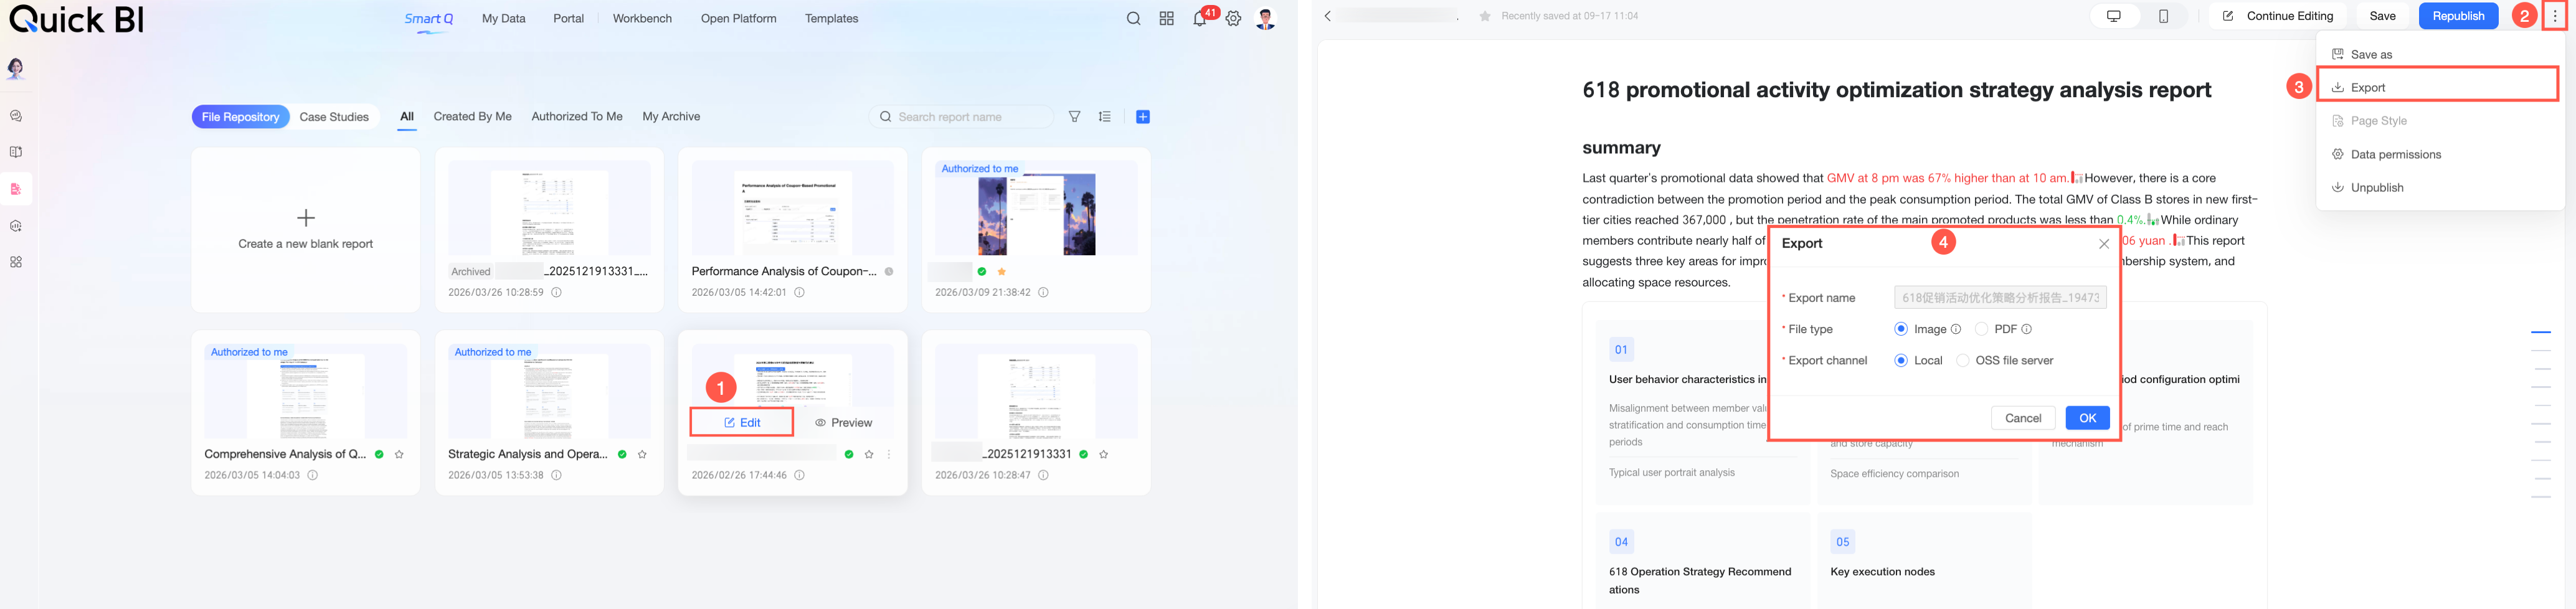
Entry point 2: On the Xiao Q Report page, open the preview page of the report you want to export. Click the export button in the upper-right corner of the preview page.
-
-
In the Export dialog box, configure the settings. The following table describes each parameter.
Note-
Before exporting a report, ensure the following prerequisites are met:
-
Exports must be enabled under data security > export control in the organization management console.
-
You must have permission to export the report, either as its creator or because the creator granted you access. For more information, see collaborative authorization.
-
-
The export behavior depends on how you open the preview page:
-
Entry point 1: When you export from the live preview on the edit page, the action exports the report's current content, including any unsaved changes.
-
Entry point 2: When you export from the preview page, the system exports the most recently published version of the report. For example, any saved but unpublished changes will not be included in the exported file. We recommend that you publish your latest changes before exporting.
-
Parameter
Description
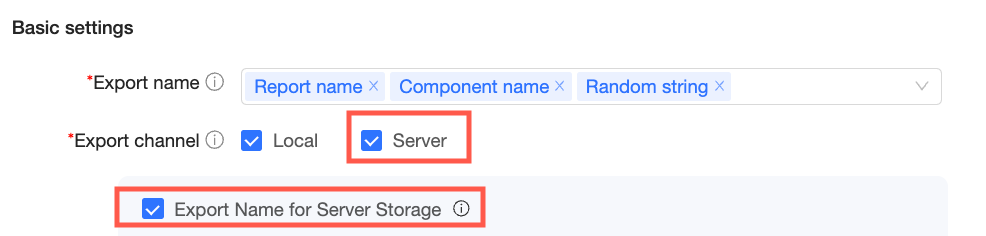
export name
The name of the exported file.
By default, the system generates this name based on the naming rules configured in export control in the organization management console. You can edit this name manually. However, the name cannot be modified if the export channel is set to server-side and the Use exported name for server storage option is selected. To change the file naming rules, contact your organization administrator. For more information, see export control.
file format
The format of the exported file.
Xiao Q Report supports exporting files as Image, PDF, or Word. The available formats depend on the Export Format settings in export control. For example, if only Image and Word are enabled in the settings, you can only select Image or Word here. For more information, see export control.
Note-
When exporting as an Image or PDF, some visual effects, such as text gradients and chart shadows, are not supported and will be replaced with fallback styling.
-
When exporting as a Word document, some styles may be simplified or lost because Microsoft Word does not support certain editor-specific styles, such as multi-column layouts, highlight blocks, and emojis.
export channel
The destination for the exported file.
You can export a Xiao Q Report to your local device or to OSS. The available channels depend on the export channel settings in export control. For example, if only the server-side option is enabled, you can only export the report to OSS. For more information, see export control.
-
-
Click OK to export the report.
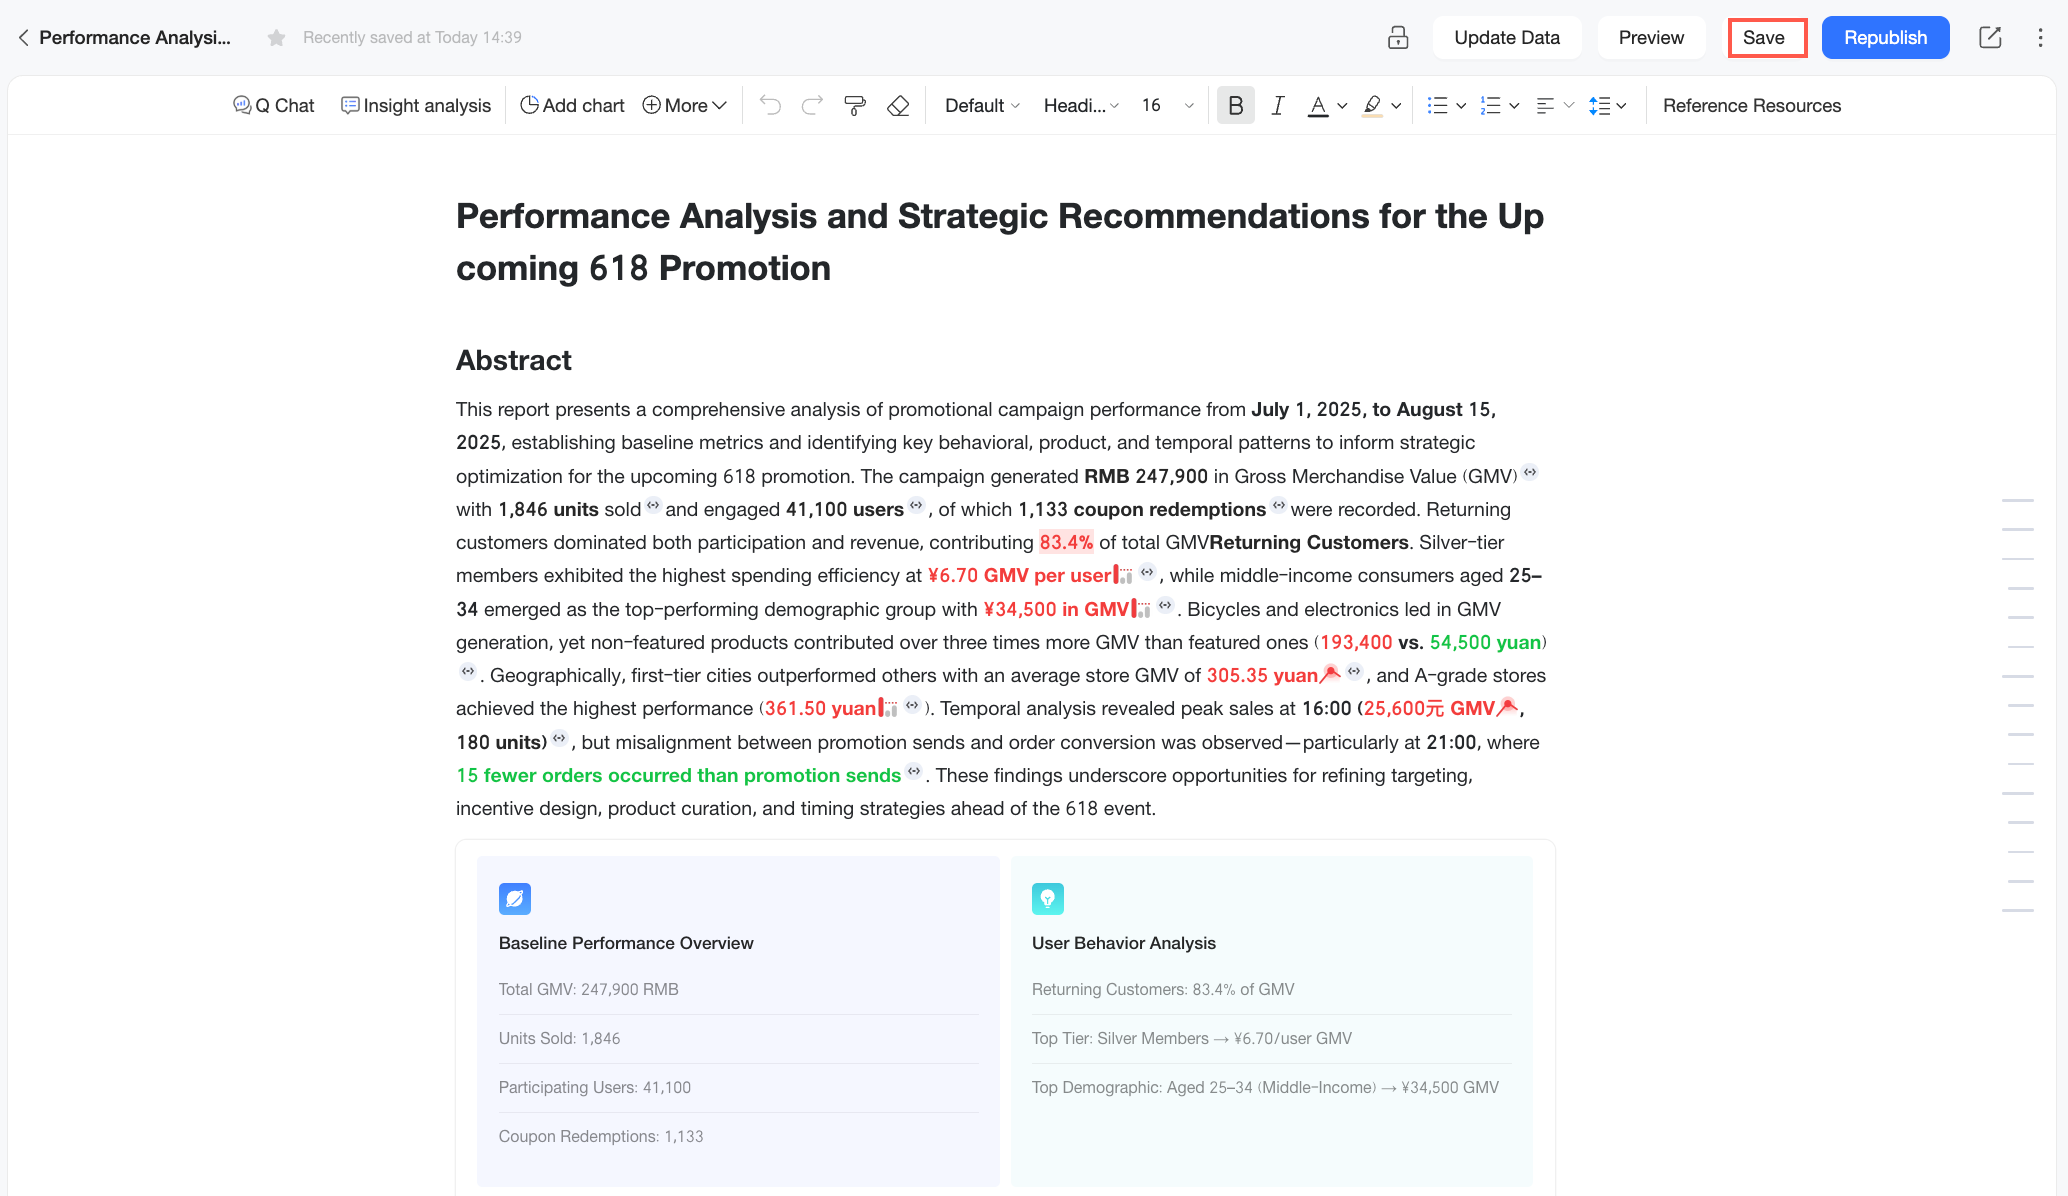
Save
On the Quick Q report edit page, click save on the navigation bar.
-
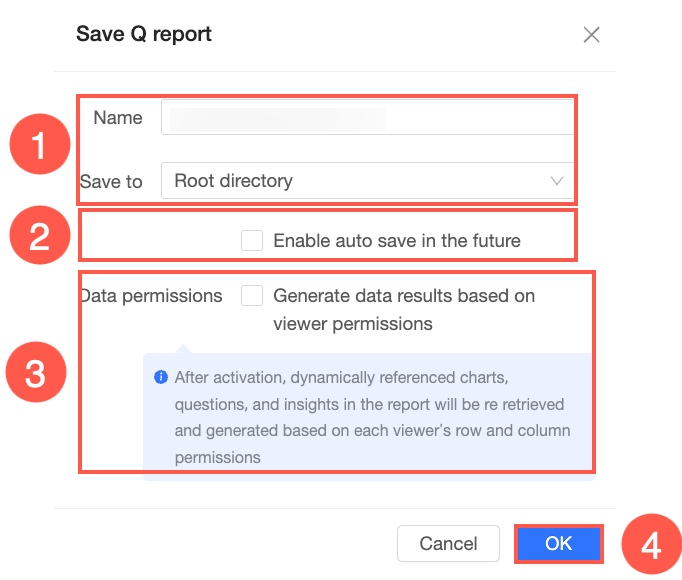
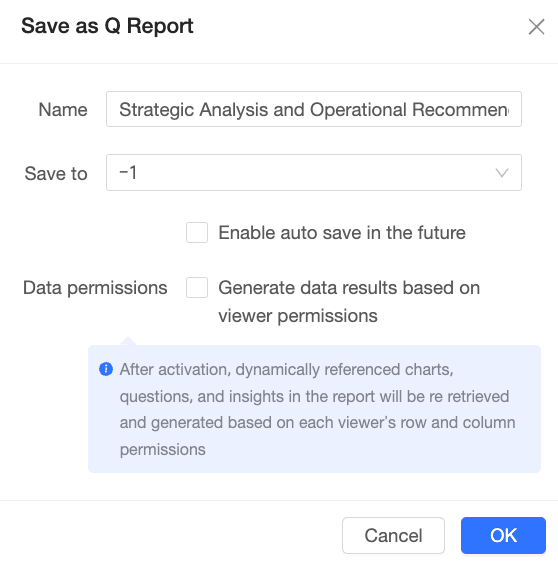
The first time you save a report, you can set its name, select a location, enable or disable auto-save, and configure data permissions. Click OK to finish.
-
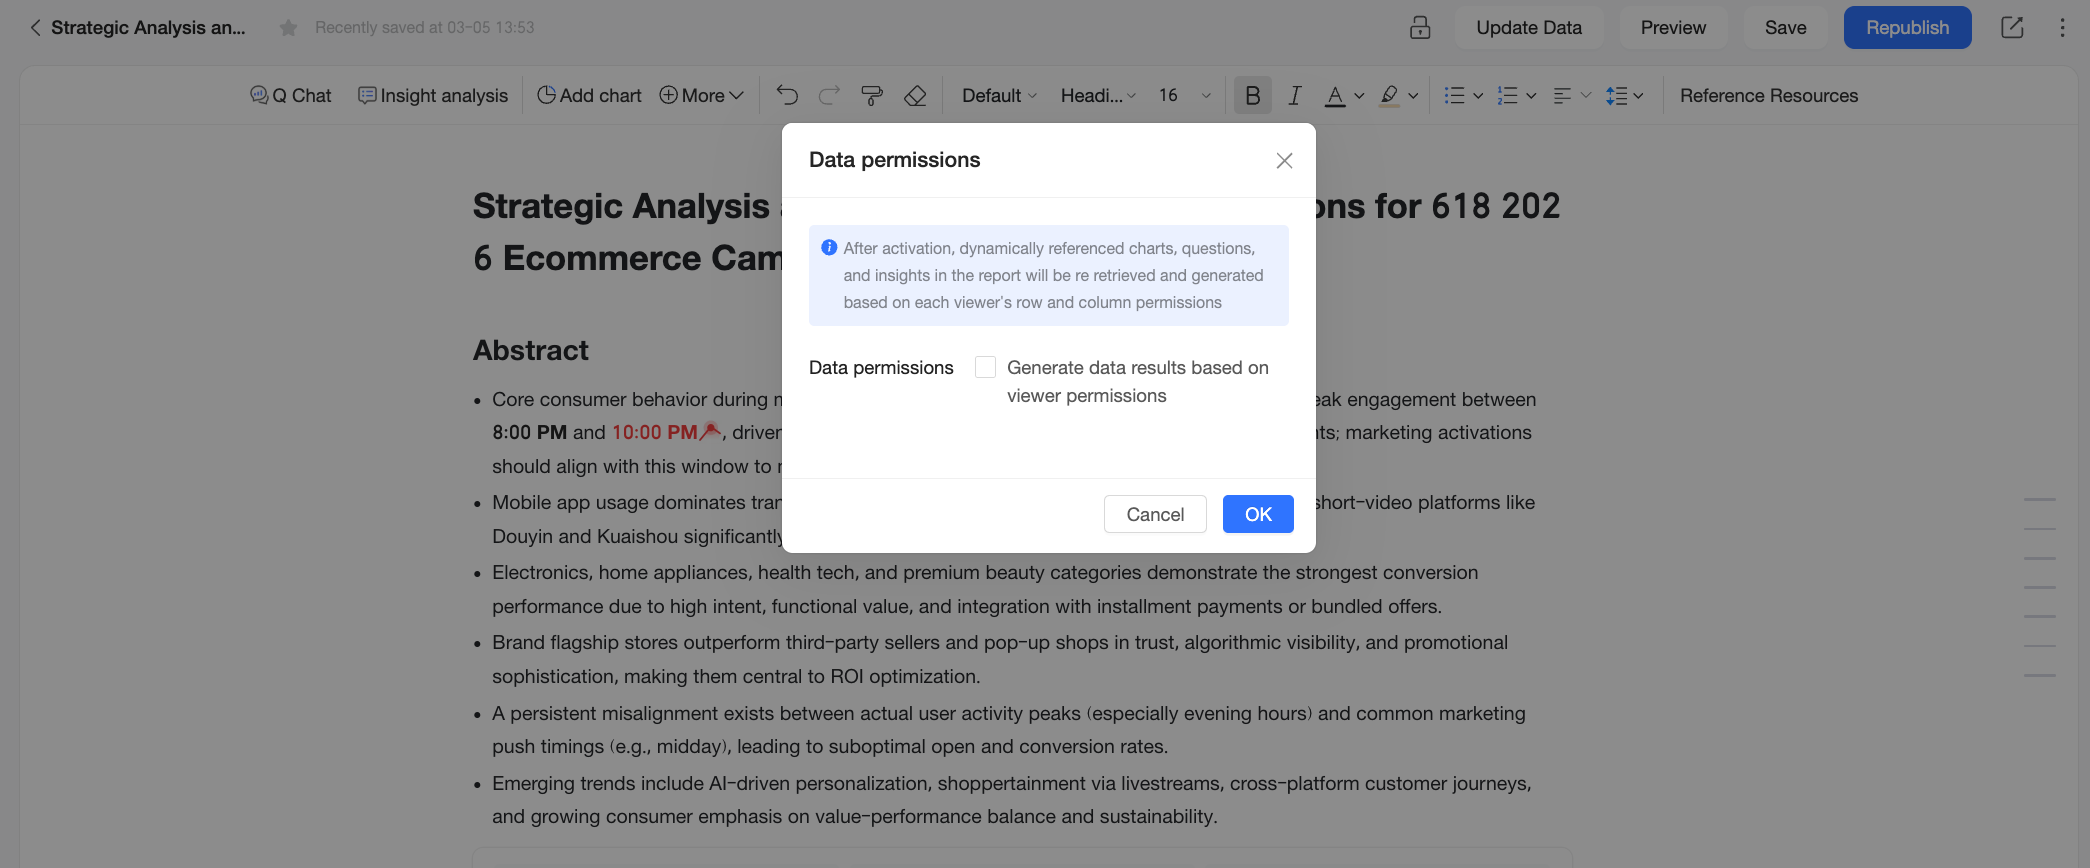
When Data permissions is enabled, the system regenerates charts, Q&A results, and insights in the report that use dynamic references based on each viewer's row and column-level permissions. For more information, see data permissions.
Save and Publish
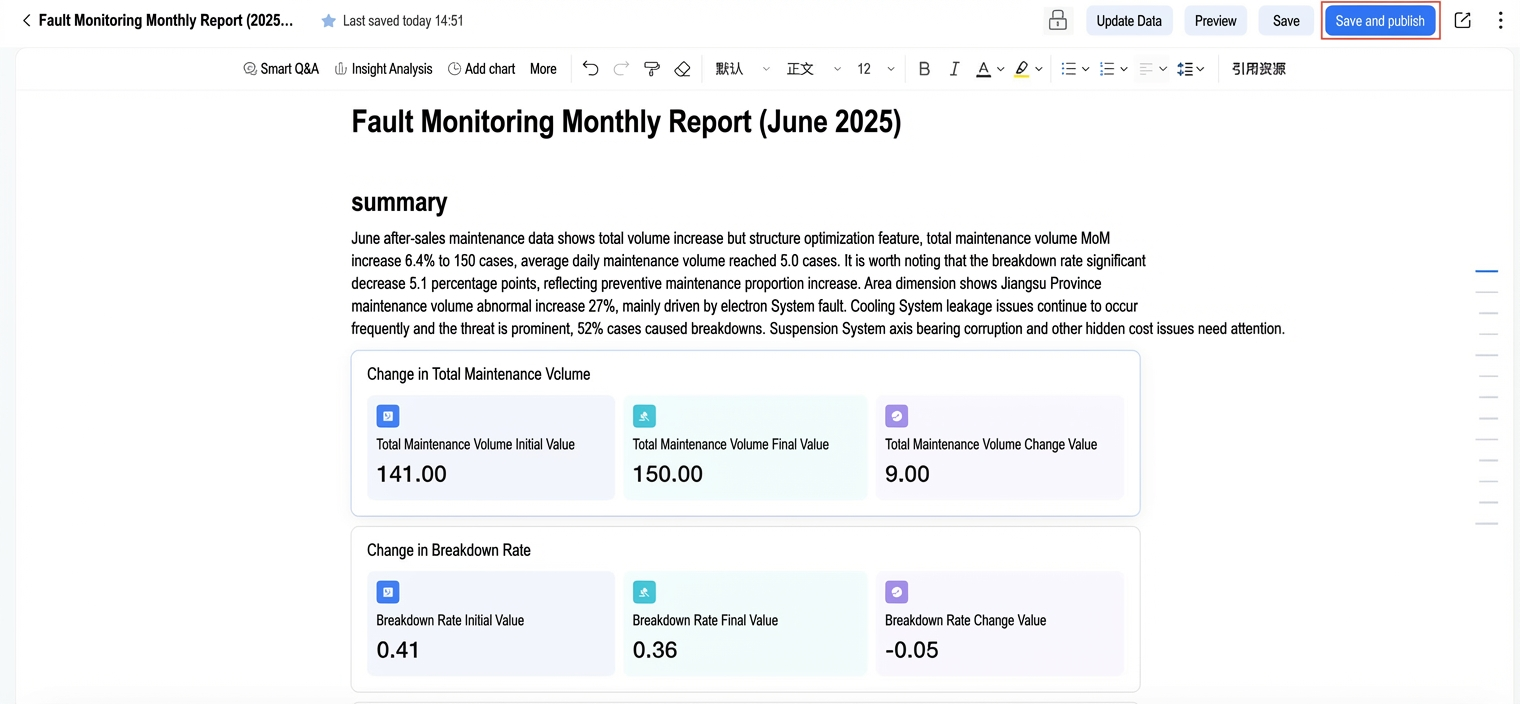
On the Xiao Q report editing page, click save and publish in the navigation bar. Once published, users with view permission can preview the report.
Republish
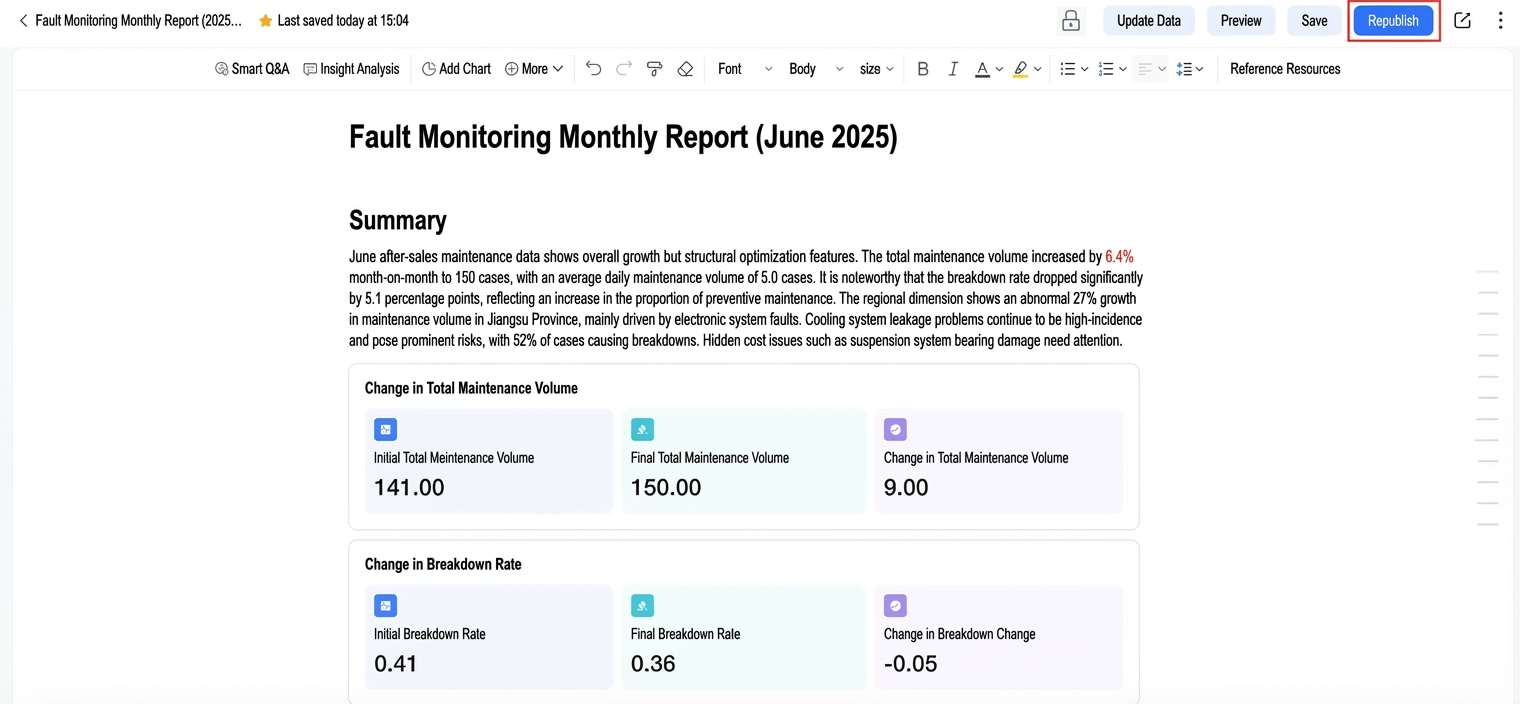
On the Xiao Q report editing page, click the Republish button in the navigation bar to make the latest content available to viewers.
Share
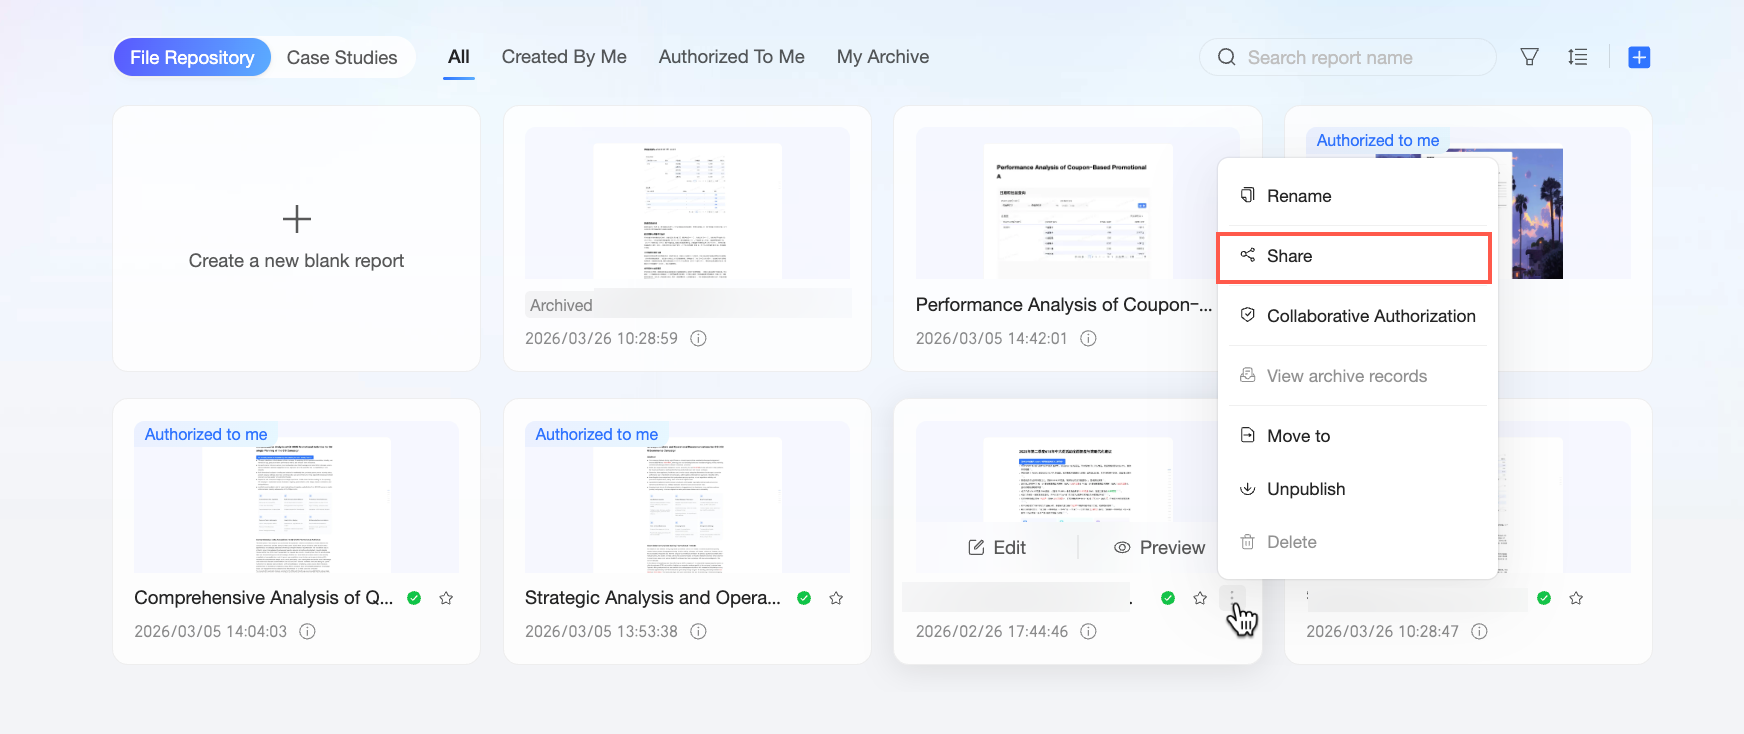
On the Xiao Q Report editing page, click Share in the navigation bar to share the report.
Alternatively, on the Xiao Q Report list page, click the ![]() icon for the target report and select Share.
icon for the target report and select Share.
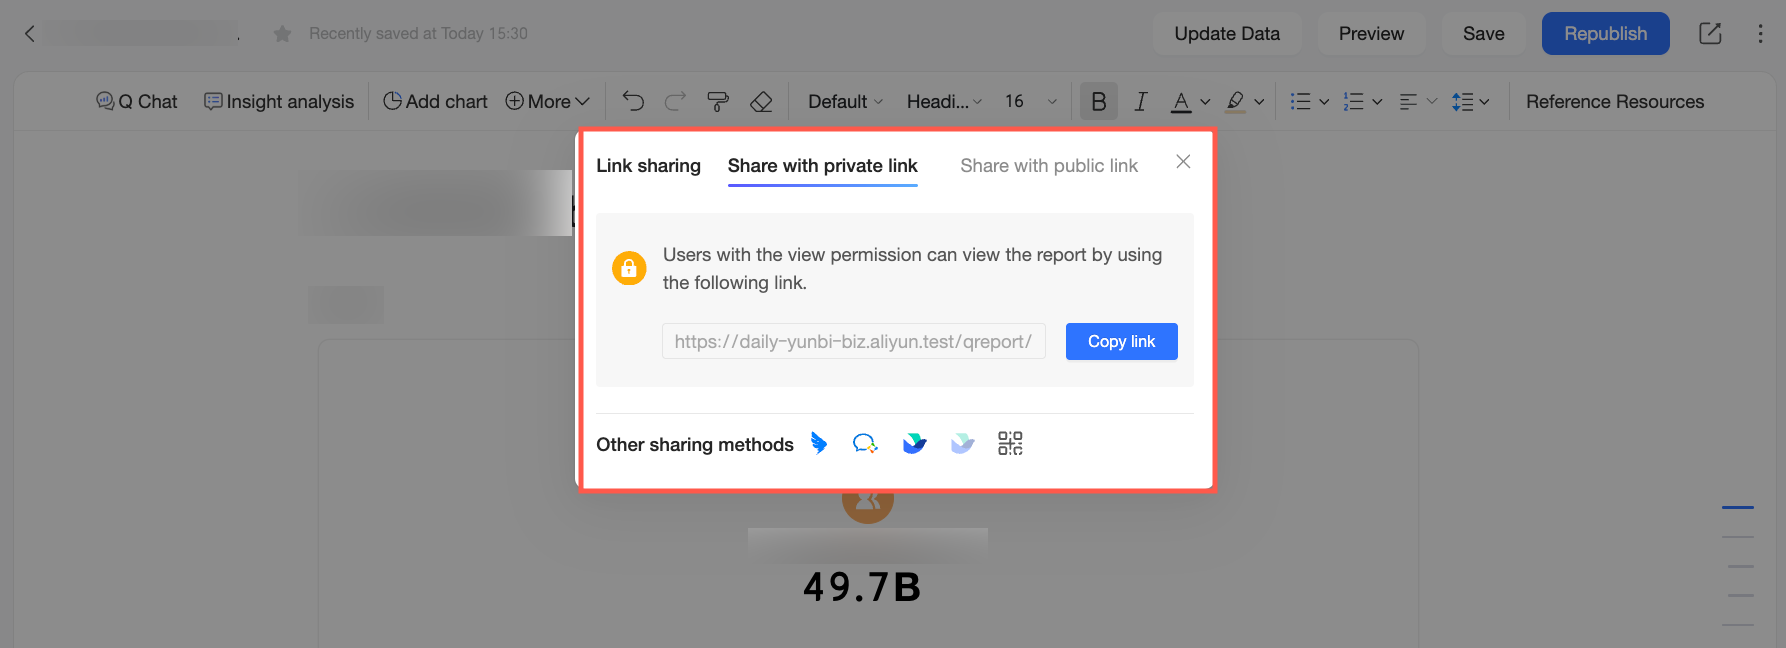
You can share reports using a private link or a public link.
-
Private link: Click Copy Link to copy a link that you can send to users with viewing permissions. You can also use Other Sharing Options to share the report with users of applications integrated with DingTalk, Feishu, and WeCom.
-
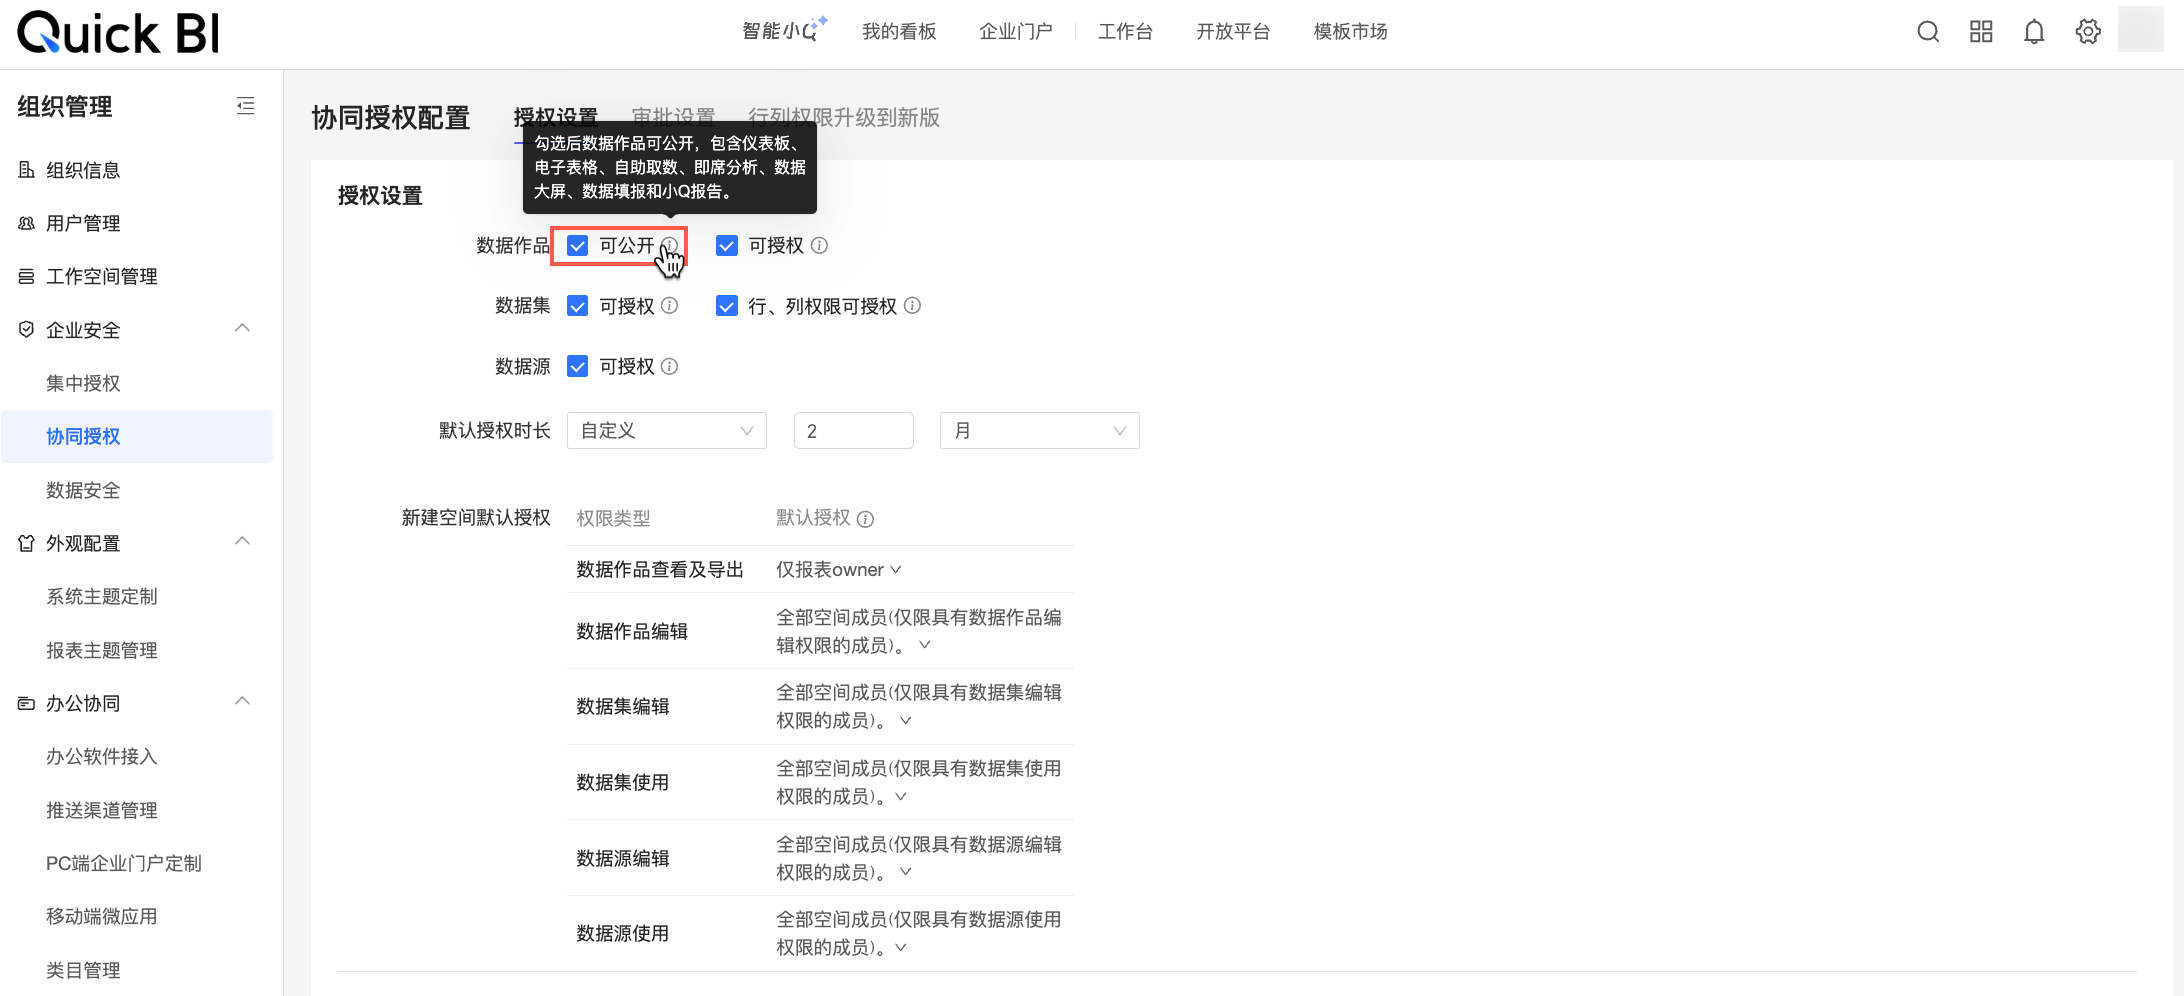
Public link: Click Share Publicly, then click Copy Link. Anyone with the public link can view the report.
NoteTo obtain a public link in the Link Sharing dialog box, you must enable the Publicly Sharable option for data works in organization management.
You can combine different sharing methods with data permissions settings. For more information, see data permissions.
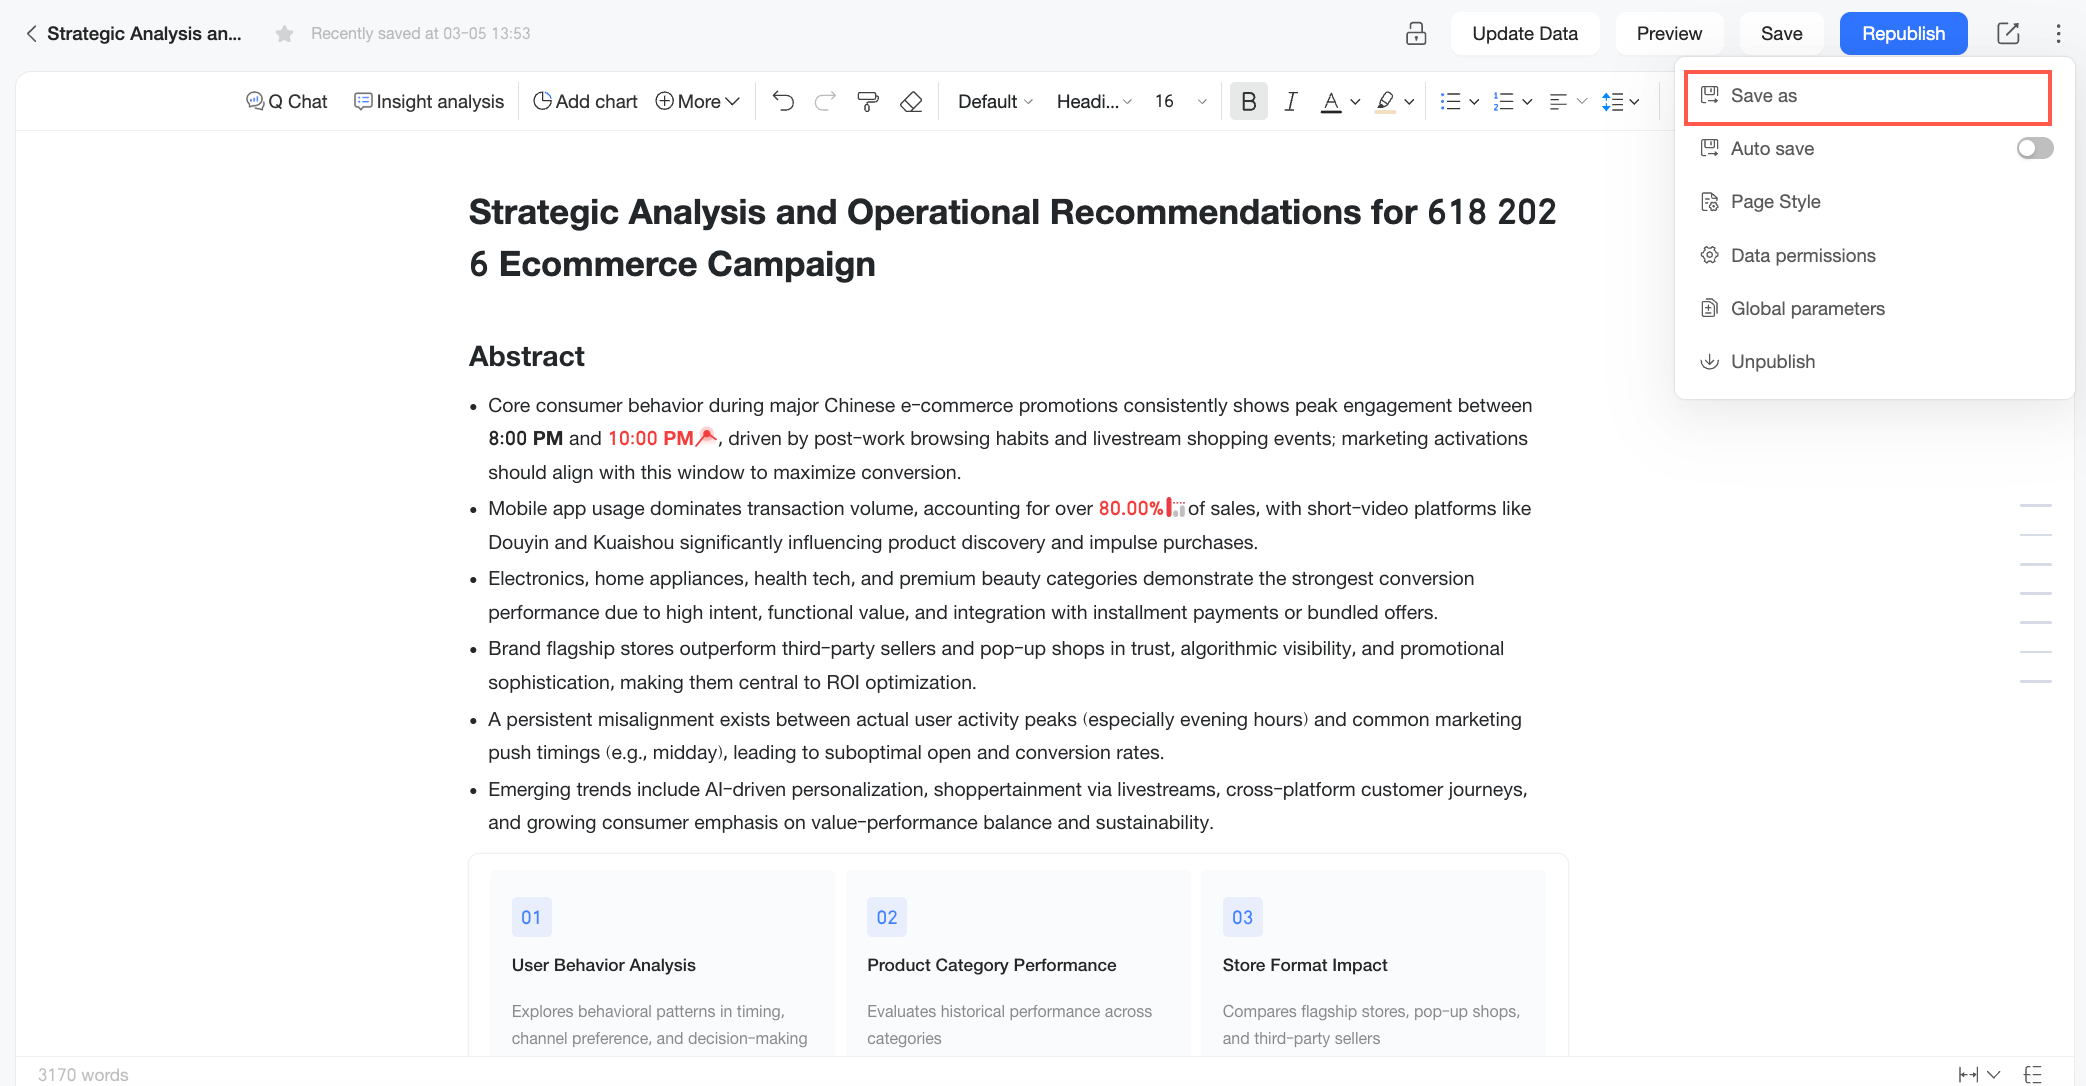
Save as
On the Quick BI report editing page, click the ![]() icon and select Save As to save a copy of the current report.
icon and select Save As to save a copy of the current report.
-
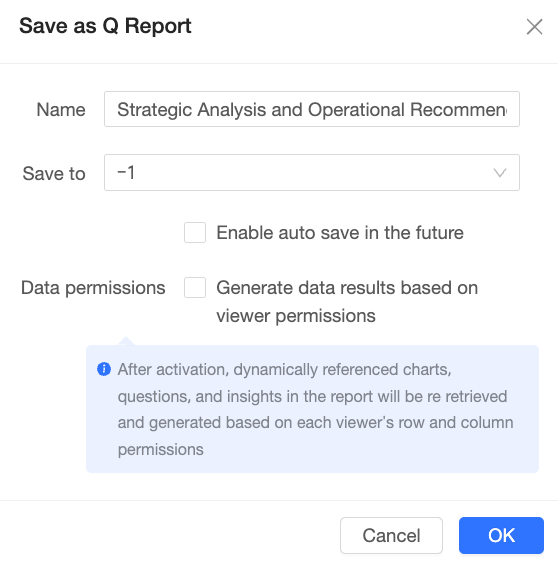
In the Save As dialog box, you can: ① customize the report Name and select a Location; ② configure Auto Save; ③ configure Data Permissions; and ④ click OK to save the report.
-
When Data Permissions is enabled, charts, Q&A results, and insights in the report that use a dynamic reference are regenerated based on each viewer's row- and column-level permissions. For more details, see Data Permissions.
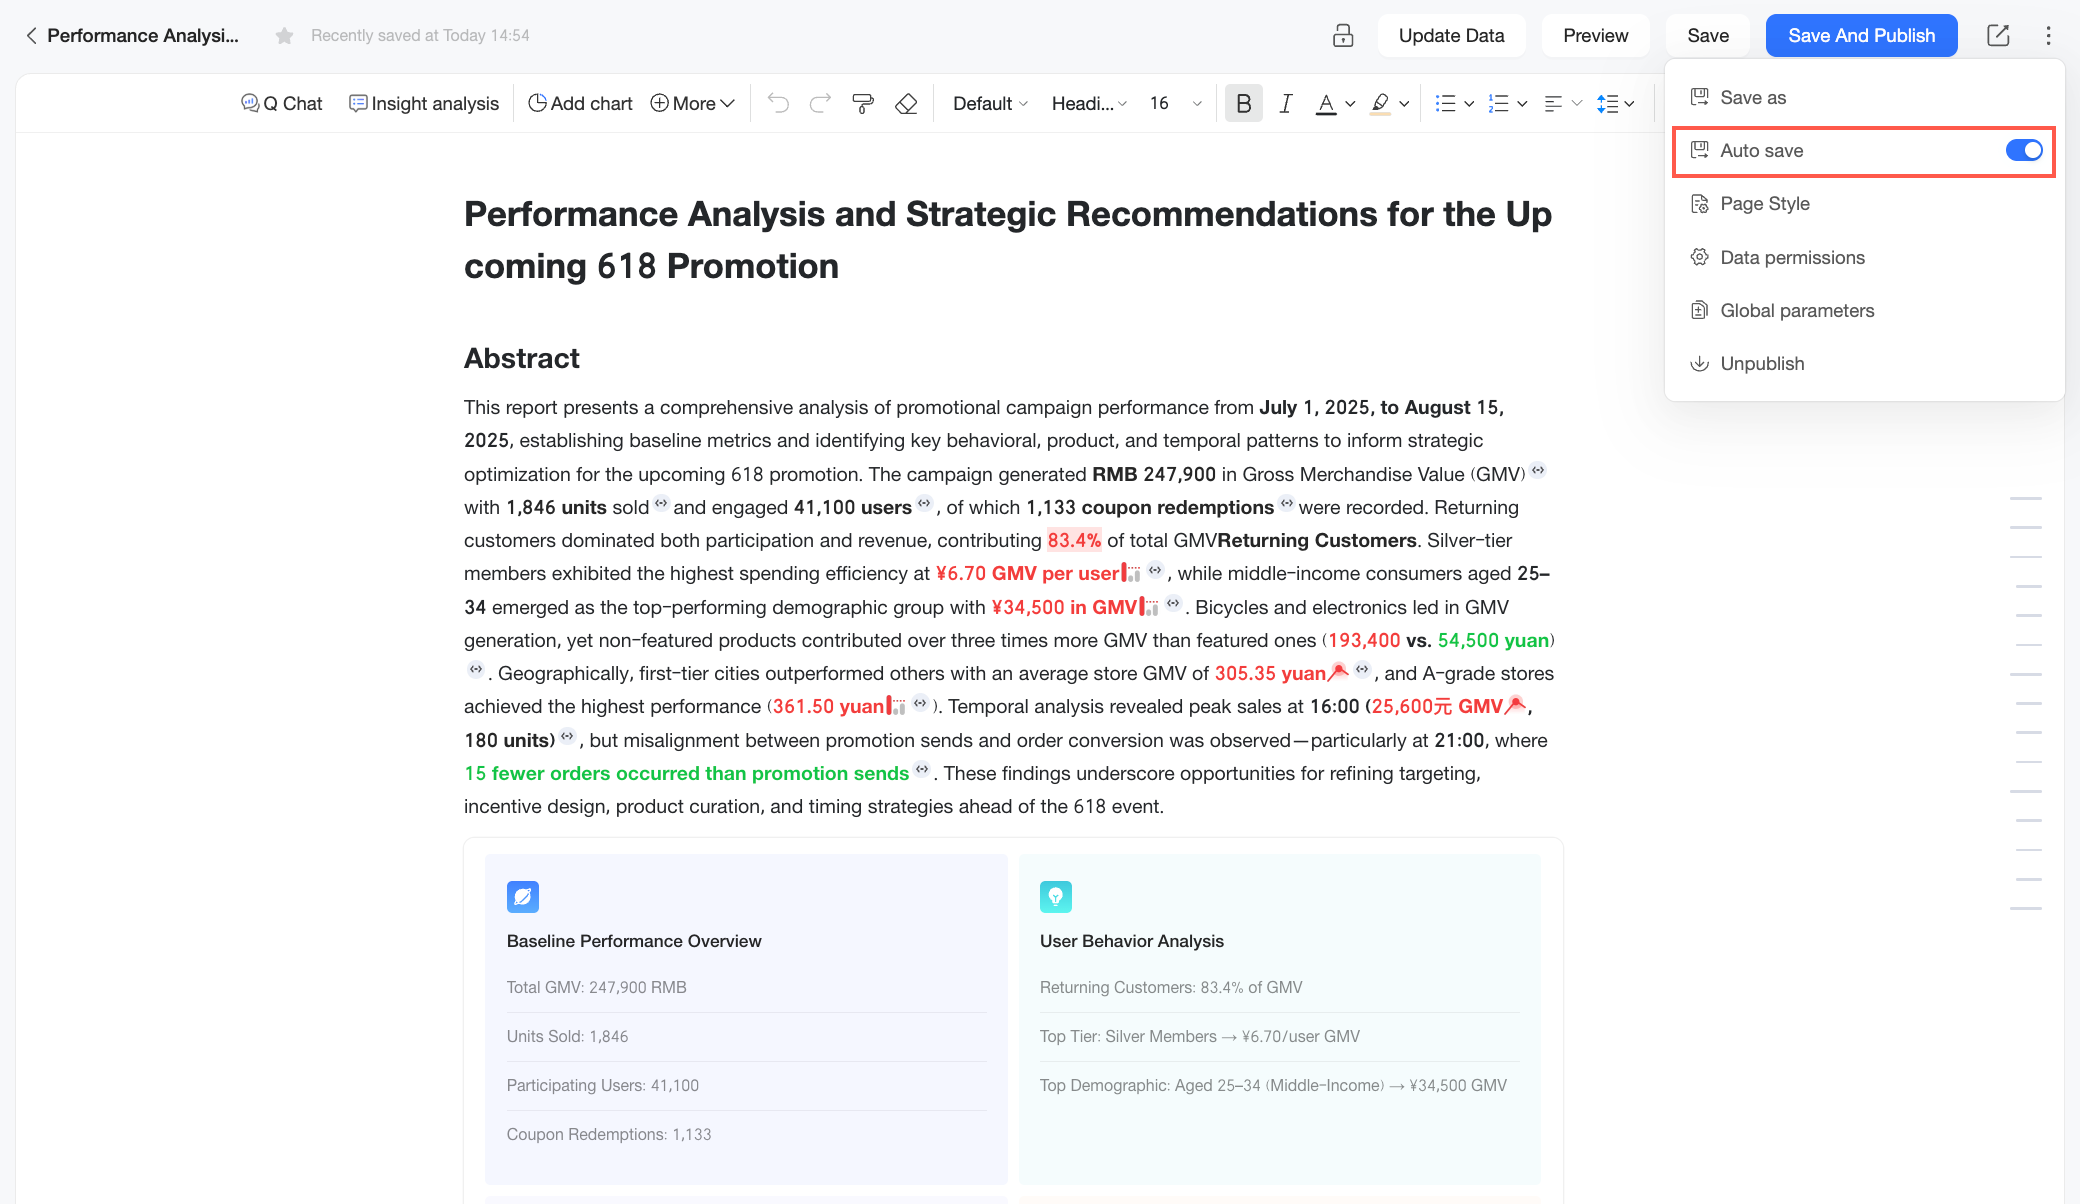
Autosave
Enable autosave to prevent losing unsaved changes due to accidental browser closures or network interruptions. Every 5 minutes, the system compares the current content with the last saved version and triggers an autosave if changes are detected. When you reopen the report, you can restore the last autosaved version.
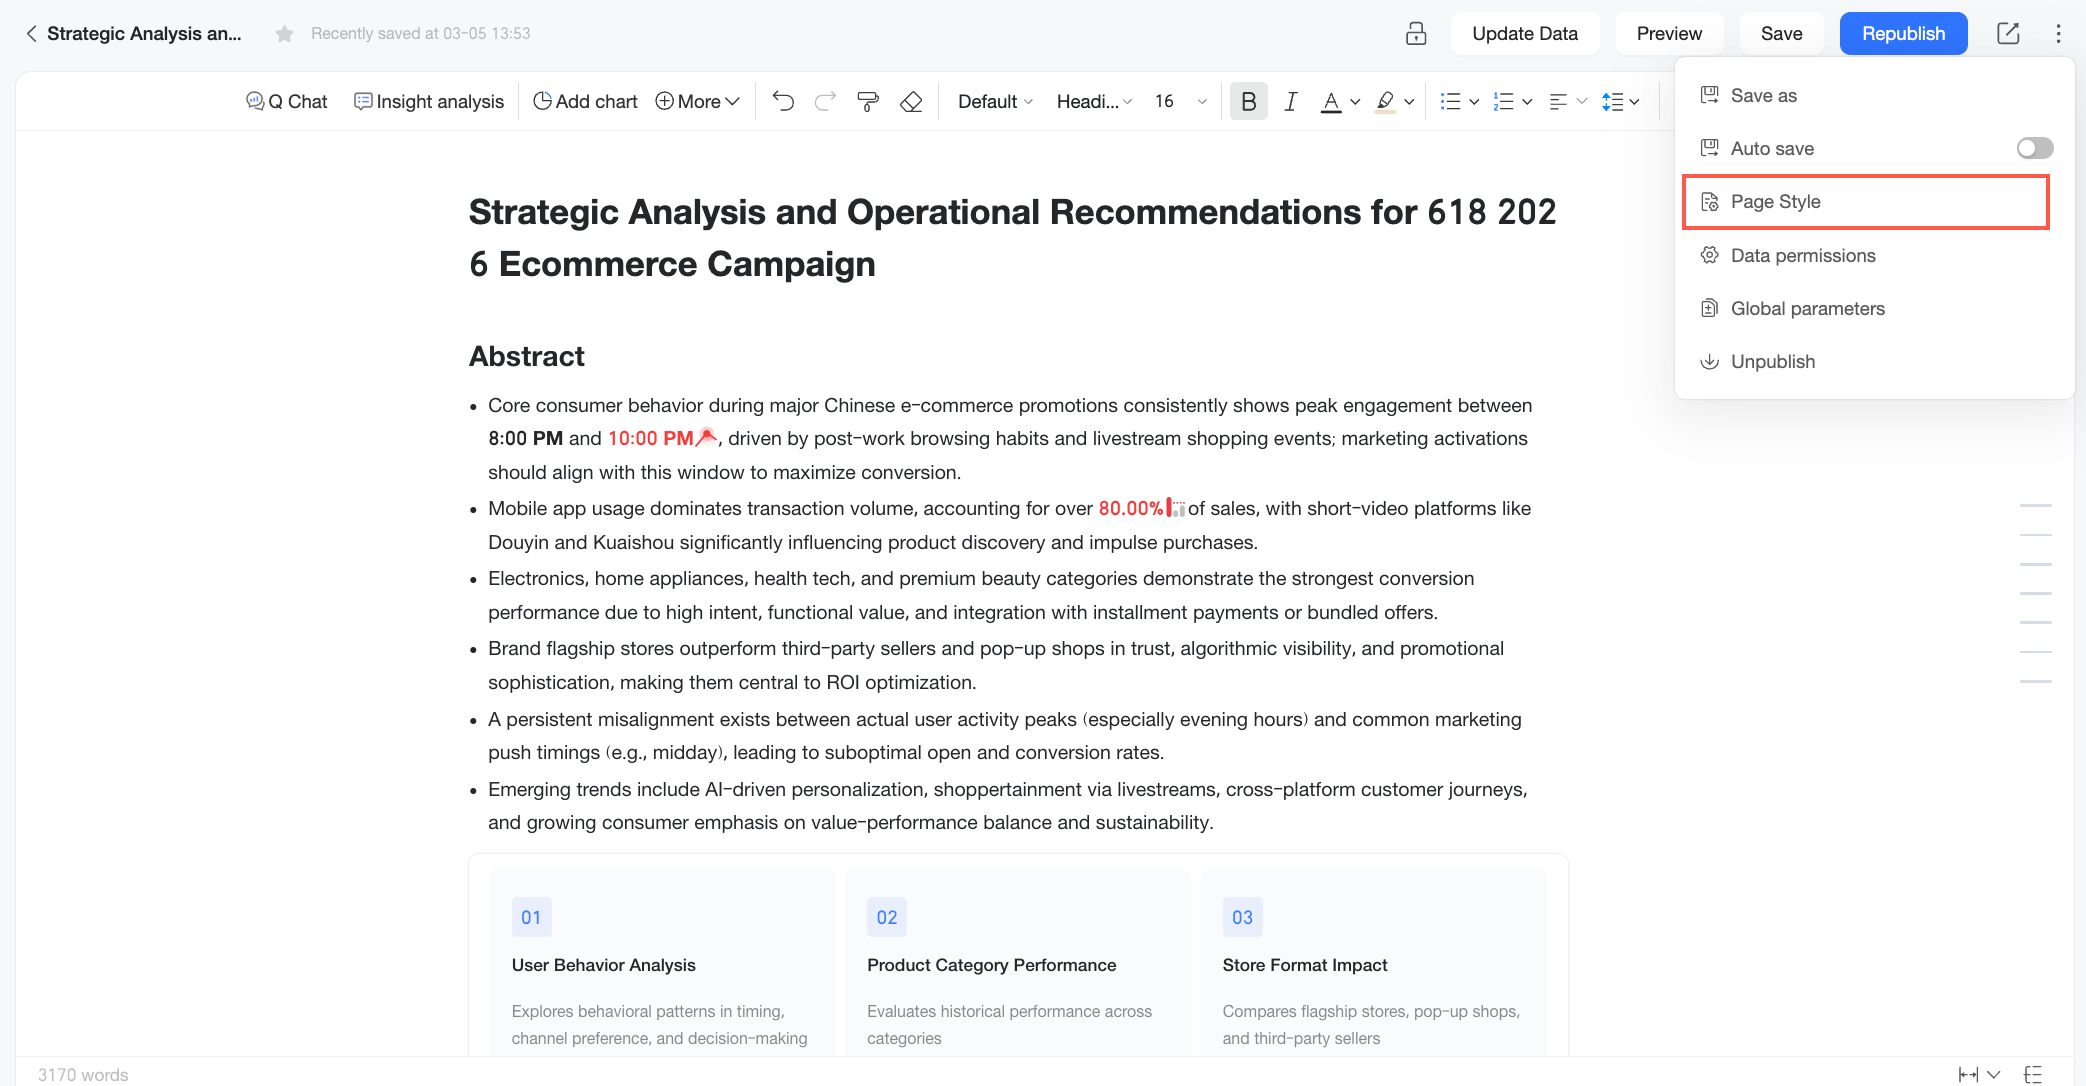
Page Style
On the Xiao Q Report edit page, click the ![]() icon and select Page Style to open the style configuration page. For details, see Style Configuration.
icon and select Page Style to open the style configuration page. For details, see Style Configuration.
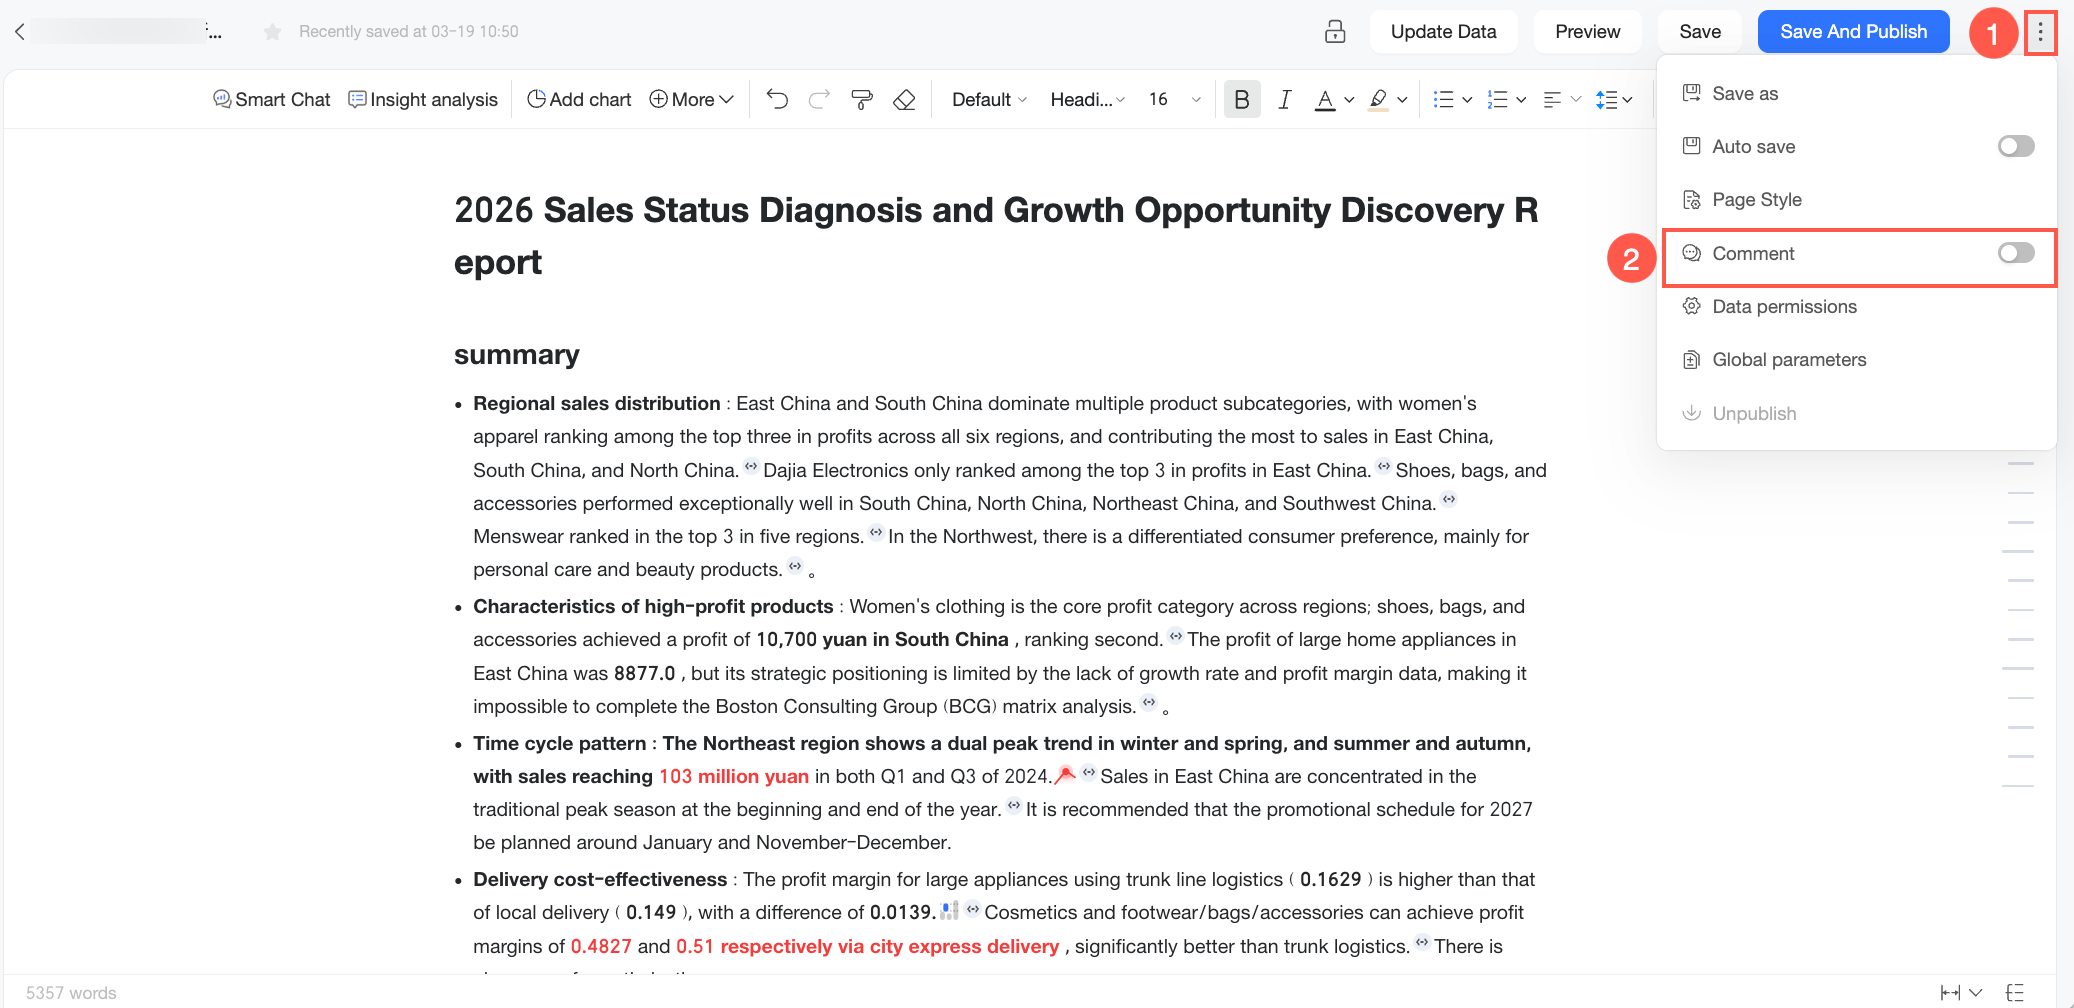
Comment
The comment feature lets you leave comments directly on specific text paragraphs or charts and @mention relevant users. Multiple users can discuss report content in context while maintaining a traceable record of all conversations.
Go to the intelligent Q&A report edit page, click the ![]() icon, and turn on the Comment switch (
icon, and turn on the Comment switch ( ) in the drop-down list to enable comments for the current report.
After the comment feature is enabled, users with view permissions can add comments on the report's preview page. Follow these steps.
-
Add a comment: Quick BI lets you add comments to text and chart content in a report. The method for adding a comment varies depending on the content type.
Content type
Method
Text
Hover over the line of text you want to comment on. An icon
appears to the right of the paragraph. Click it to add a comment on that paragraph.To comment on specific text, highlight it. A floating menu appears near the selection. Click the
icon to add a comment.Chart
Hover over the chart you want to comment on. An icon
appears to the right of the chart. Click it to add a comment.Alternatively, click the
icon in the upper-right corner of the chart and select Comment from the drop-down menu.Text and chart
Highlight the target text and chart. A floating menu appears near your selection. Click the
icon to add a comment. -
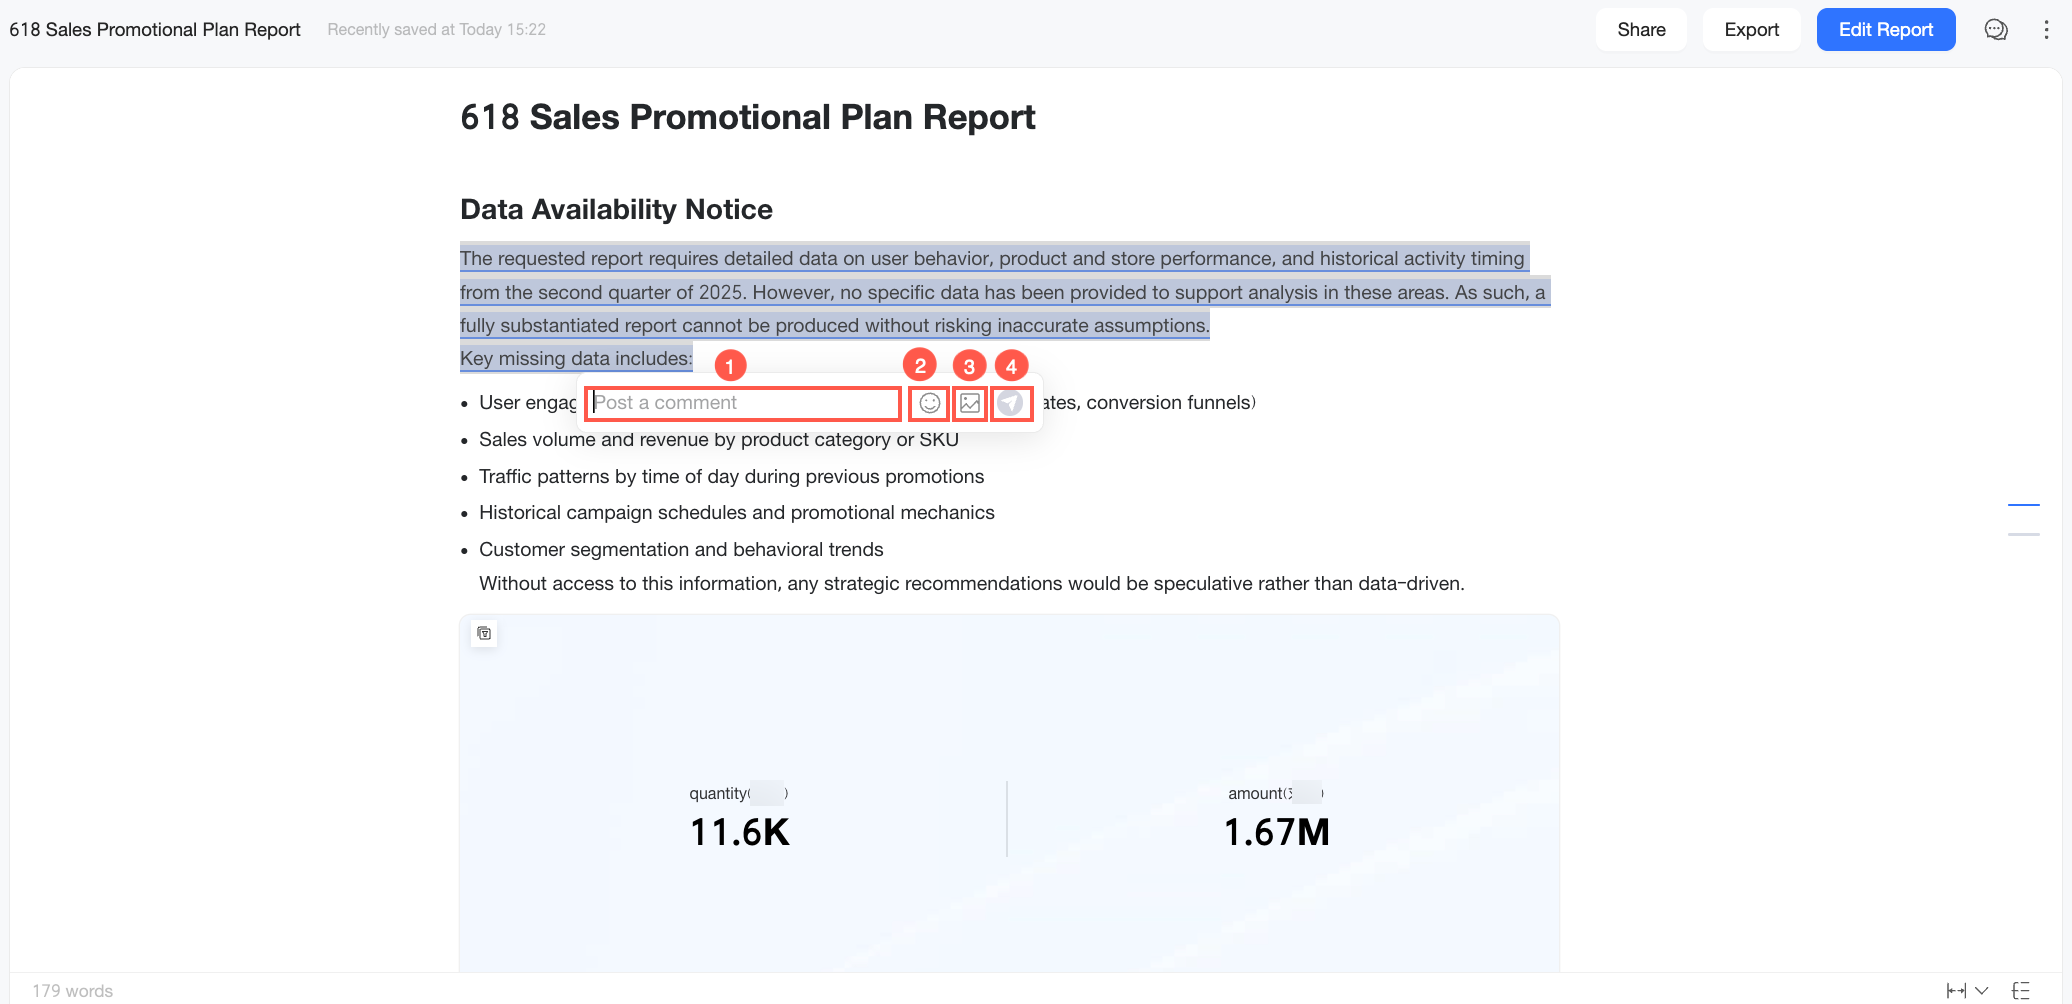
Edit the comment: In the floating editor, enter your comment. You can perform the following actions.
Action
Description
Area ①
Enter comment text
Add notes, questions, or discussion points about the selected report content.
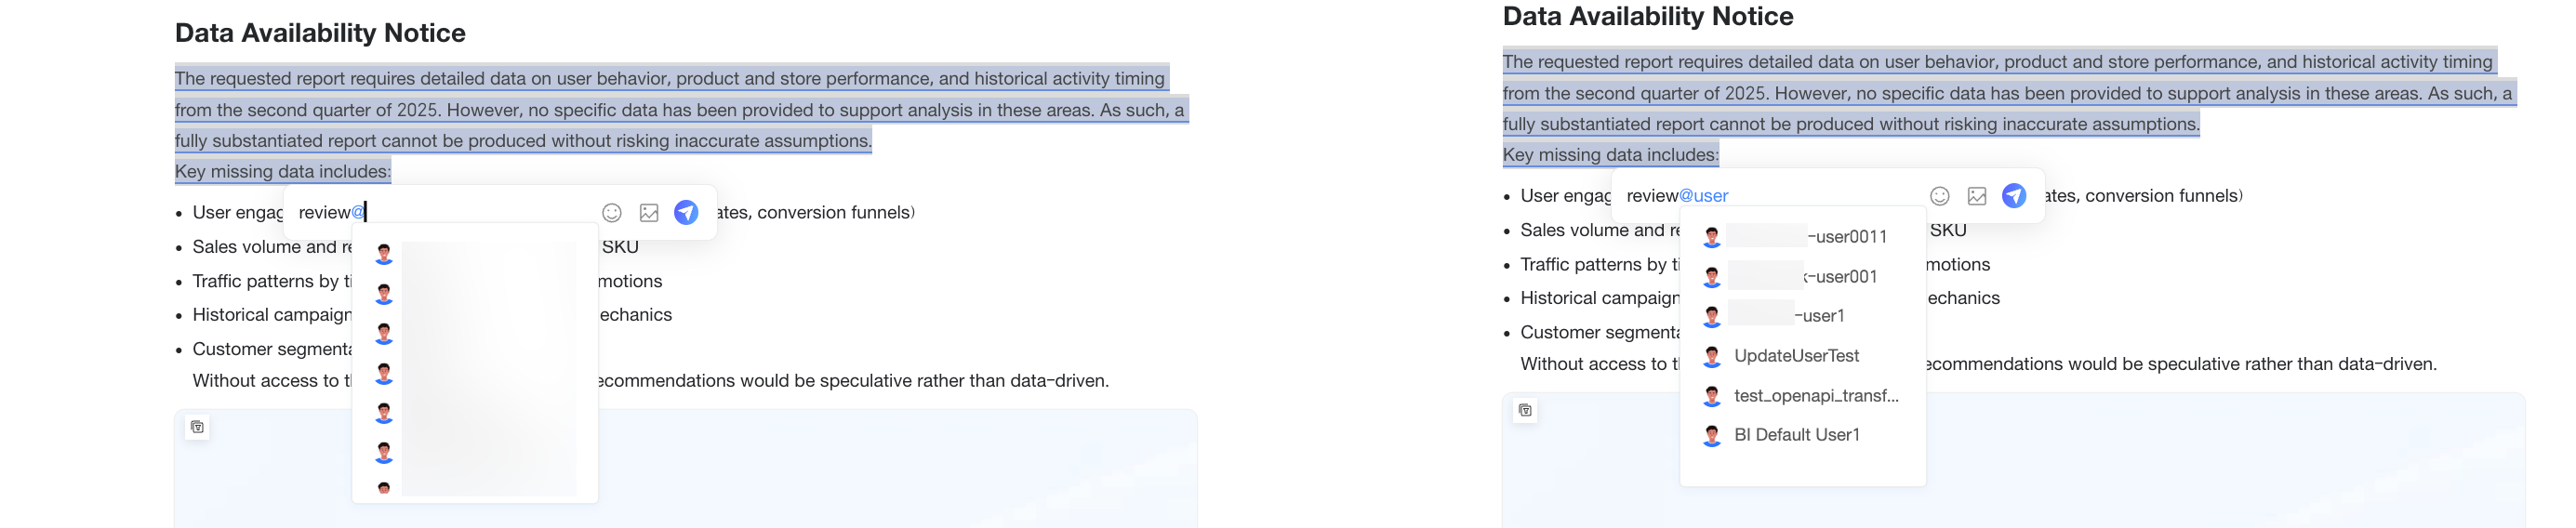
@mention a user
In the editor, type "@" to display a list of users in your organization (up to 50 users are displayed). You can select a user from the list or type a name to quickly filter for a specific user.
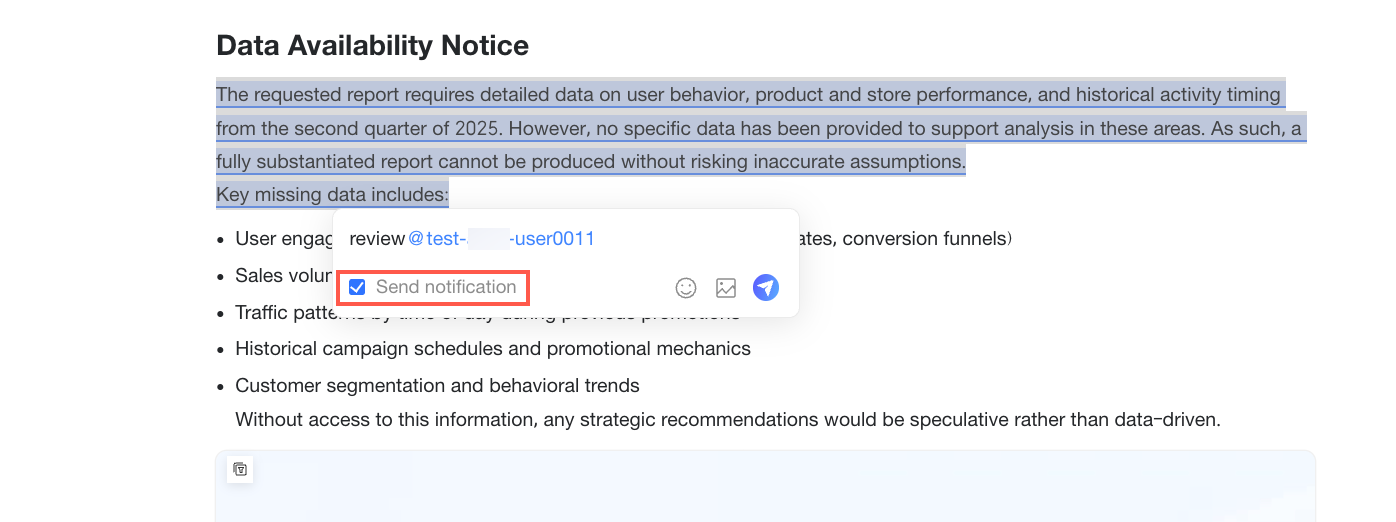
When you @mention someone, the Send notification checkbox is selected by default. After you post the comment, the system notifies the mentioned users through your organization's integrated third-party channels (such as DingTalk or Lark) or custom channels so they can join the discussion.
NoteTo learn how to configure third-party and custom channels, see office collaboration.
Area ②
Add emoji
Insert emoji in a comment to help express tone and clarify context.
Area ③
Upload image
Upload a local image (up to 1 MB) to a comment to provide supplementary information, such as business context or data logic.
Area ④
Send comment
After you enter content in the comment box, the send button (
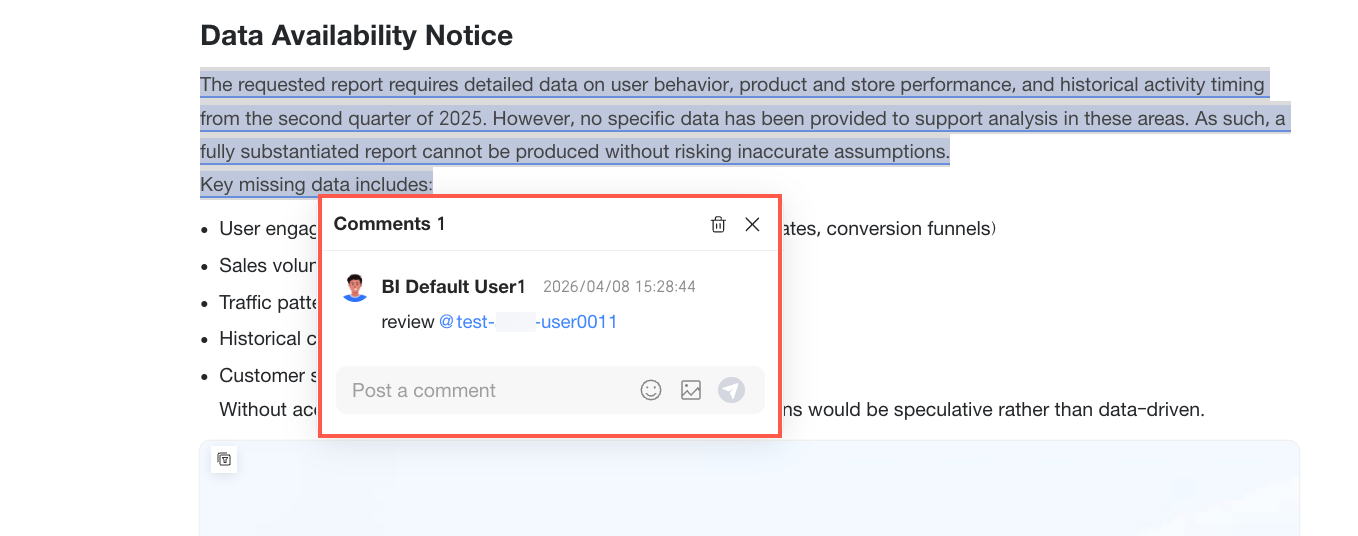
) becomes active. Click it to post your comment.After the comment is sent, the commented content is highlighted and underlined. A floating window appears near the content, showing the details of the posted comment.
-
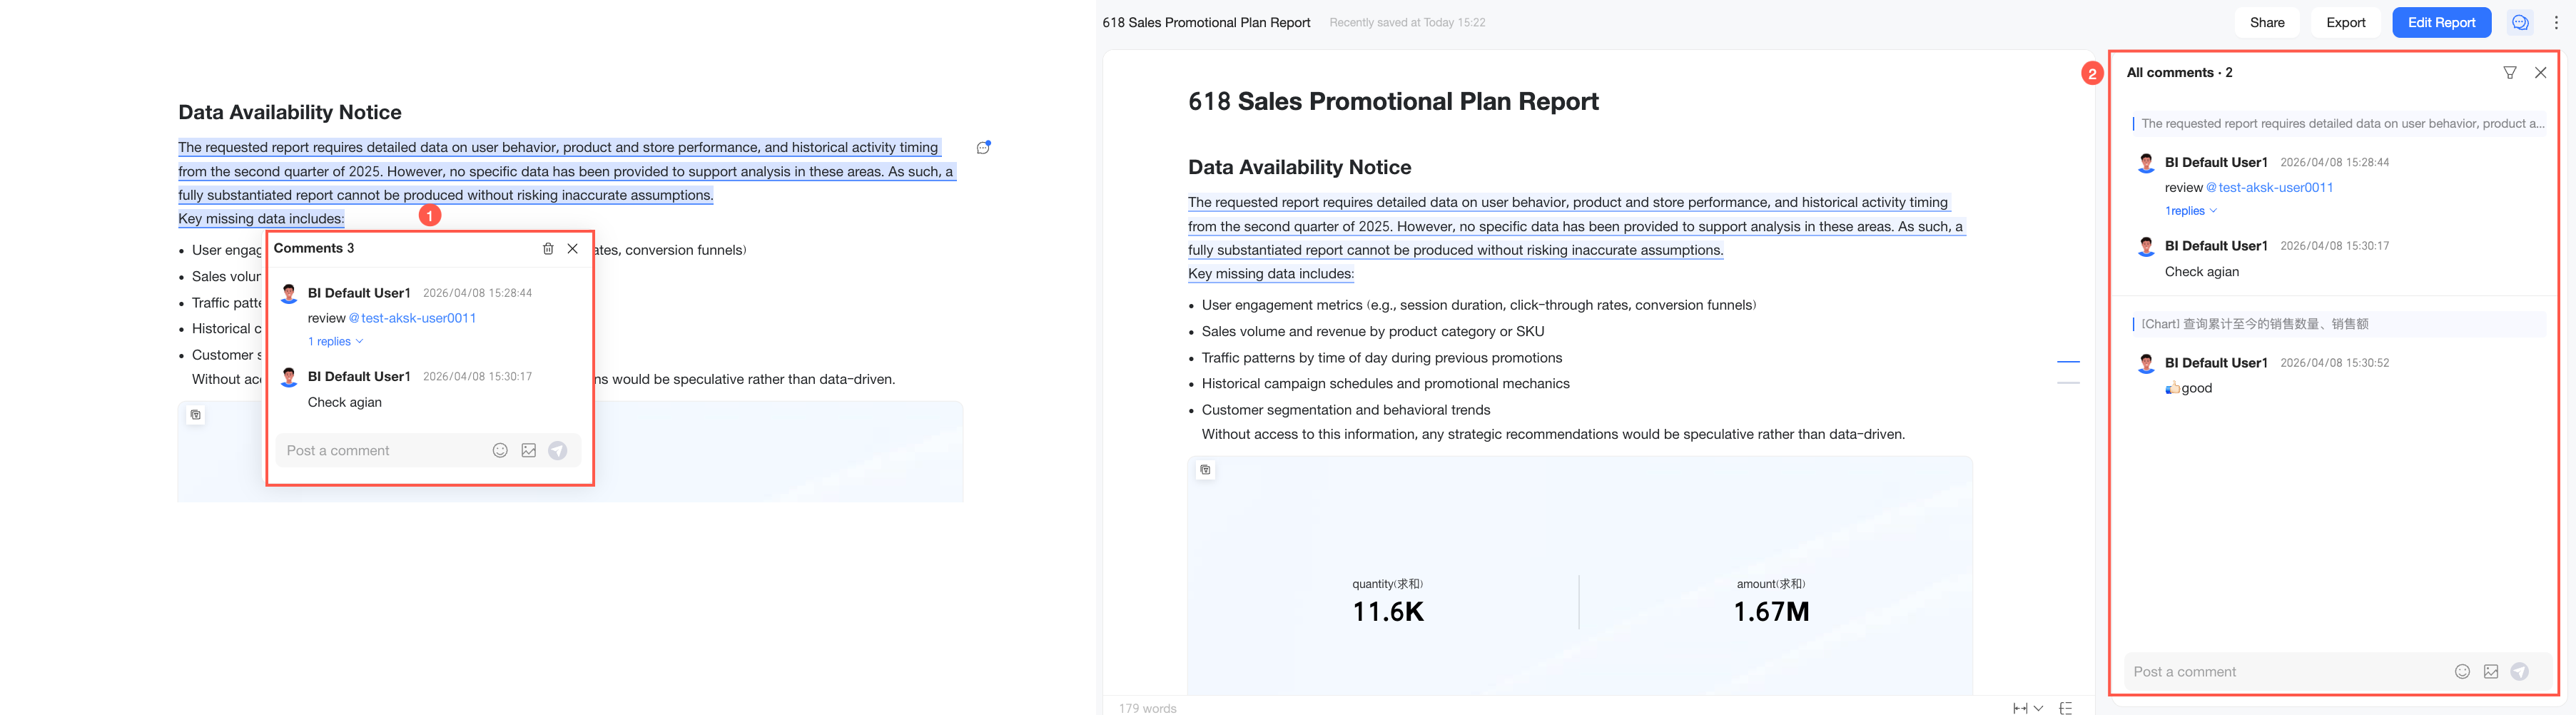
View and manage comments: You can view and manage comments on specific content in the body of the report, or use the global comment pane to centrally view and manage all comments in the entire report.
Management scope
Description
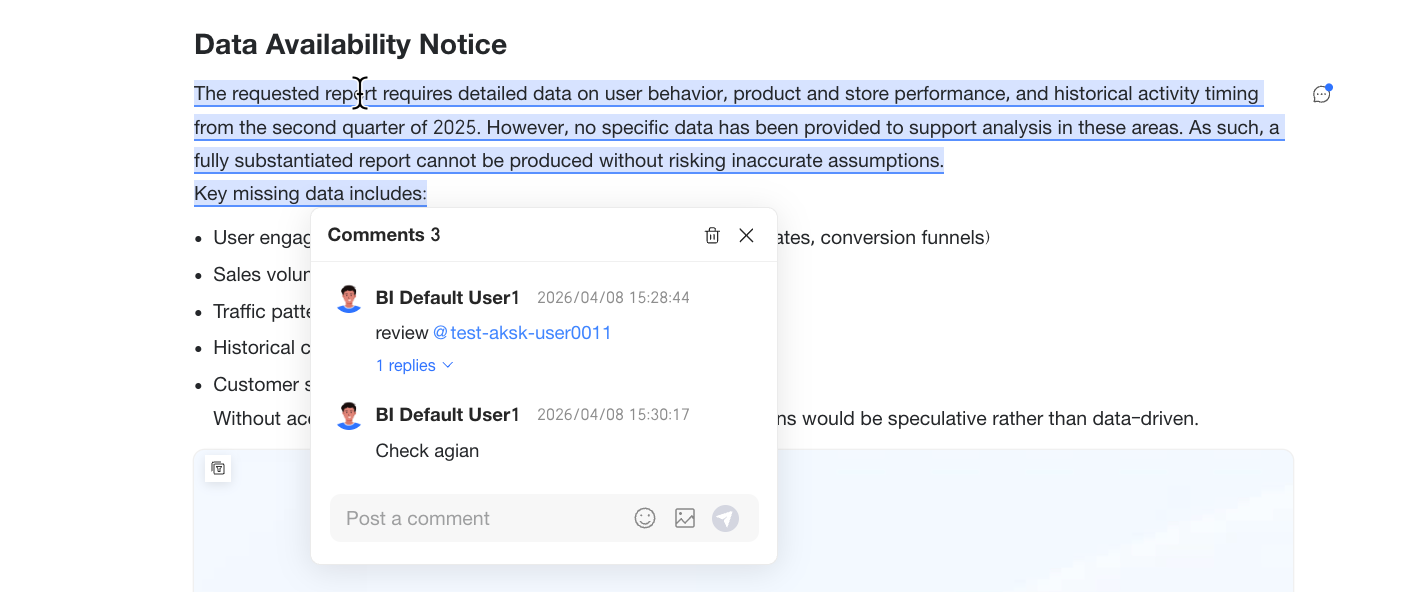
① Comments on specific content
The method for viewing comments depends on the content type:
-
For text, hover over the commented text, then click the paragraph or the
icon on the right. This opens a Comment floating window where you can view all comments for that text. -
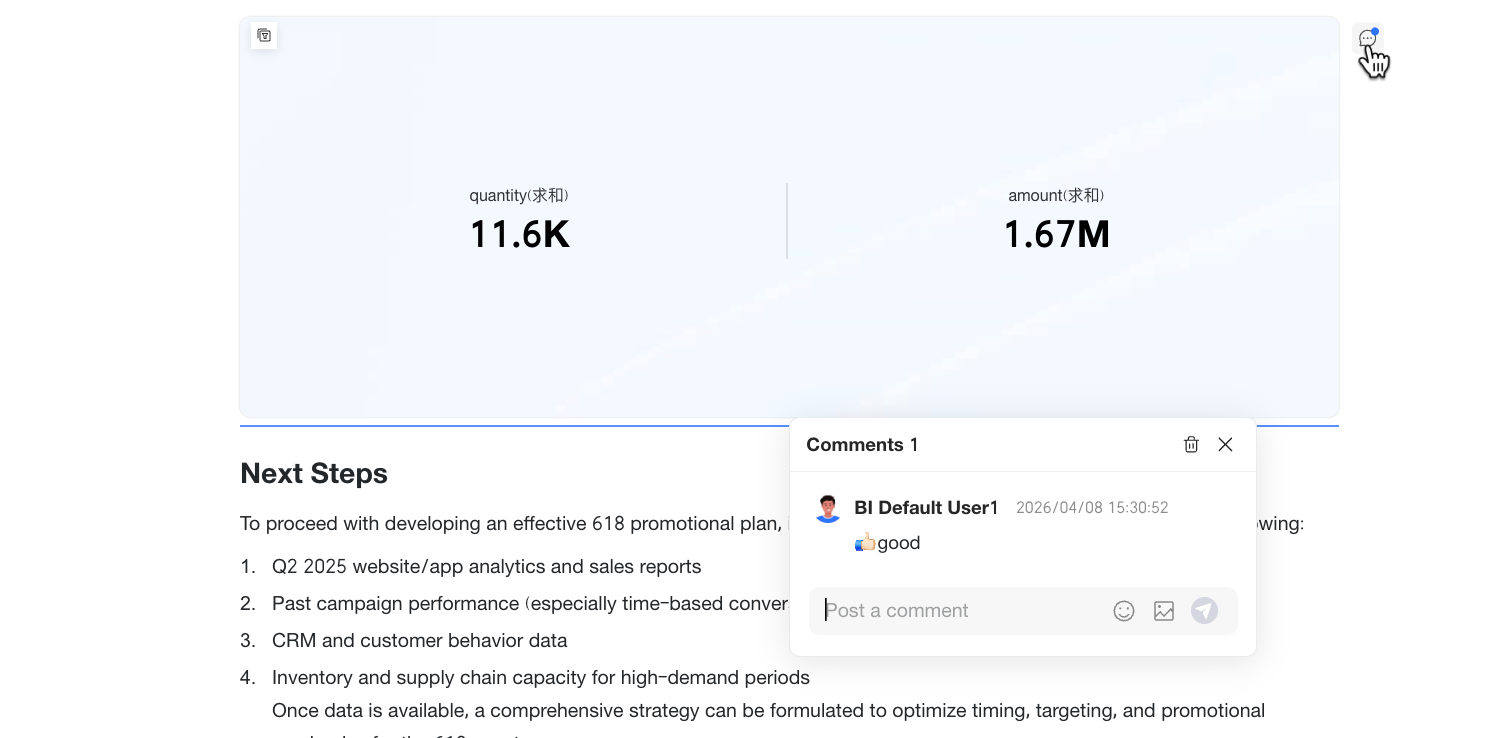
For a chart, hover over the commented chart and click the
icon on the right. This opens a Comment floating window where you can view all comments for that chart.
In the Comment floating window, you can perform the following actions:
-
Add a comment: Add another comment on the current content. Even if a paragraph already has a comment, you can select a portion of the text to create a new, separate comment.
-
Reply to a comment: Hover over a comment and click the
icon to reply. -
Delete a comment: Hover over a comment and click the
icon to delete it. To delete all comments for the current content area in bulk, click the icon in the floating window.NoteYou can only delete comments and replies that you have posted.
-
Close the floating window: Click the
icon.
② Global comments
Click the
icon in the upper-right corner of the report preview page to open the global comment pane. This pane lists all comments in the report, where you can perform the following actions:-
Filter: Click the
icon to filter comments. You can select criteria such as All comments, Related to me, or Report global comments. -
Locate content: Click a comment in the list to automatically scroll to and highlight the corresponding content in the report.
-
Reply to a comment: Hover over a comment and click the
icon to reply. -
Delete a comment: To delete a comment you posted, hover over it and click the
icon.NoteYou can only delete comments and replies that you have posted.
-
Add a comment: Add a report-level comment in the editor.
-
Close the pane: Click the
icon to close the comment pane.
-
 icon in the upper-right corner of the chart and select Comment from the drop-down menu.
Data Permissions
Use data permissions to control access to sensitive information. For example, you can ensure team leads only view their own team's data and limit individual employees to their personal data.
How to configure:
-
On the report editing page, click the
icon, select Data Permissions, select the "Generate results based on viewer permissions" checkbox, and then click OK. -
You can also configure data permissions when you Save or Save As a report.
Effects:
-
After you enable data permissions, the system regenerates charts, Q&A results, and insights that use dynamic references according to each viewer's row- and column-level permissions. This creates a personalized experience for each user.
Note-
After you enable data permissions, data updates as follows:
-
If the report has a configured pre-generation task, when a user with pre-generation permissions (the task owner or a designated user) opens the report, the system displays the most recent cached results based on their data permissions, instead of regenerating them in real time. For other users, the system automatically queries data and regenerates the report based on the current viewer's data permissions.
-
If the report does not have a configured pre-generation task, the system automatically queries data and regenerates the report based on the current viewer's data permissions each time it is opened.
-
-
If you are viewing cached data and want the latest information, click the Update Data button in the upper-right corner of the preview page. However, the Update Data option is not available on reports accessed via a public link.
-
-
If data permissions are disabled, report components such as charts, Q&A results, and insights statically display data from the last time the report creator published it.
Use cases:
You can combine data permissions settings with different share methods for different scenarios. For example:
-
Personal weekly or monthly progress reports: When reporting to management, a concise summary is more effective. Since managers typically view a fixed set of information, specific permission controls are not necessary. In this scenario, do not enable data permissions and share the report using a public link.
-
Thematic reports without sensitive data: For reports like product usage analysis, the content is typically fixed and does not require access control after sharing. In this case, do not enable data permissions and share it using a public link.
-
Team sales progress reports: Access to reports containing sensitive internal information, such as individual performance data, must be strictly controlled. For example, team leads should only see their team's data, and each employee should only see their own. For this scenario, enable data permissions and share the report using a private link. This prevents data leaks and provides a personalized experience based on each user's permissions.
Global Parameters
Global parameters let external business systems pass values to a report. Multiple associated components, such as charts and attribution components, use these parameters to dynamically control the data they display.
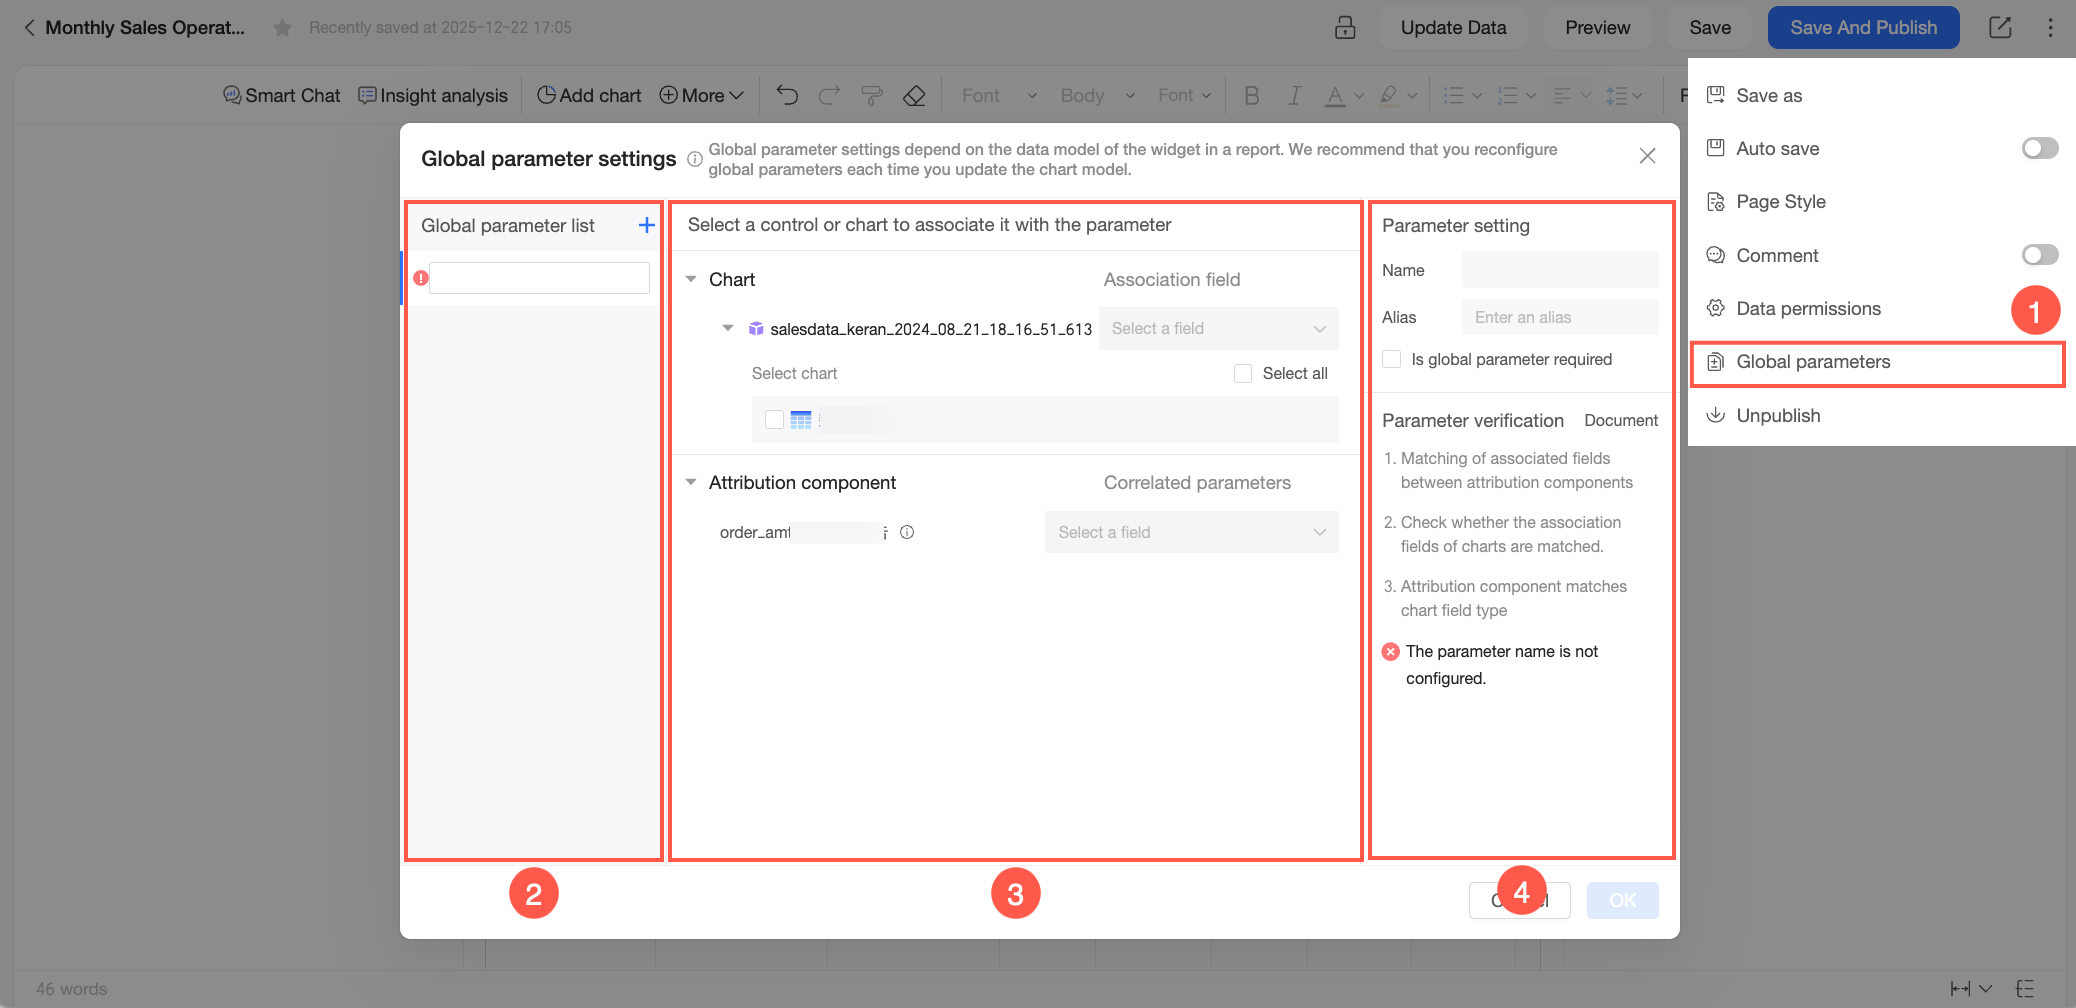
Use global parameters when you need to dynamically adjust component data based on external business parameters. For example, you can pass a time parameter to an attribution component in the report to view the attribution analysis for sales data at a specific time. On the Xiao Q report editing page, click the ![]() icon, select Global Parameters, and configure the settings in the Global Parameter Configuration dialog.
icon, select Global Parameters, and configure the settings in the Global Parameter Configuration dialog.
|
Area |
Description |
|
① |
The entry point for global parameter configuration. Note
Save the report to enable global parameter configuration. This option is unavailable for unsaved reports. |
|
② |
Set the global parameter name. The name must follow these rules:
You can click the |
|
③ |
Select the components to link to the global parameter. You can link to charts and attribution components in the report.
Note
|
|
④ |
Parameter settings.
|
 icon next to a component's name to view its dataset. Select the fields in the attribution component that will receive the global parameter value. The linked attribution component then automatically adjusts its analysis based on the received value. For instructions on inserting an attribution component, see
 -
To ensure parameter validity, the system checks configurations in real time. If any parameter has a conflict, you cannot save the configuration.
-
The global parameter configuration depends on the current content of the report. Modifying the report can break existing parameter links. Review the global parameter configuration after modifying a report. If a configuration conflict occurs, follow the prompts to adjust the settings.
Pre-generation Task
Pre-generation pre-calculates and caches data for dynamically referenced components in a report. After you configure a task, the system generates data for charts, Q&A results, and insights on a schedule or through manual triggers, so other members can view cached results when they preview or subscribe to the report without long load times.
Configuration
Report editors can configure a pre-generation task on the edit page of a published report to periodically or manually pre-generate data for a Quick BI report. The pre-generated data can be used for report previews and subscription and distribution. Follow these steps:
-
A pre-generation task only updates dynamically referenced components in a report. It does not regenerate the entire report.
-
A pre-generation task only updates the published data in the report preview state. It does not update unpublished data in the editing state.
-
You can configure a maximum of 50 pre-generation tasks per organization.
-
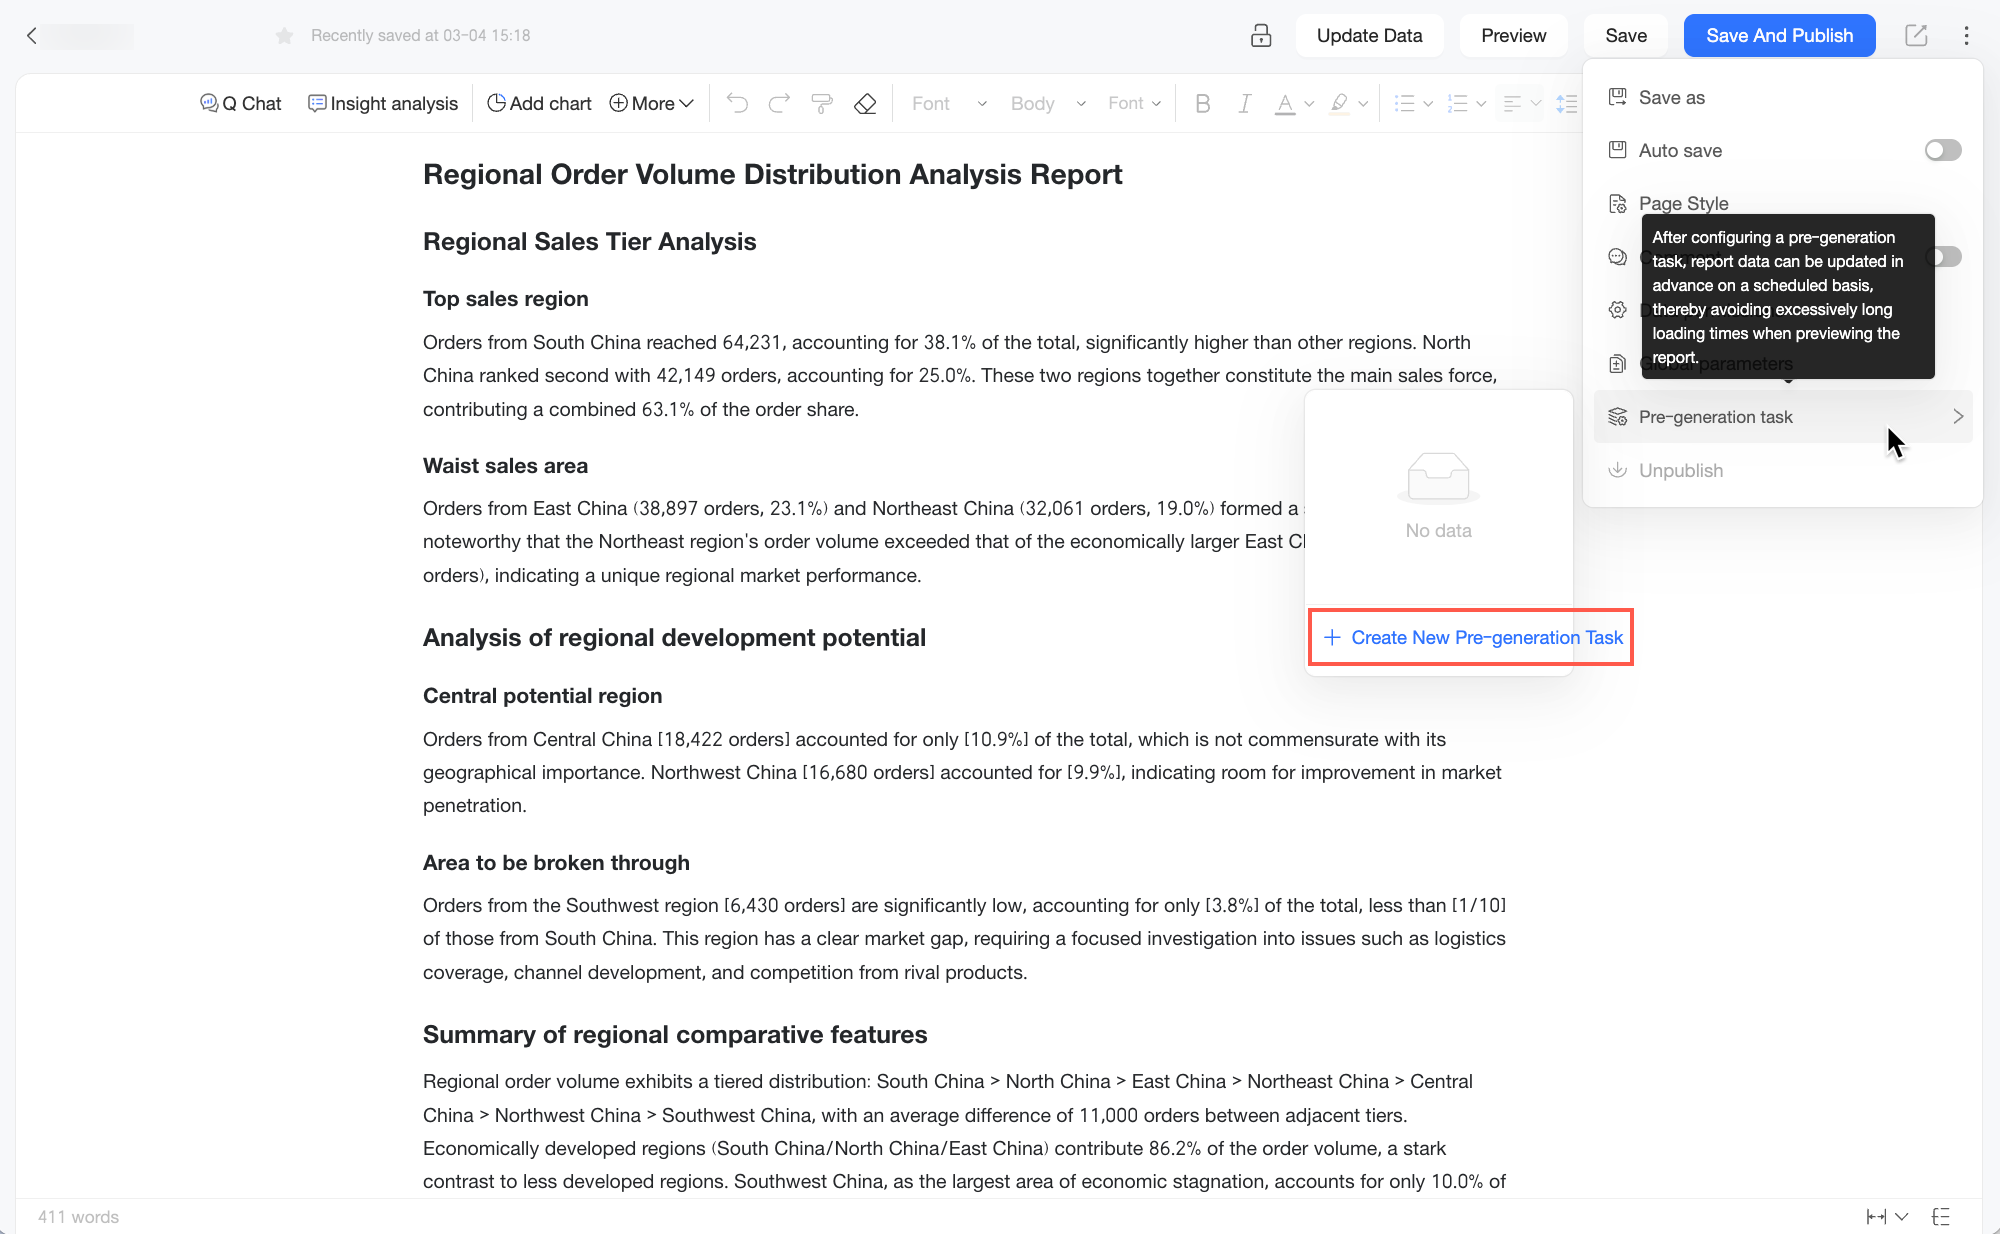
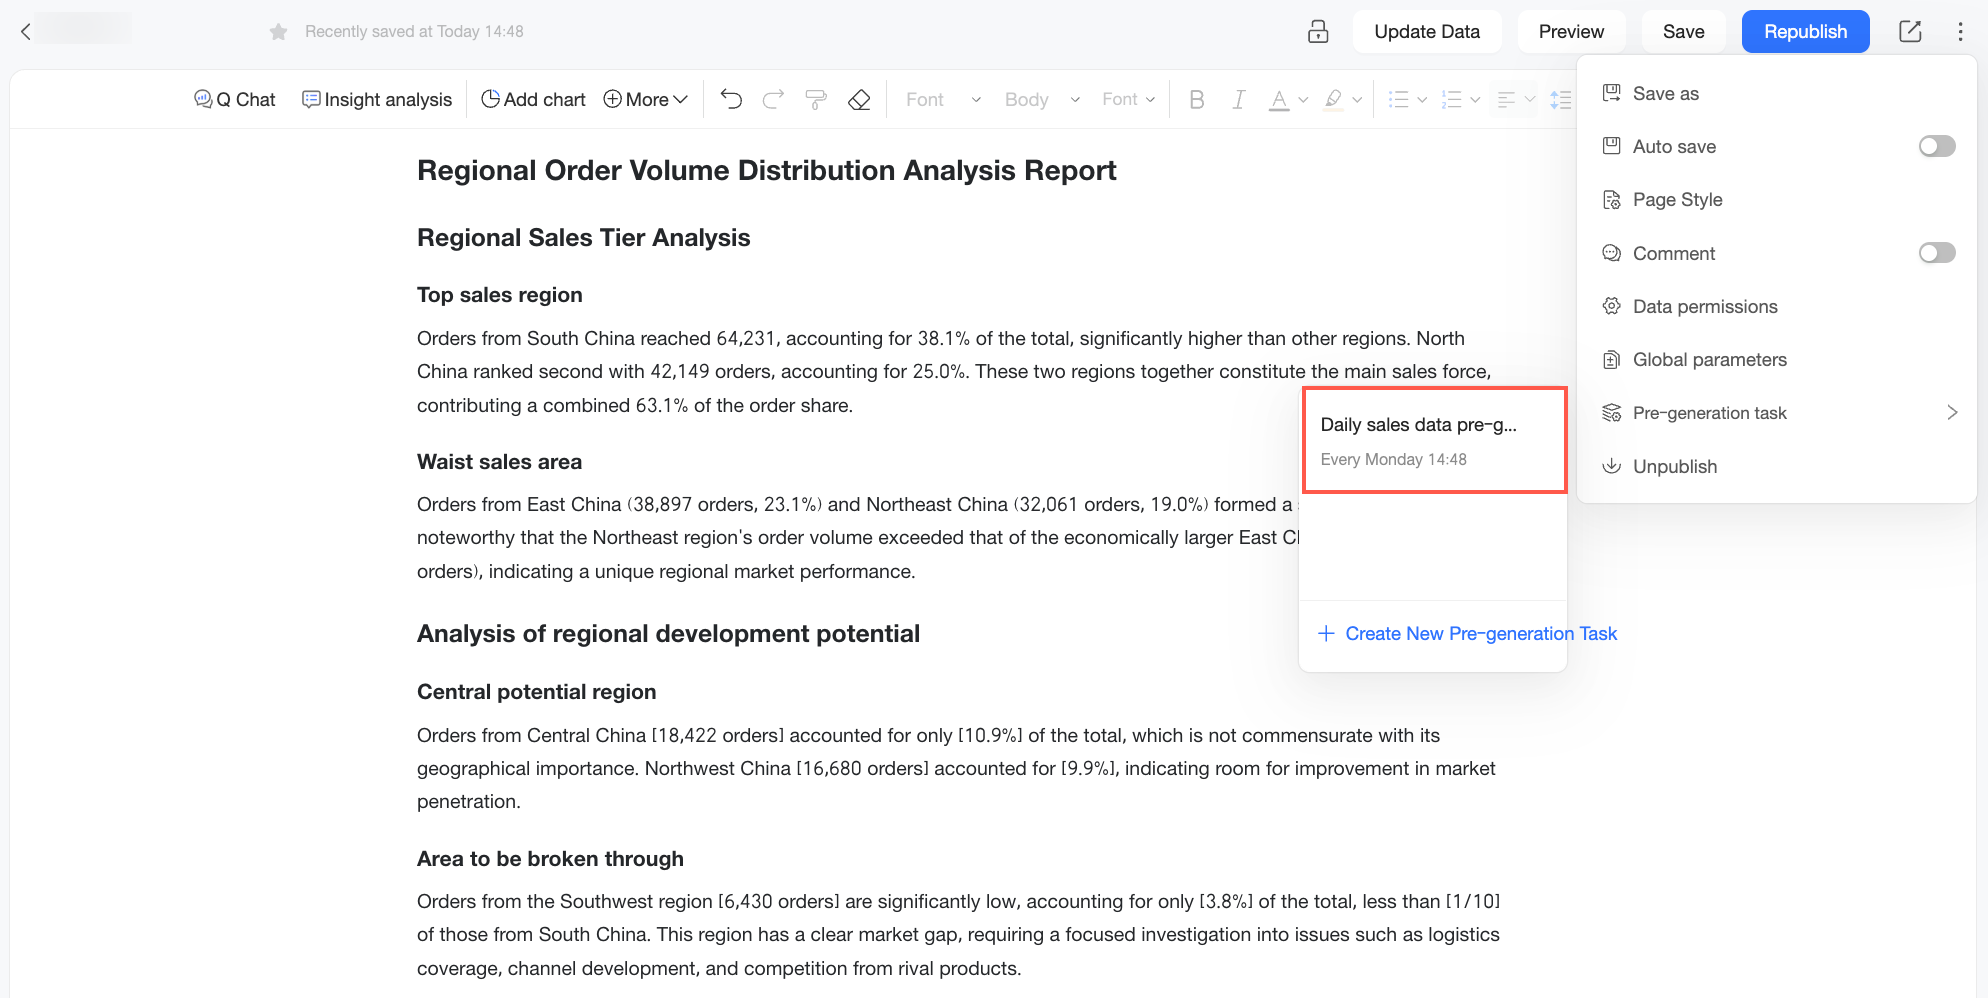
Click the
icon in the upper-right corner of the report edit page and select Pre-generation Task > New Pre-generation Task from the drop-down menu. -
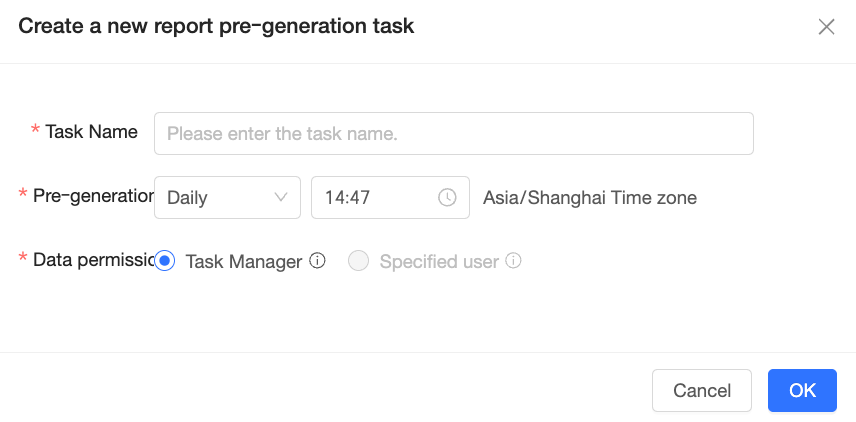
In the New Report Pre-generation Task dialog box, configure the following parameters and then click OK.
Parameter
Description
Task Name
The name for the pre-generation task. For example, "Daily Sales Report Pre-generation".
Pre-generation Time
The schedule for the pre-generation task.
You can also manually trigger the task. For details, see manual pre-generation.
Data Permissions
The data permissions to use for task execution.
-
Pre-generate the report based on task owner permissions. The task uses the editor's permissions to generate shared content for all users.
-
Pre-generate the report based on specified user permissions. The task generates separate, non-shared content based on the permissions of each selected user. After selecting this option, you must select up to 30 users from the drop-down list.
Note-
Ensure that data permissions are enabled for the published version of the report. Otherwise, the specified user permissions option is disabled. If you disable data permissions while a pre-generation task with specified user permissions is running, the system pauses the task.
-
You can create a maximum of 30 pre-generation tasks with specified user permissions per organization.
-
-
After the pre-generation task is created, it appears in the pre-generation task list on the edit page.
Hover over a task and click the icon on its right to Edit or Delete it. -
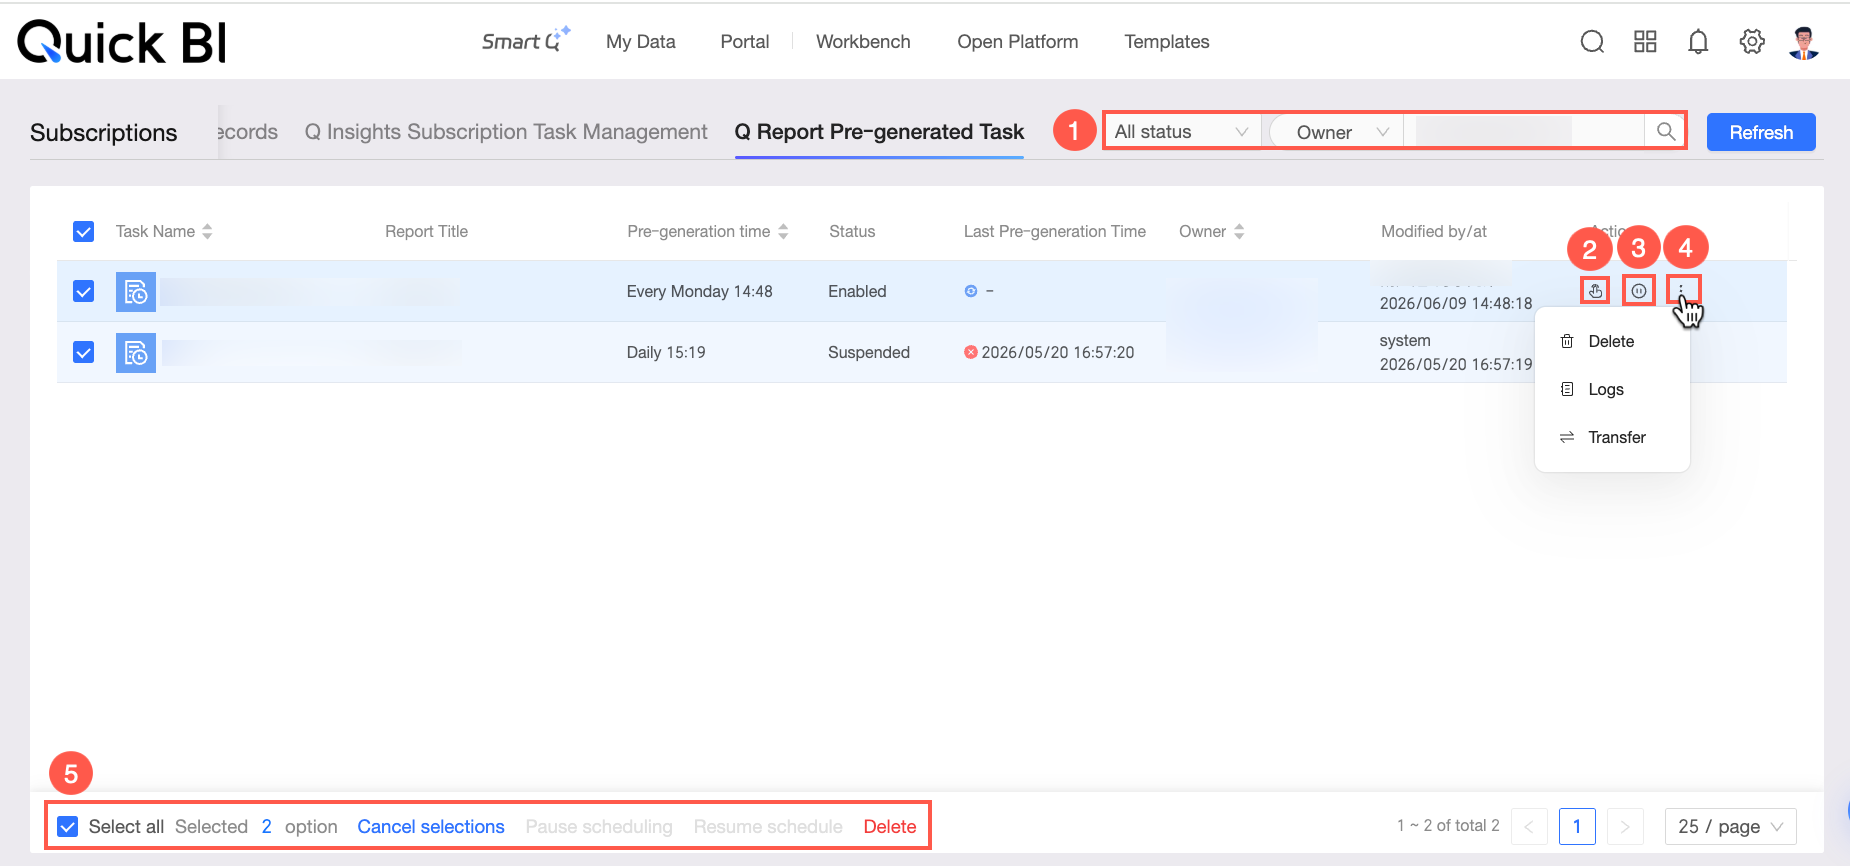
Alternatively, go to the Subscription Management page. The Quick BI Report Pre-generation Task Page tab lists pre-generation tasks for reports that you have permission to edit. On this tab, you can view information such as task name, report name, pre-generation time, and task status, and perform the following operations:
-
① Filter: Quickly filter tasks by status, owner, or task name.
-
② Manual pre-generation: Click the
icon to immediately trigger the task.You cannot manually trigger a task with specified user permissions if it was paused due to disabled data permissions.
-
③ Pause/resume scheduling: Pause a running task or resume a paused one.
You cannot manually resume scheduling for a task with specified user permissions if it was paused due to disabled data permissions.
-
④ More operations: Click the
icon to open a drop-down menu with the following options.-
Click
to delete the current pre-generation task. -
Click
to view the execution logs for the current pre-generation task. -
Click
to transfer ownership of the current task to another user. Ensure the recipient has edit permissions for the report; otherwise, the transfer will fail.
-
-
⑤ Batch operations: Select multiple tasks to perform batch operations, such as Pause Scheduling, Resume Scheduling, Delete, and Deselect.
-
 Hover over a task and click the
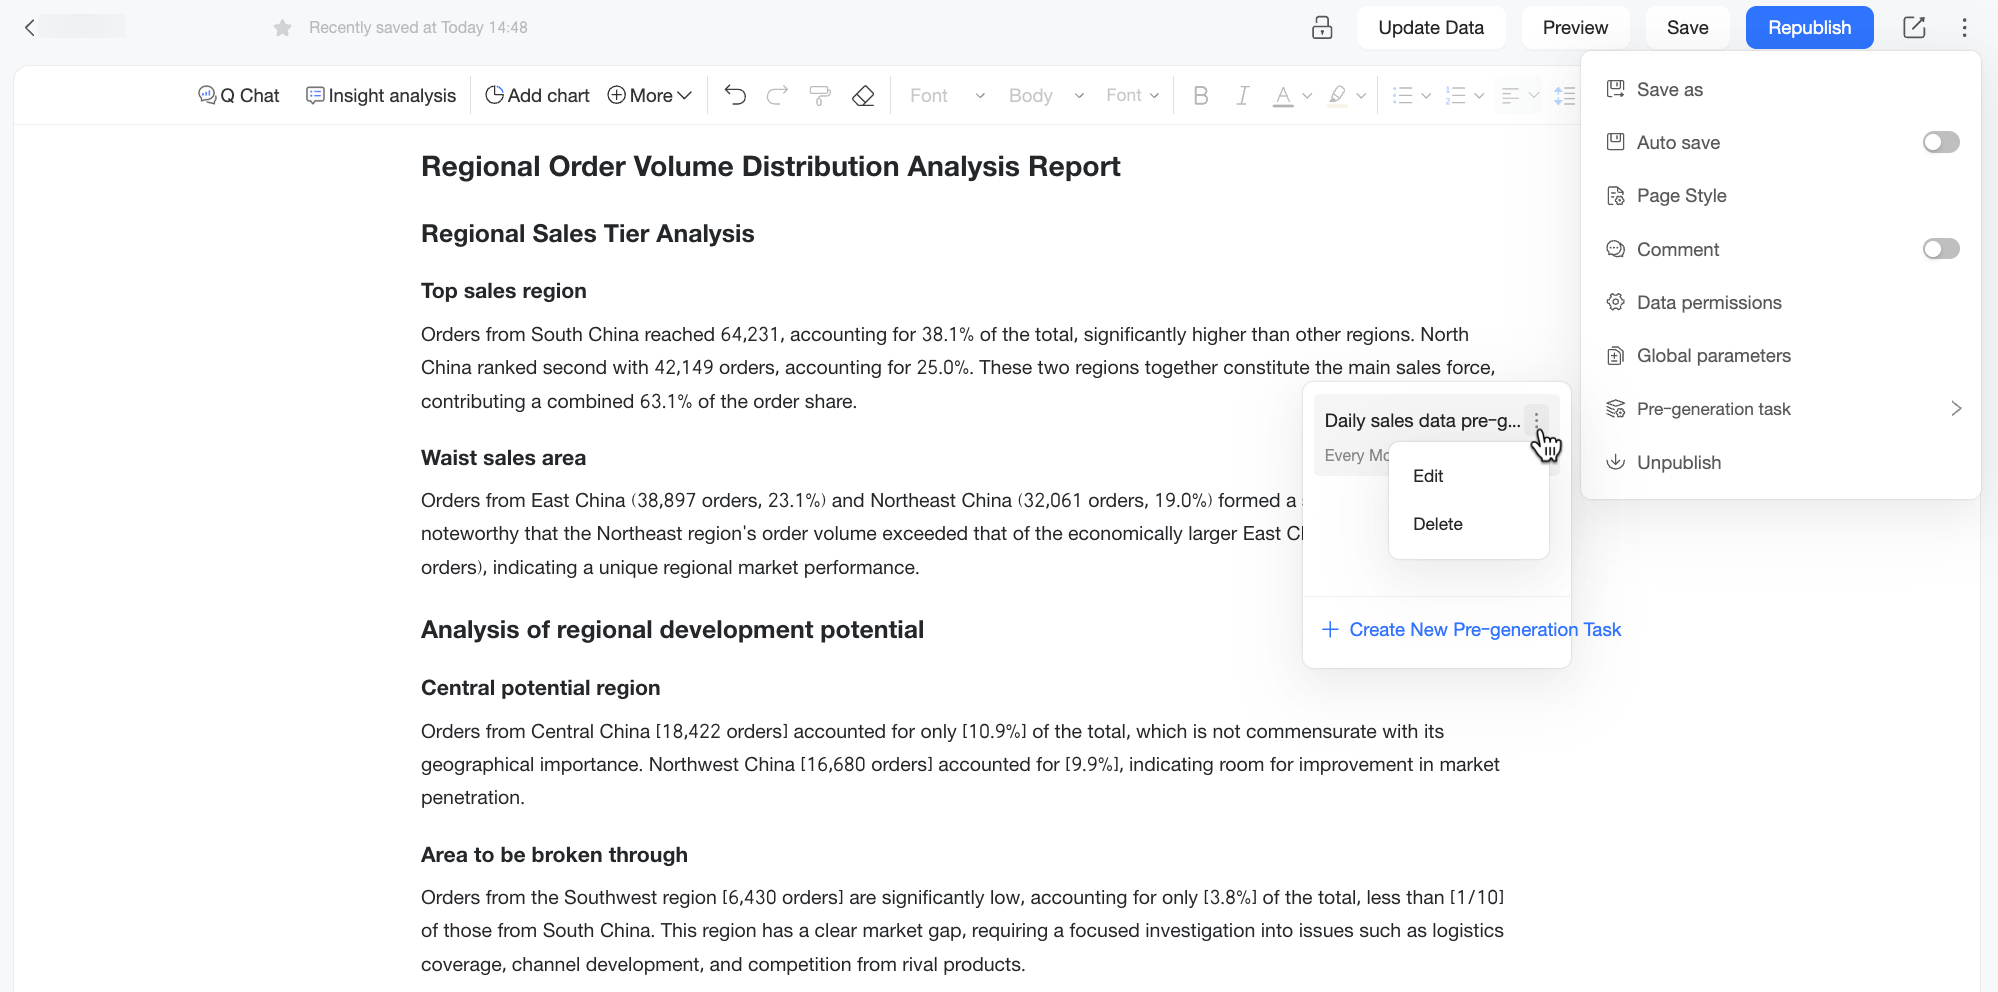
 to delete the current pre-generation task.
 to view the execution logs for the current pre-generation task.
Unpublishing
On the Q Report edit page, click the ![]() icon and select unpublish. Once unpublished, the report can only be viewed and edited by its creator.
icon and select unpublish. Once unpublished, the report can only be viewed and edited by its creator.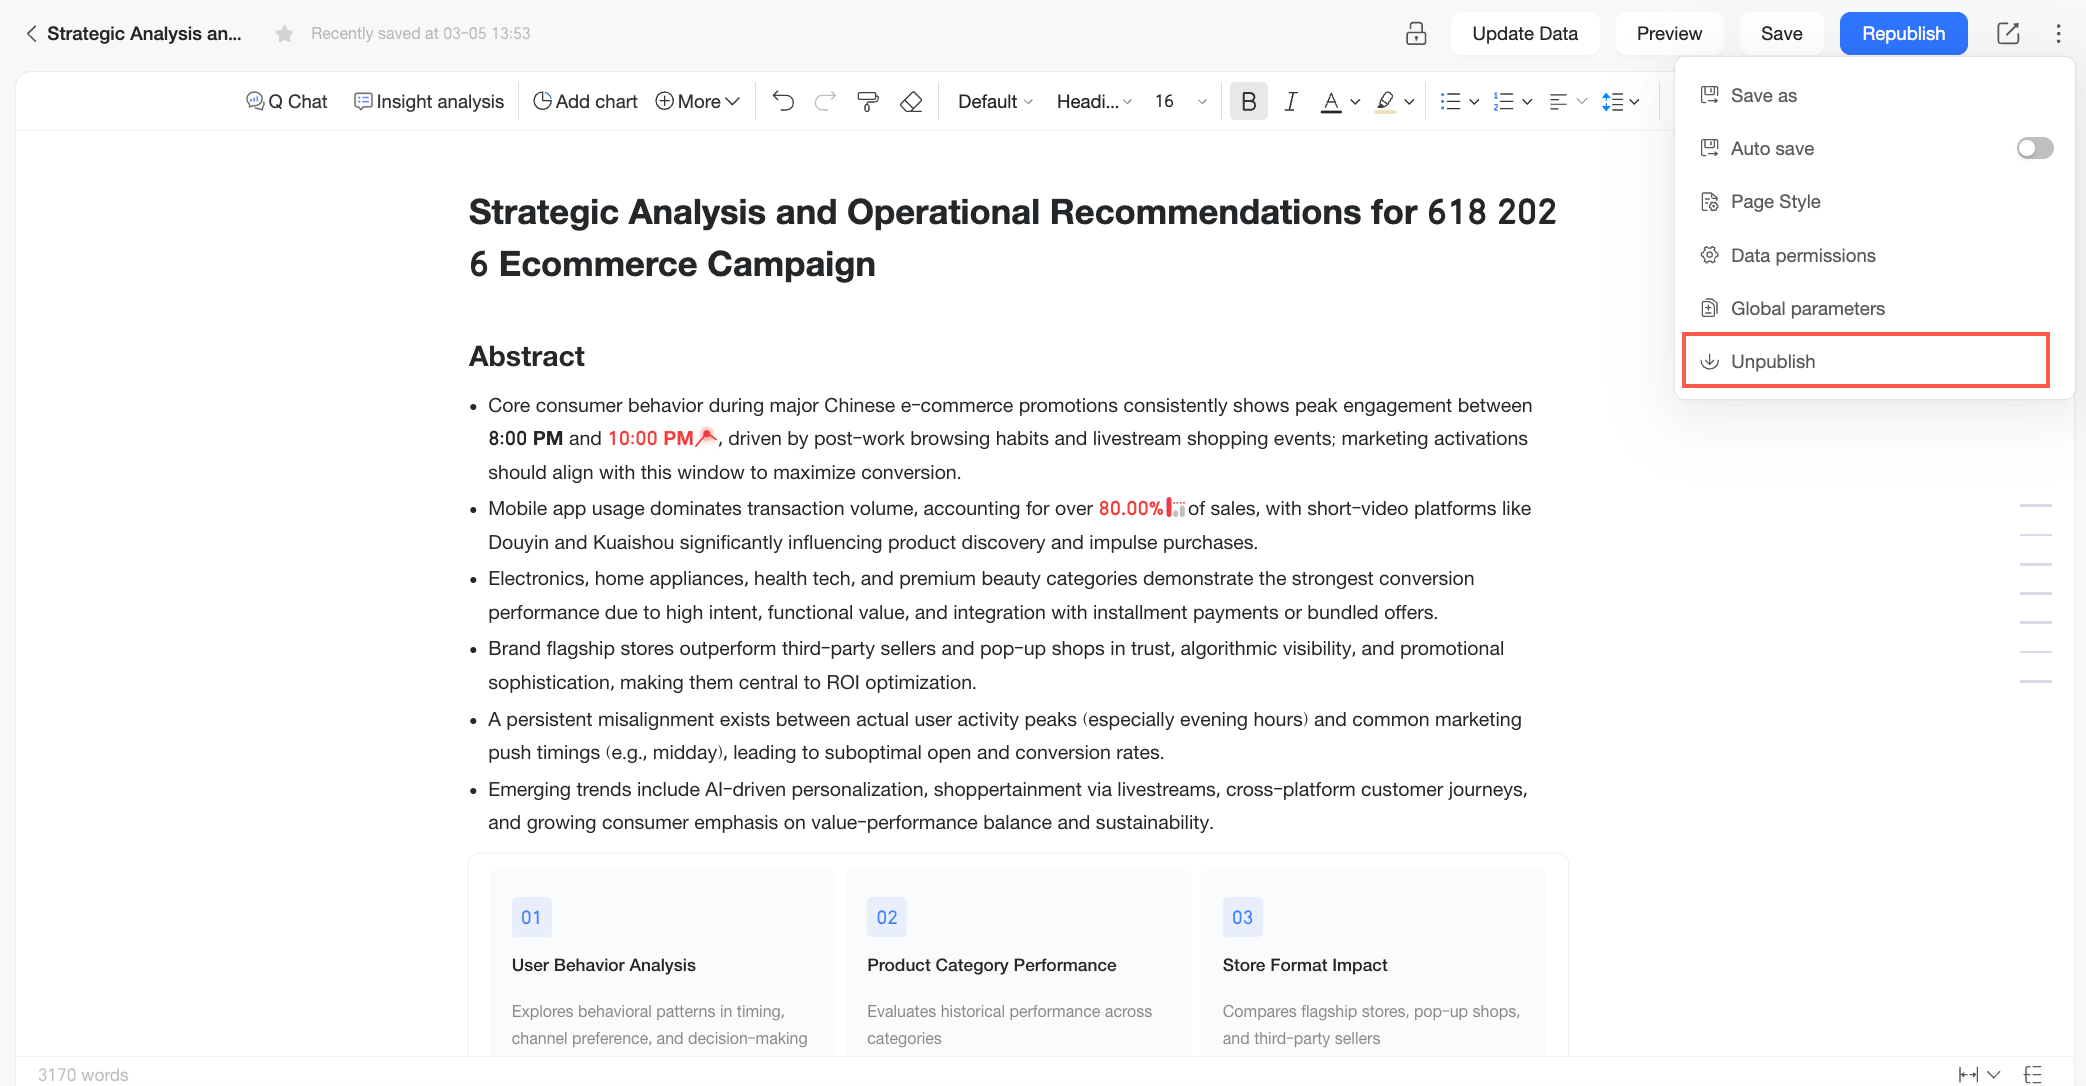
Alternatively, on the Q Report list page, click the ![]() icon for the target report and select unpublish.
icon for the target report and select unpublish.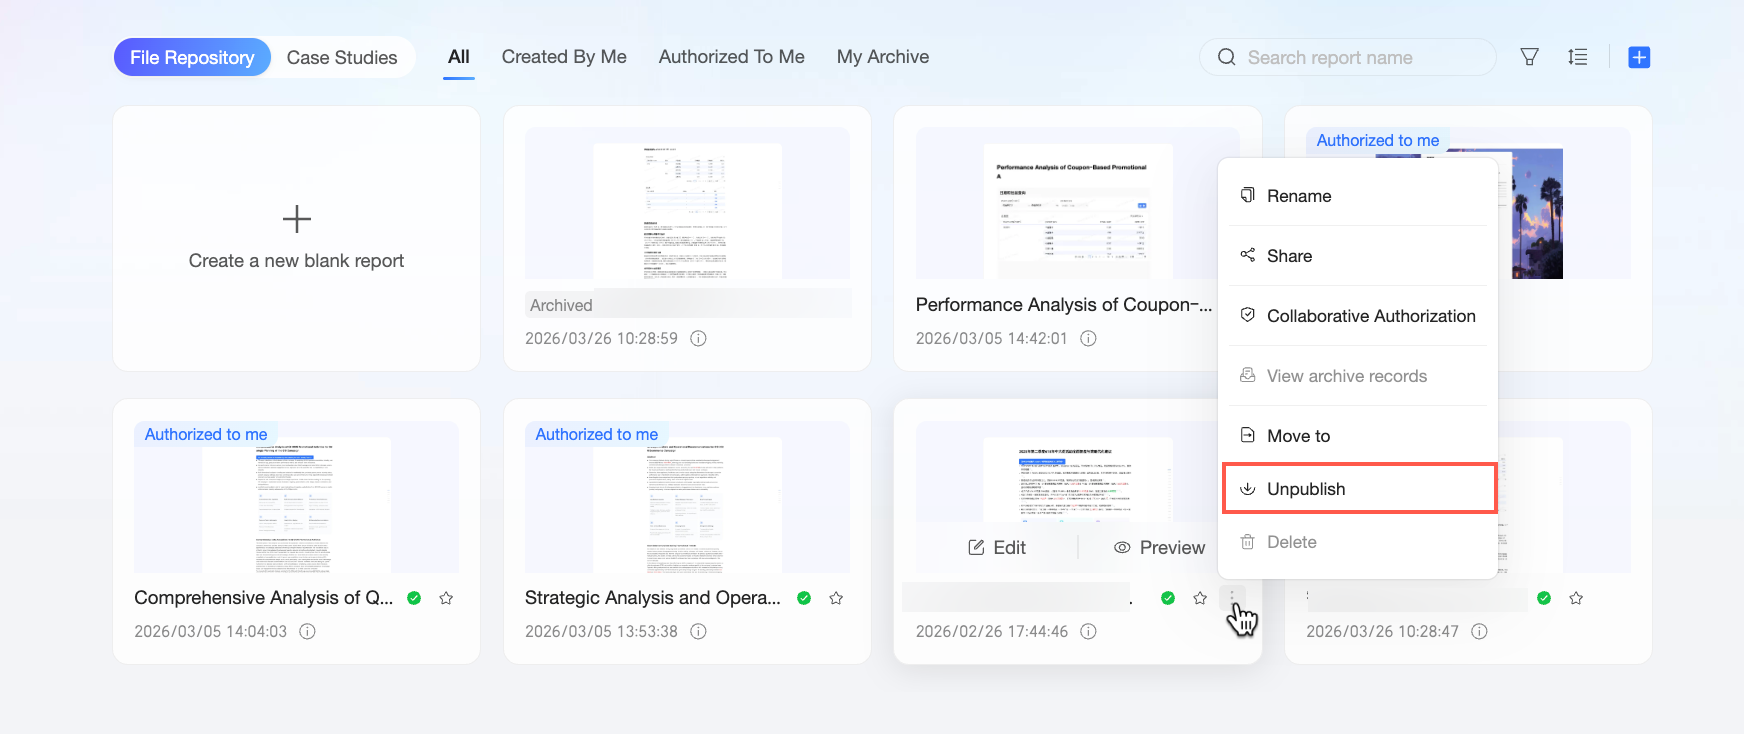
Q Report List Page
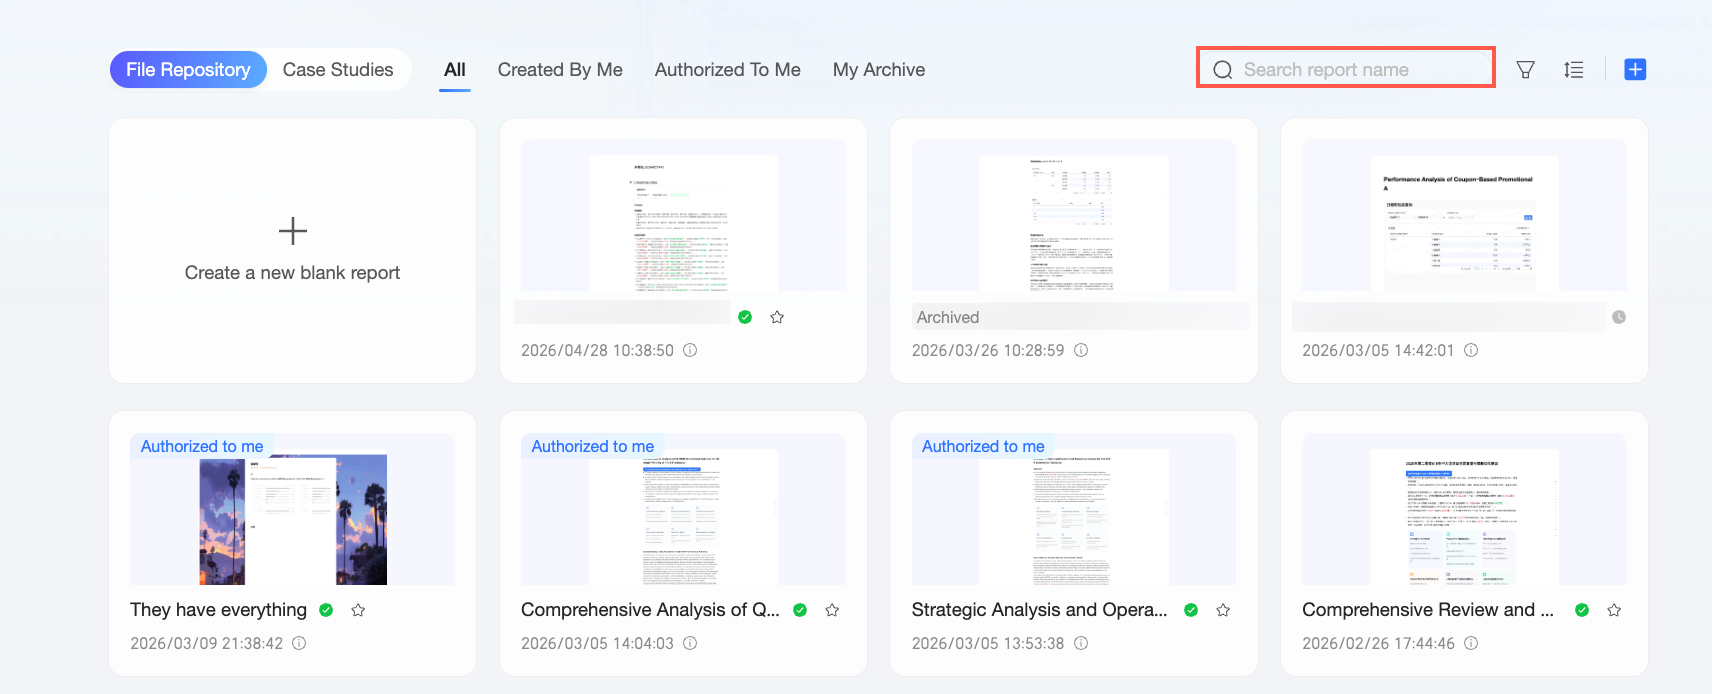
The Xiao Q Report list page shows all reports you can access, including those created by me, shared with me, and in my archives. You can also search, filter, and sort reports.
Search
You can search by report name to quickly find the report you need.
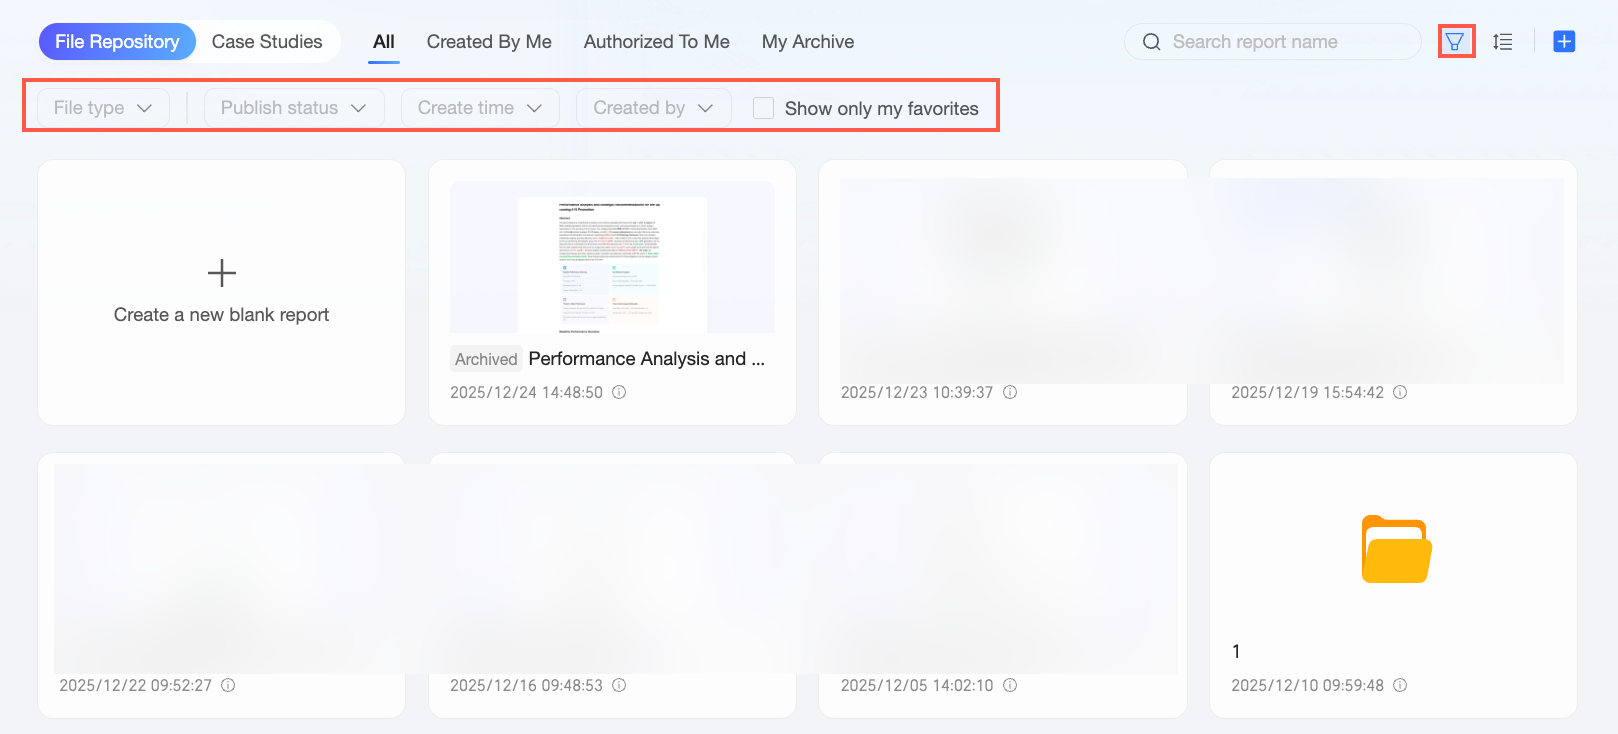
Filter
Click the filter icon (![]() ) to open the filter panel for the current tab. Filtering narrows the list, helping you quickly find reports that meet specific criteria.
) to open the filter panel for the current tab. Filtering narrows the list, helping you quickly find reports that meet specific criteria.
The favorites only option is available on all tabs, but other filter options vary. If you configure filter criteria on one tab and then switch to another, the system carries over the filter values for any matching criteria on the new tab.
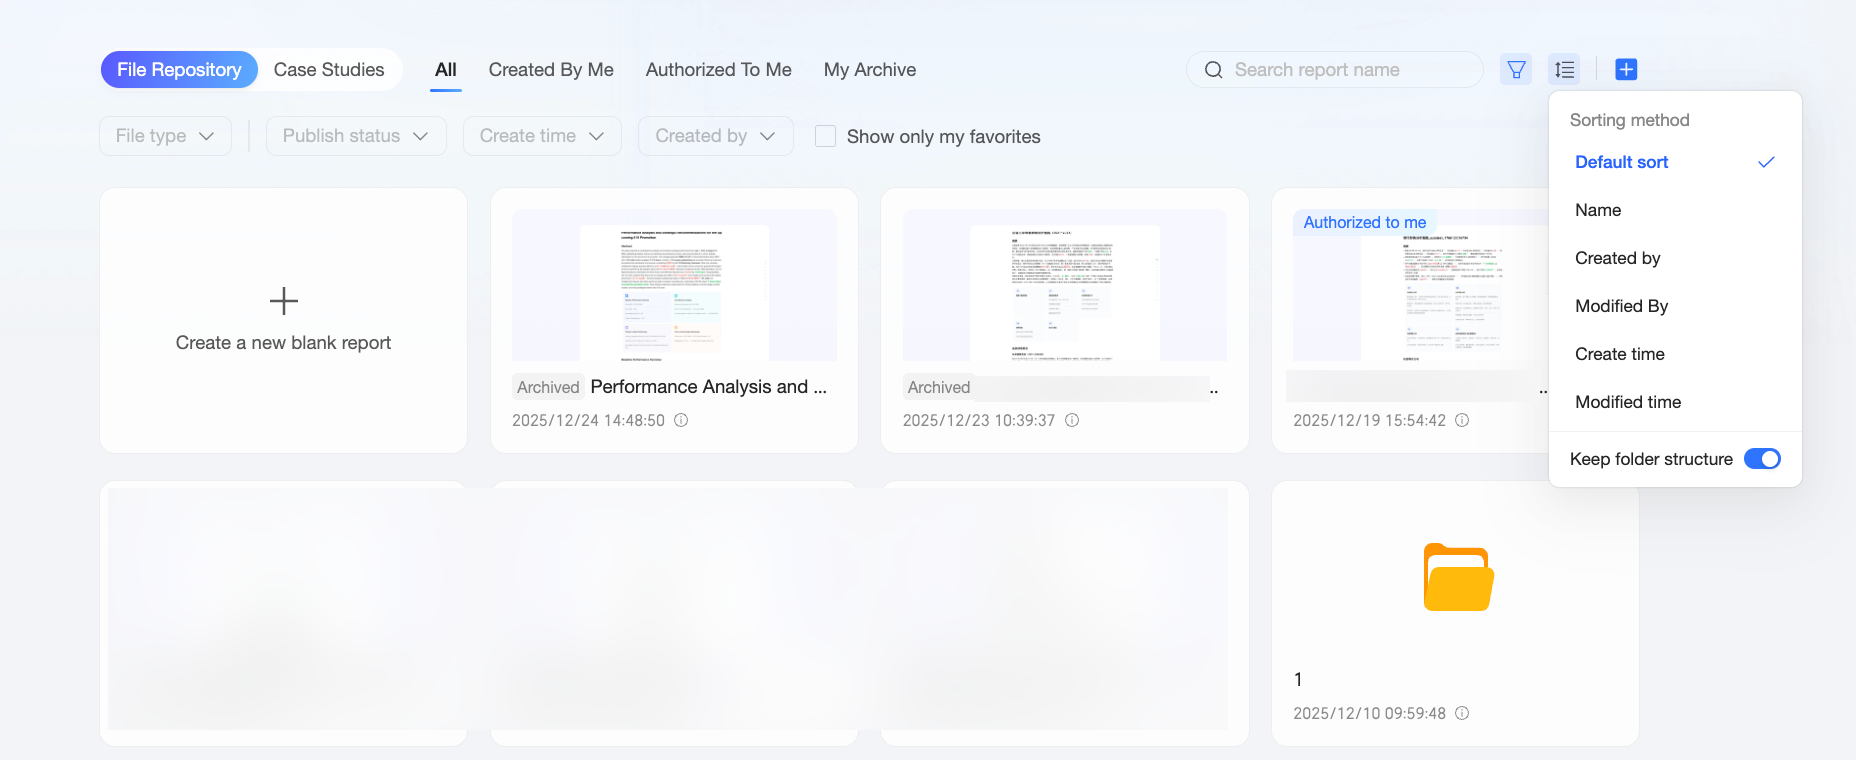
Sort
Set the sort order to prioritize which reports appear first.
-
You can sort by name, creator, modified by, creation time, and modification time.
-
Selecting this option preserves the folder structure. Clearing it hides folders and displays only the reports within them.
New
You can create a new blank report or a new folder.
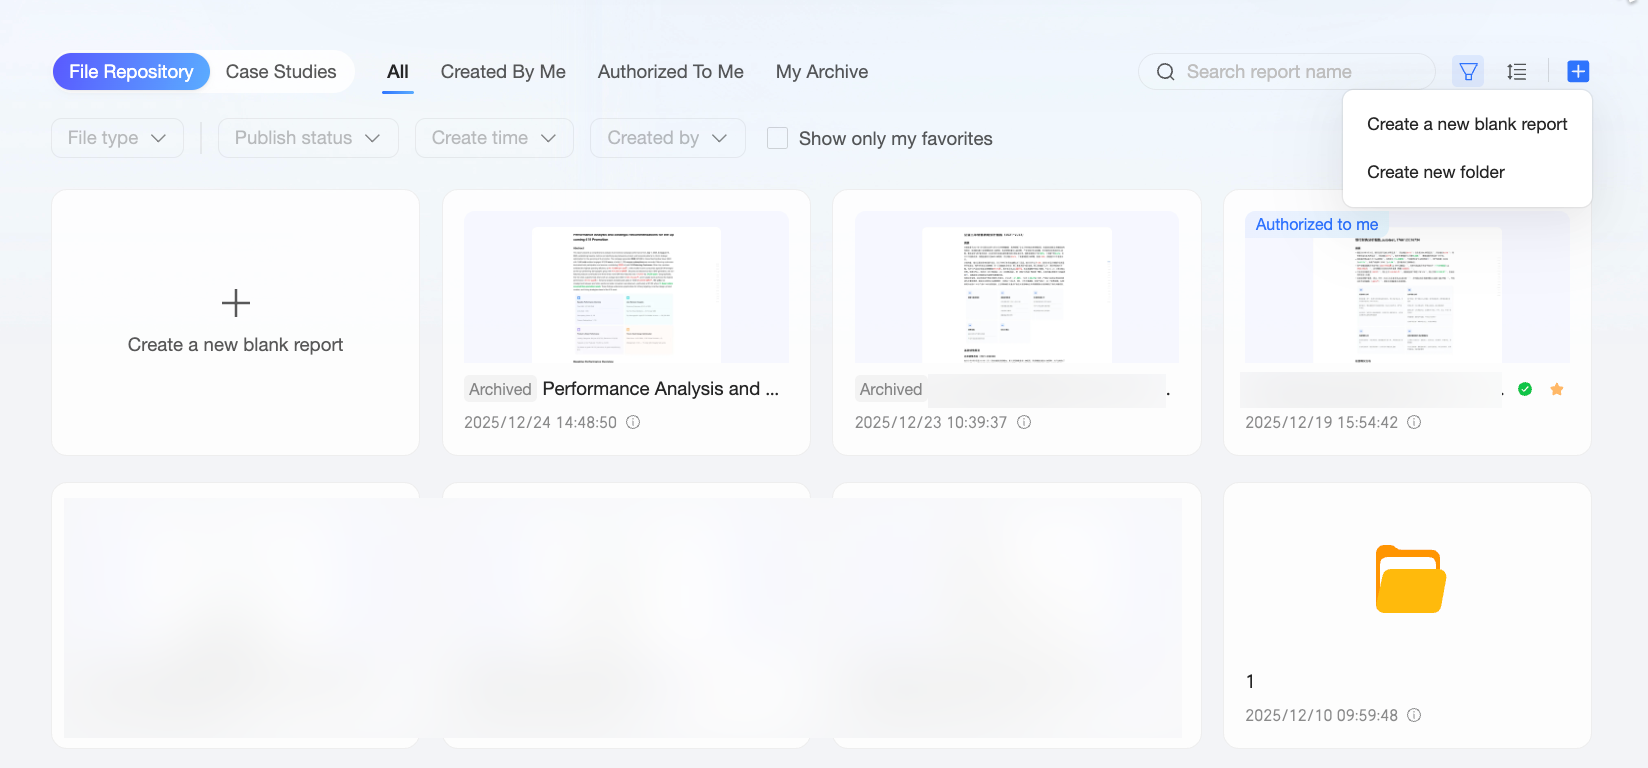
You cannot create a new blank report or a new folder on the shared with me tab.
-
Click New Blank Report to create a blank report where you can edit text, insert existing charts, and use features such as Xiao Q Ask Data. For more information, see Create a Q-Report.
-
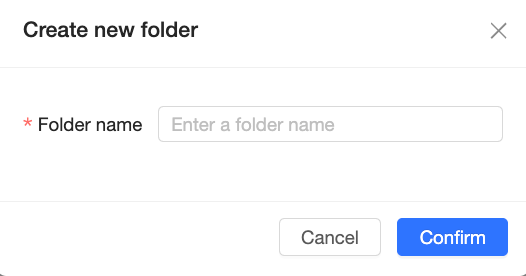
Click new folder, enter a folder name, and then click OK to create the folder.
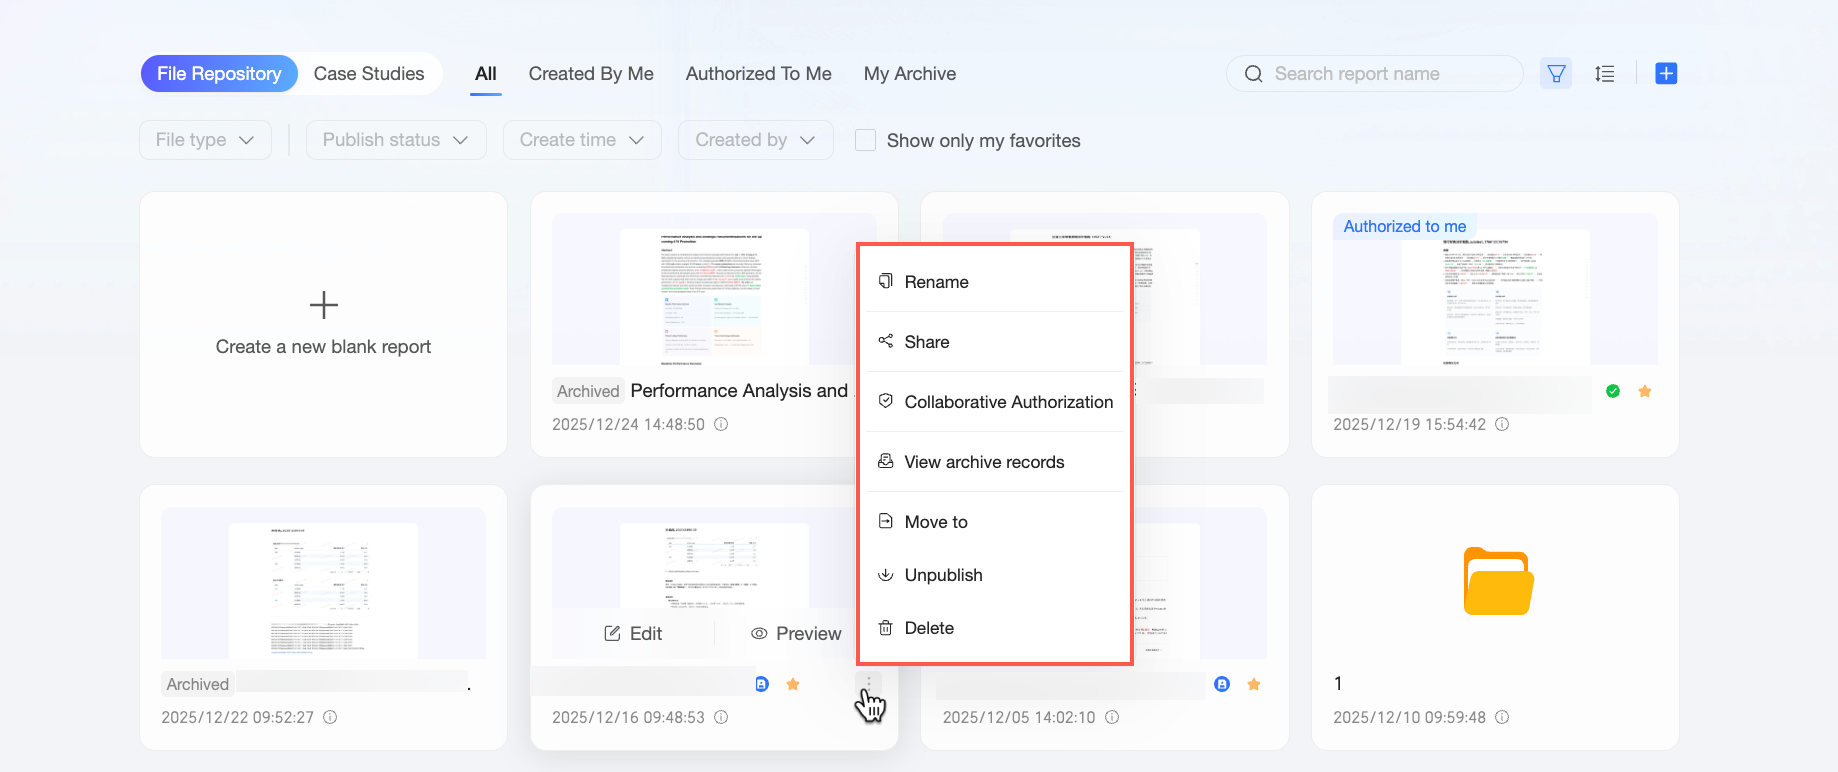
Manage Reports
On the Quick BI report list page, hover over a report card to see the edit (![]() ), preview (
), preview ( ), and More (
![]() ) options. You can then perform several operations.
) options. You can then perform several operations.
|
Action |
Description |
|
edit |
Opens the Quick BI report editor. Note
The edit option is available only if you have edit permission for the report. You have edit permission if:
|
|
preview |
Opens the preview of the Quick BI report. |
|
rename |
Rename the Quick BI report.
|
|
share |
Share the Quick BI report by using a private link or a public link. For more information, see Share a report. |
|
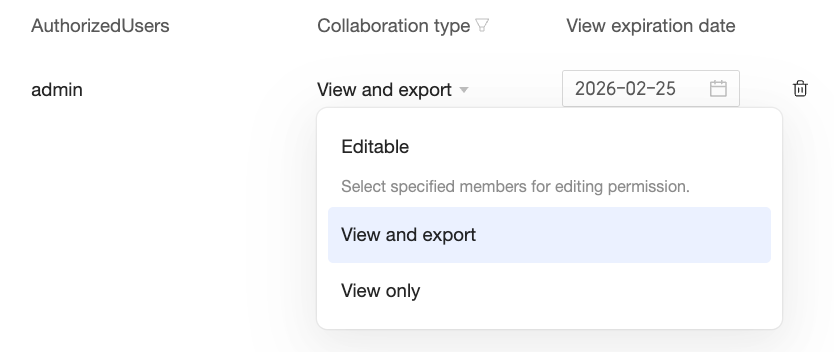
share and permissions |
In the share and permissions dialog box, you can grant view, export, and edit permissions for the report to other users.
|
|
view archive records |
If the report has been archived, the view archive records option appears in the options list. Click this option to open the archive records page, which lists all archived versions of the report. For an archived report, you can select Go to Original Report from its options list to open the preview page of the original report. |
|
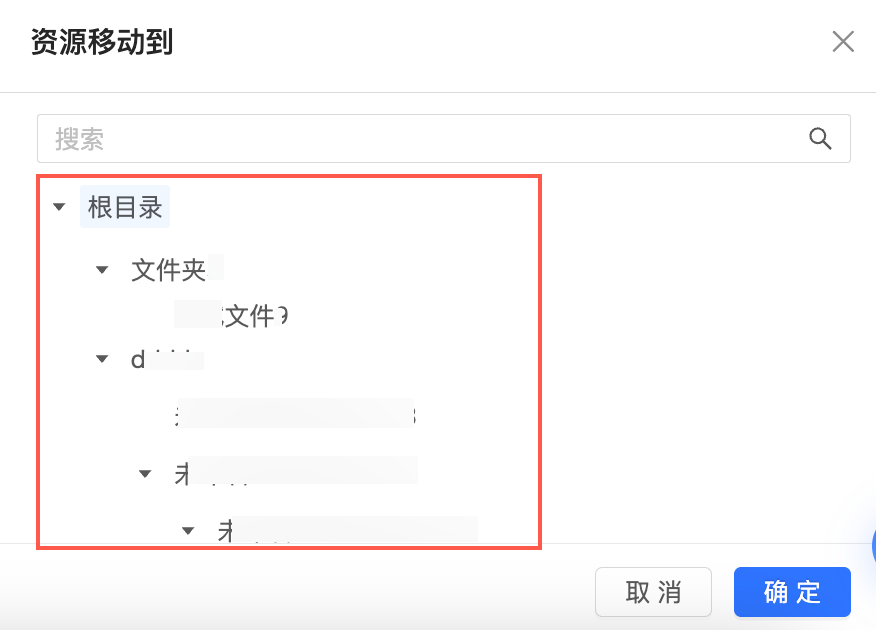
Move to |
Move the report to the root directory or another folder.
|
|
unpublish |
Unpublish the report. After a report is unpublished, other users can no longer view it. Only the creator can view and edit it. |
|
delete |
Delete the report. Note
You can delete a report only after you unpublish it. |
|
favorite |
Click the
|
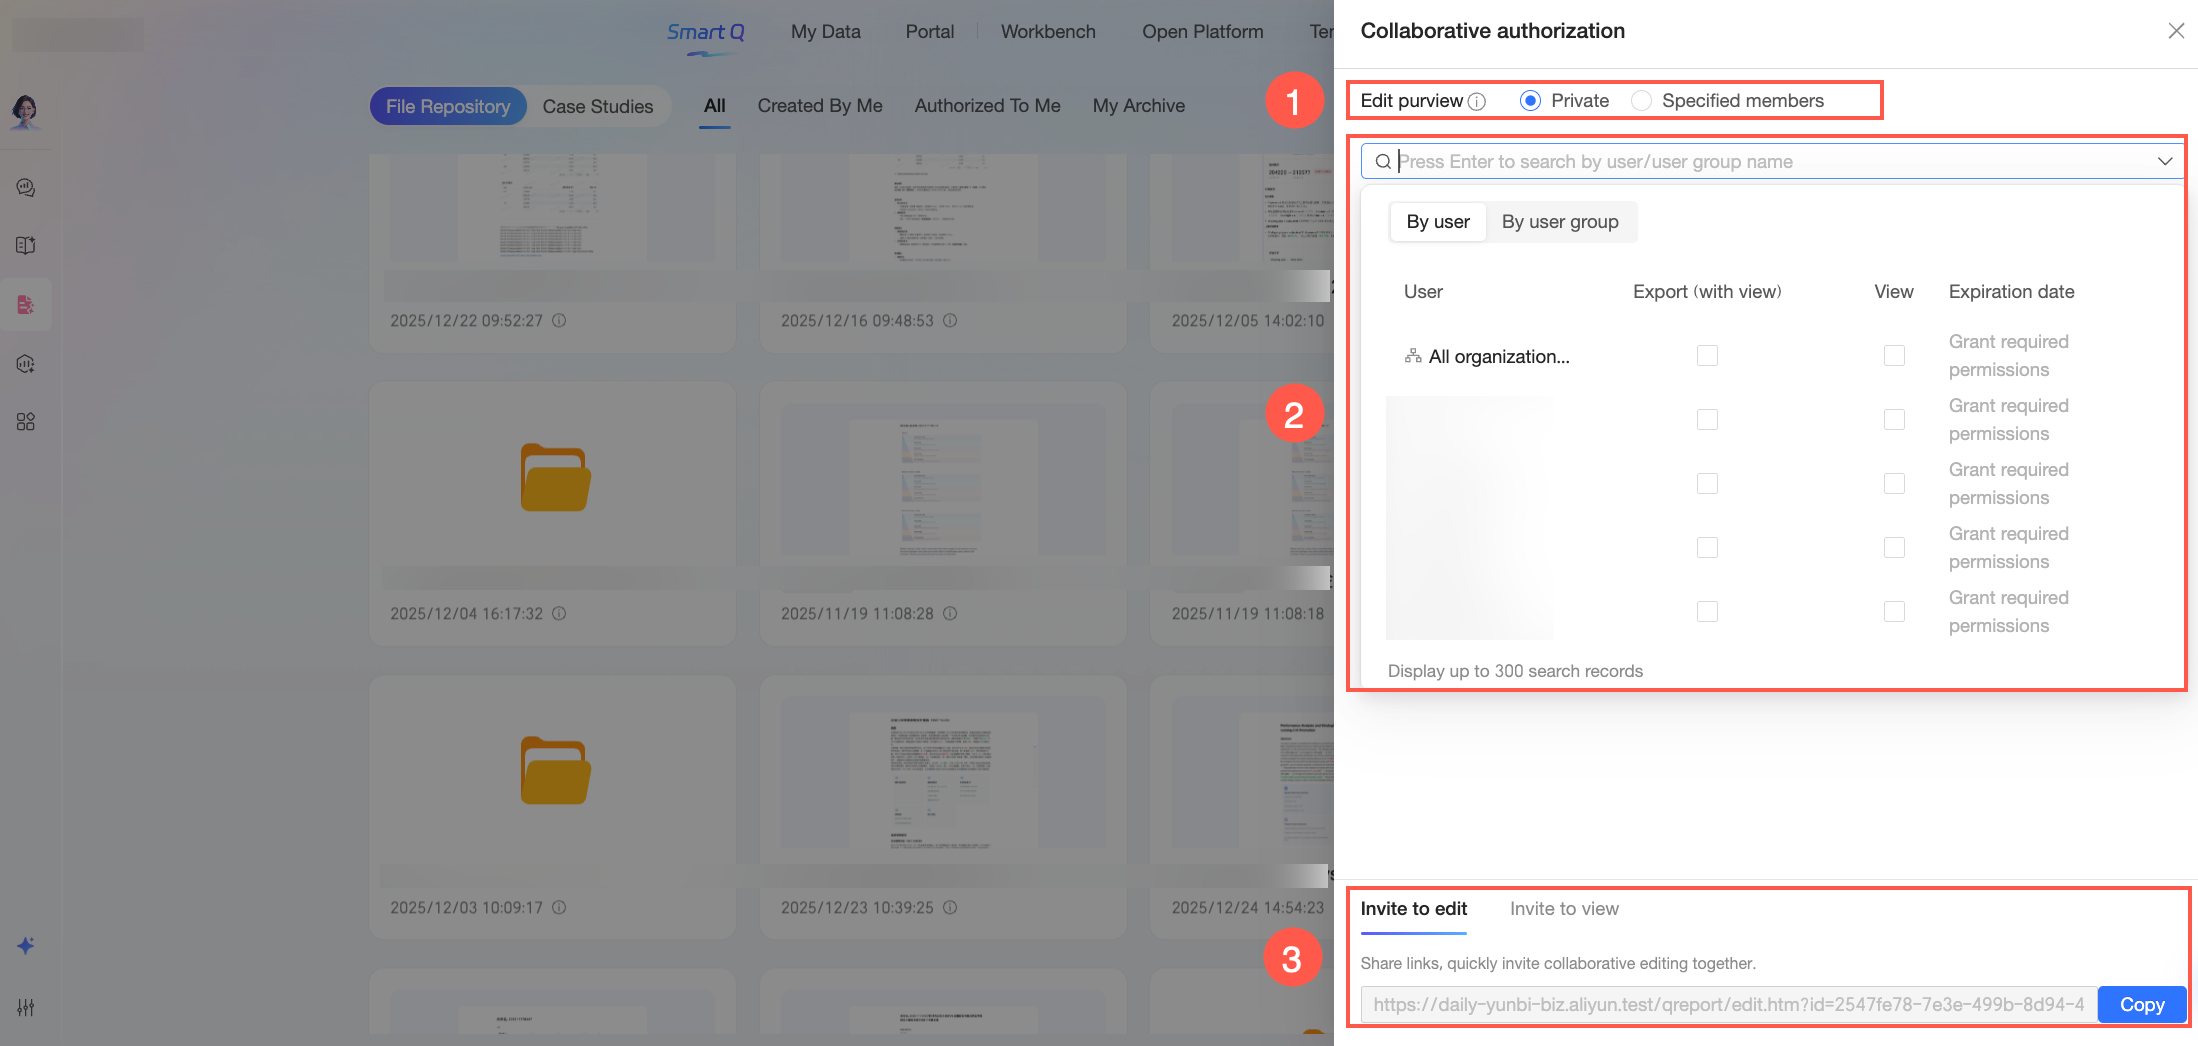
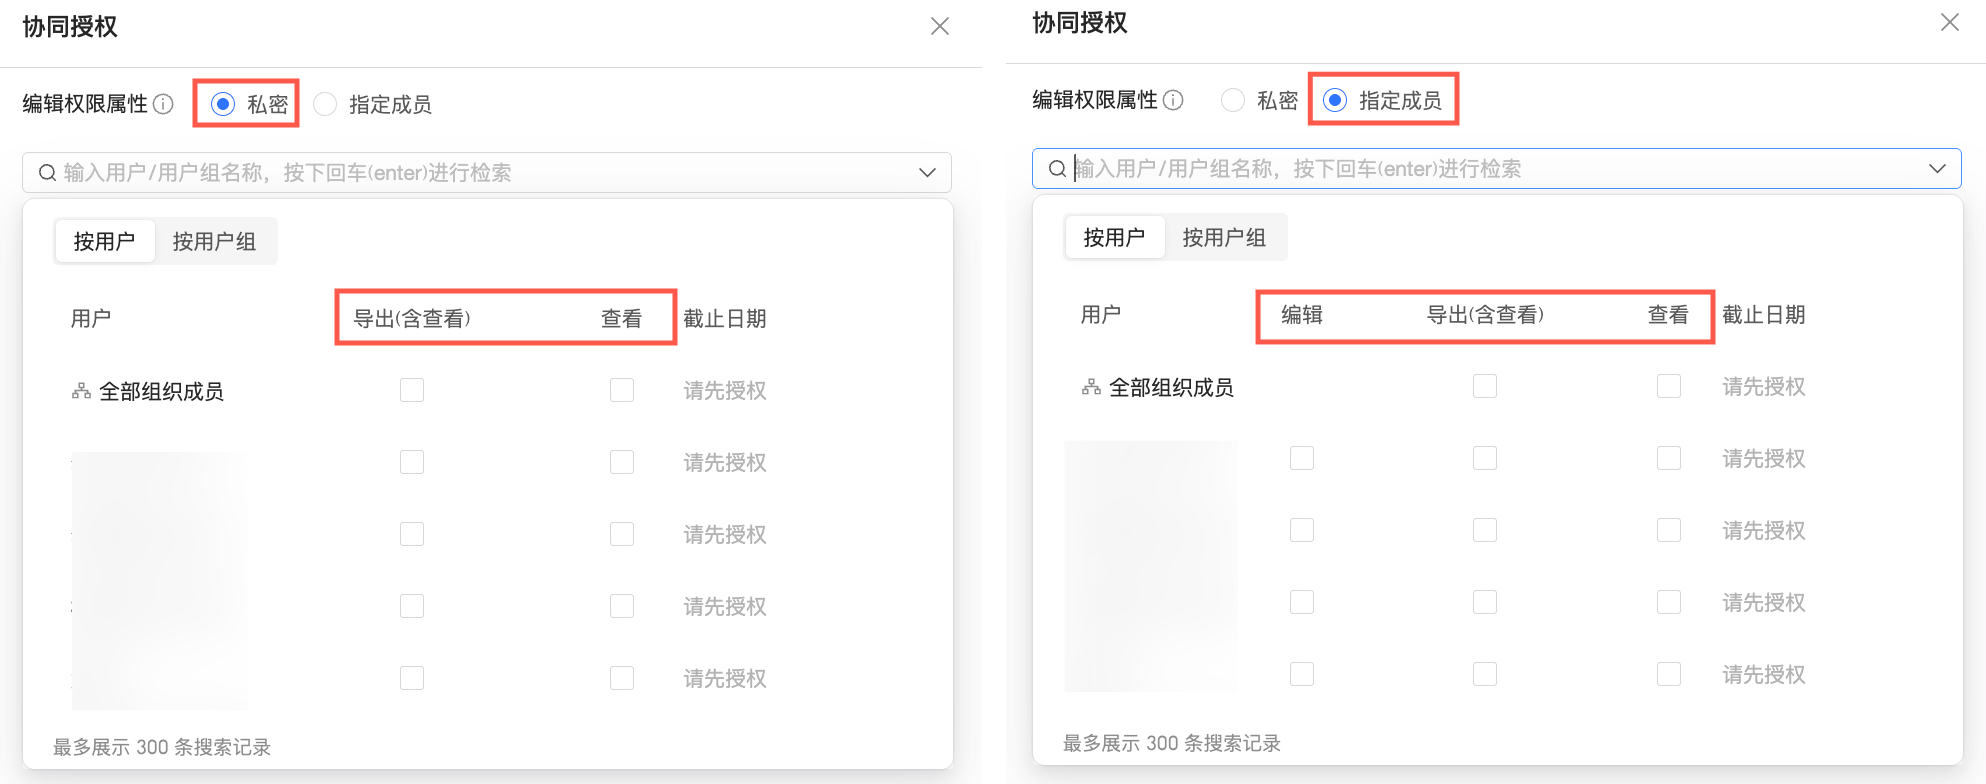
 ) icon next to a permission to change the user's permission type. In private mode, only the report creator can have edit permission. To grant edit permission to specific members, you must switch to specific members mode.
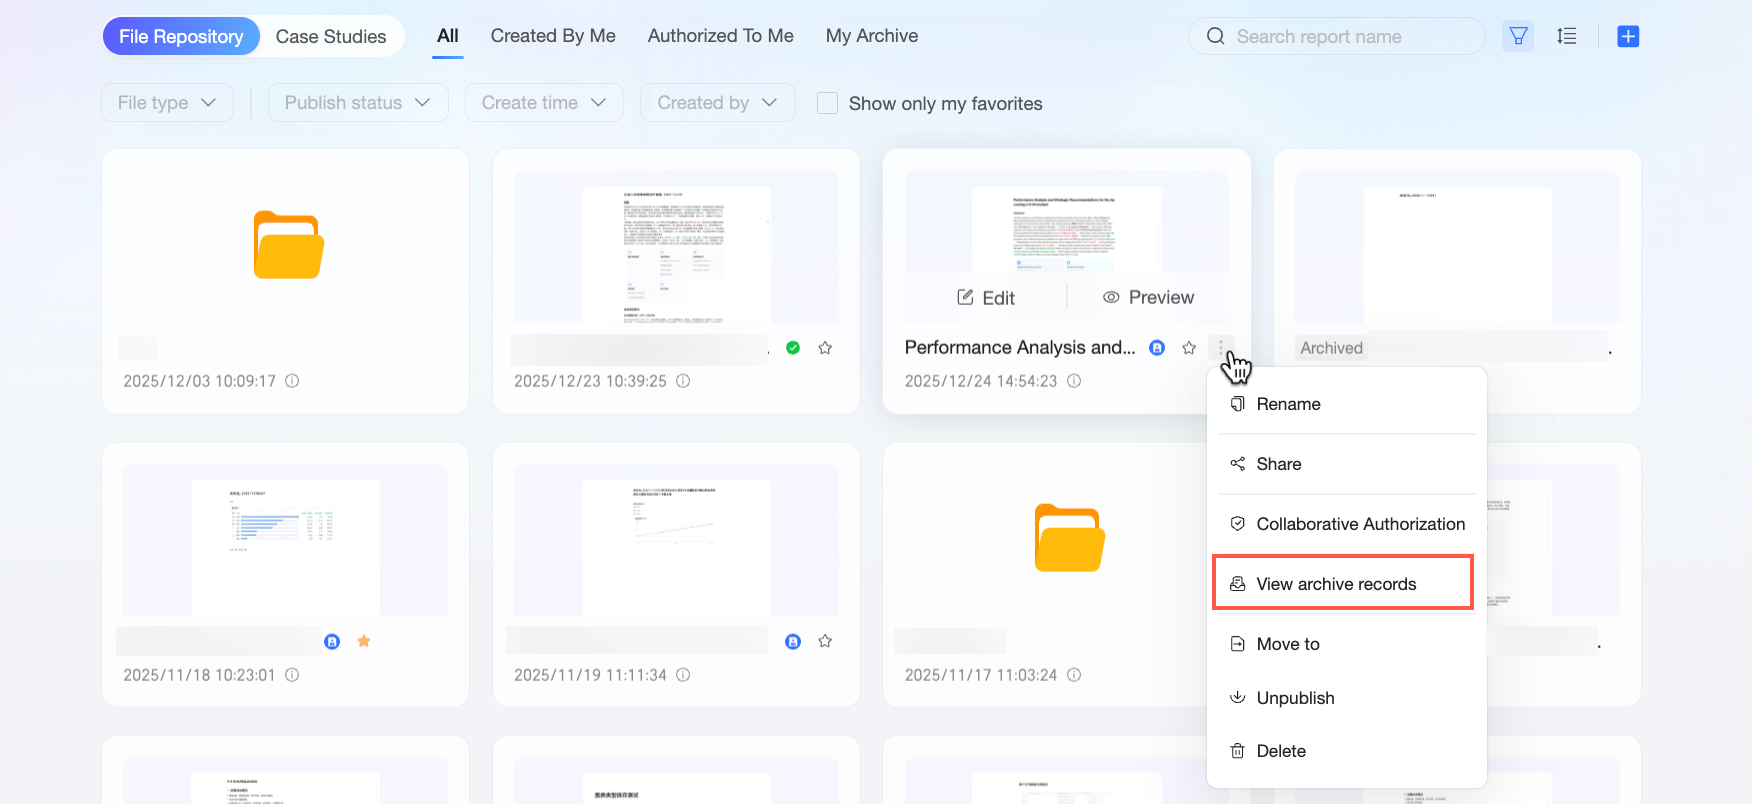
Folder Operations
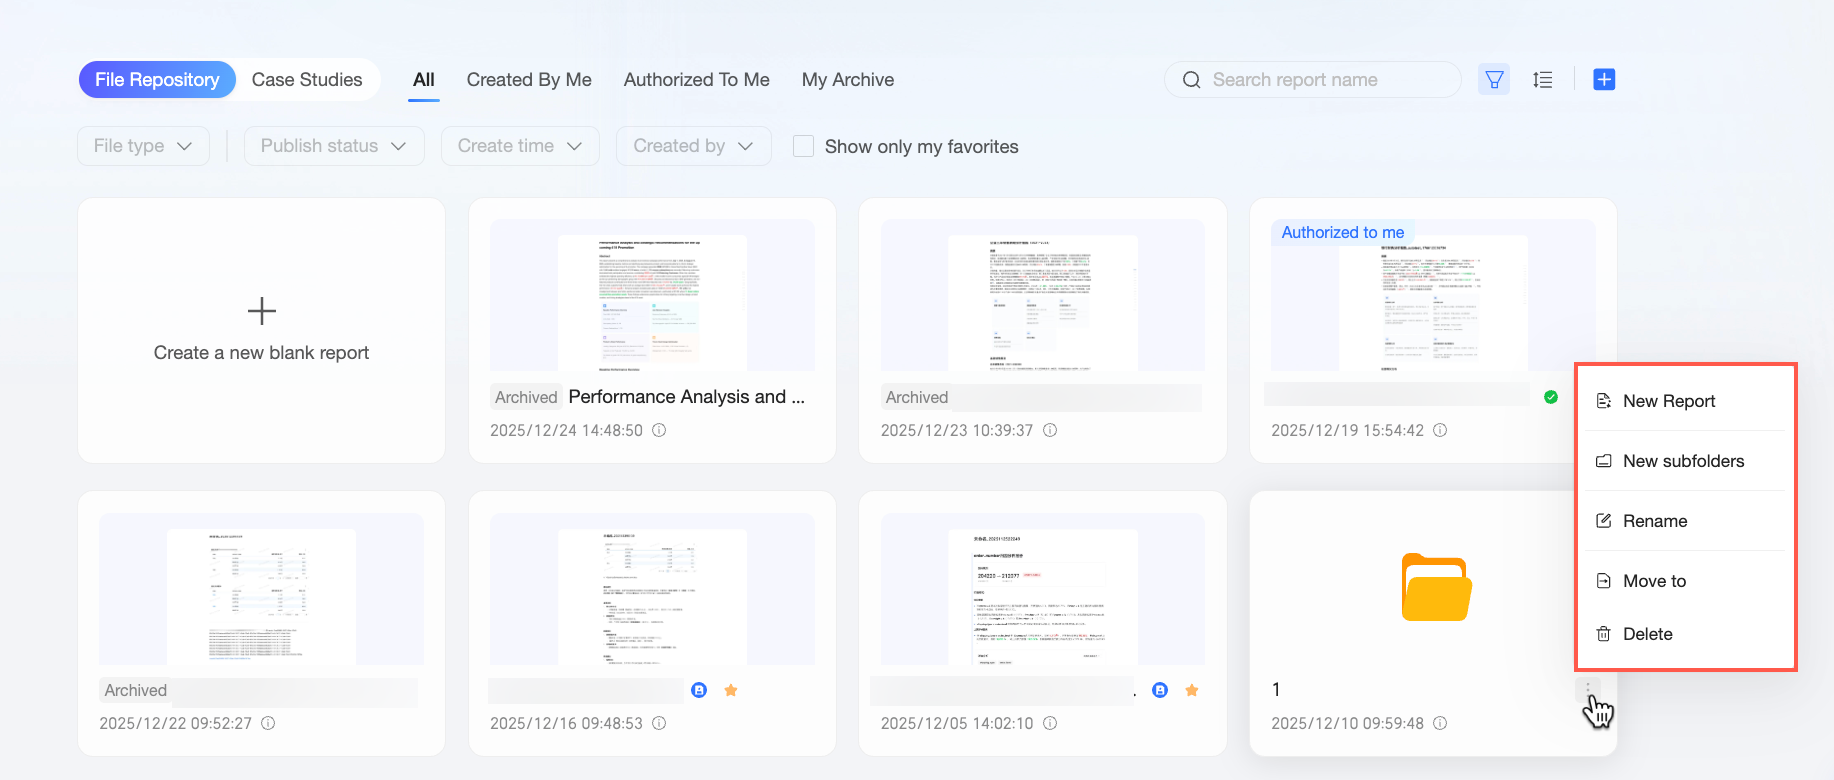
On the Quick BI report list page, click the ![]() icon on the right side of a folder card to perform the following operations:
icon on the right side of a folder card to perform the following operations:
Folder cards are displayed only when keep folder structure is selected in the sort settings. If you cannot see the folder cards, make sure that keep folder structure is selected in the sort by options.
|
Actions |
Description |
|
Create report |
Creates a blank report. For more information, see Edit a Quick BI report. |
|
Create subfolder |
Creates a subfolder in the current folder. Note
A directory structure can be up to five levels deep. |
|
Rename |
Renames the folder. |
|
Move to |
Moves the folder to the root directory or another folder.
|
|
Delete |
Deletes the folder. Note
|
Report Subscription Task
Subscriptions automatically send reports as a screenshot, link, or data attachment to specified recipients on a schedule, keeping viewers informed about business dynamics without logging in to the platform.
-
Q-Report is an add-on module. You must purchase this add-on module to create a report subscription task.
-
Each organization can create up to 100 Q-Report subscription tasks.
-
Hover over the
icon in the top navigation bar and click Subscription Management under Enterprise Applications. -
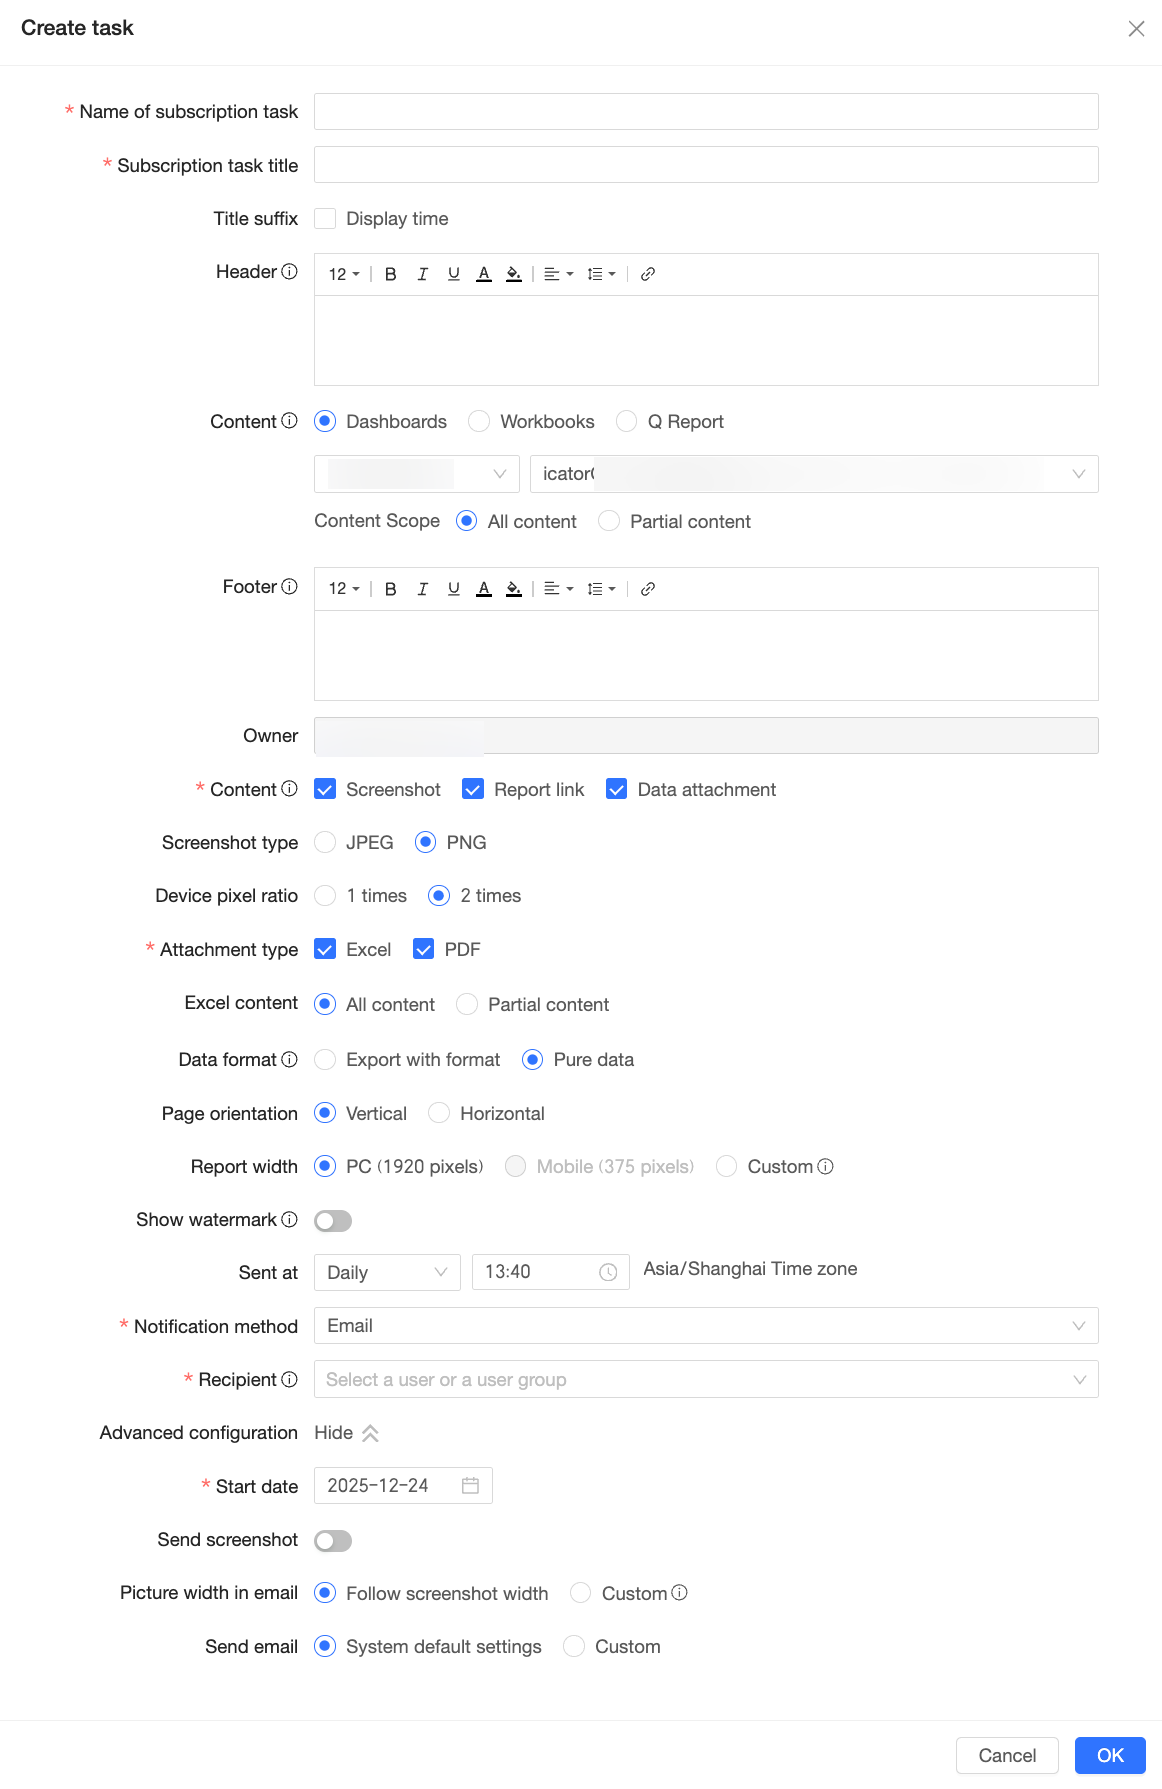
On the Subscription Management page, click New Subscription Task. In the New Task dialog box, configure the parameters. For a detailed description of each parameter, see Create a subscription task.
-
Click OK to create the subscription task.
NoteThe content of subscription notifications follows the report's configured data permission policy:
-
If dynamic data permission is enabled for the report, the system generates and sends the report based on the data permissions of the subscription task creator when the task runs. As a result, recipients see the subscription task creator's data view, not their own.
For example, if Member A creates a daily subscription task that runs at 8:00 AM, the system generates and sends the report at 8:00 AM based on Member A's data permissions.
-
If dynamic data permission is disabled, the report content is not adjusted based on the creator's permissions. Consequently, all recipients receive the same content.
-
 icon in the top navigation bar and click Subscription Management under Enterprise Applications.
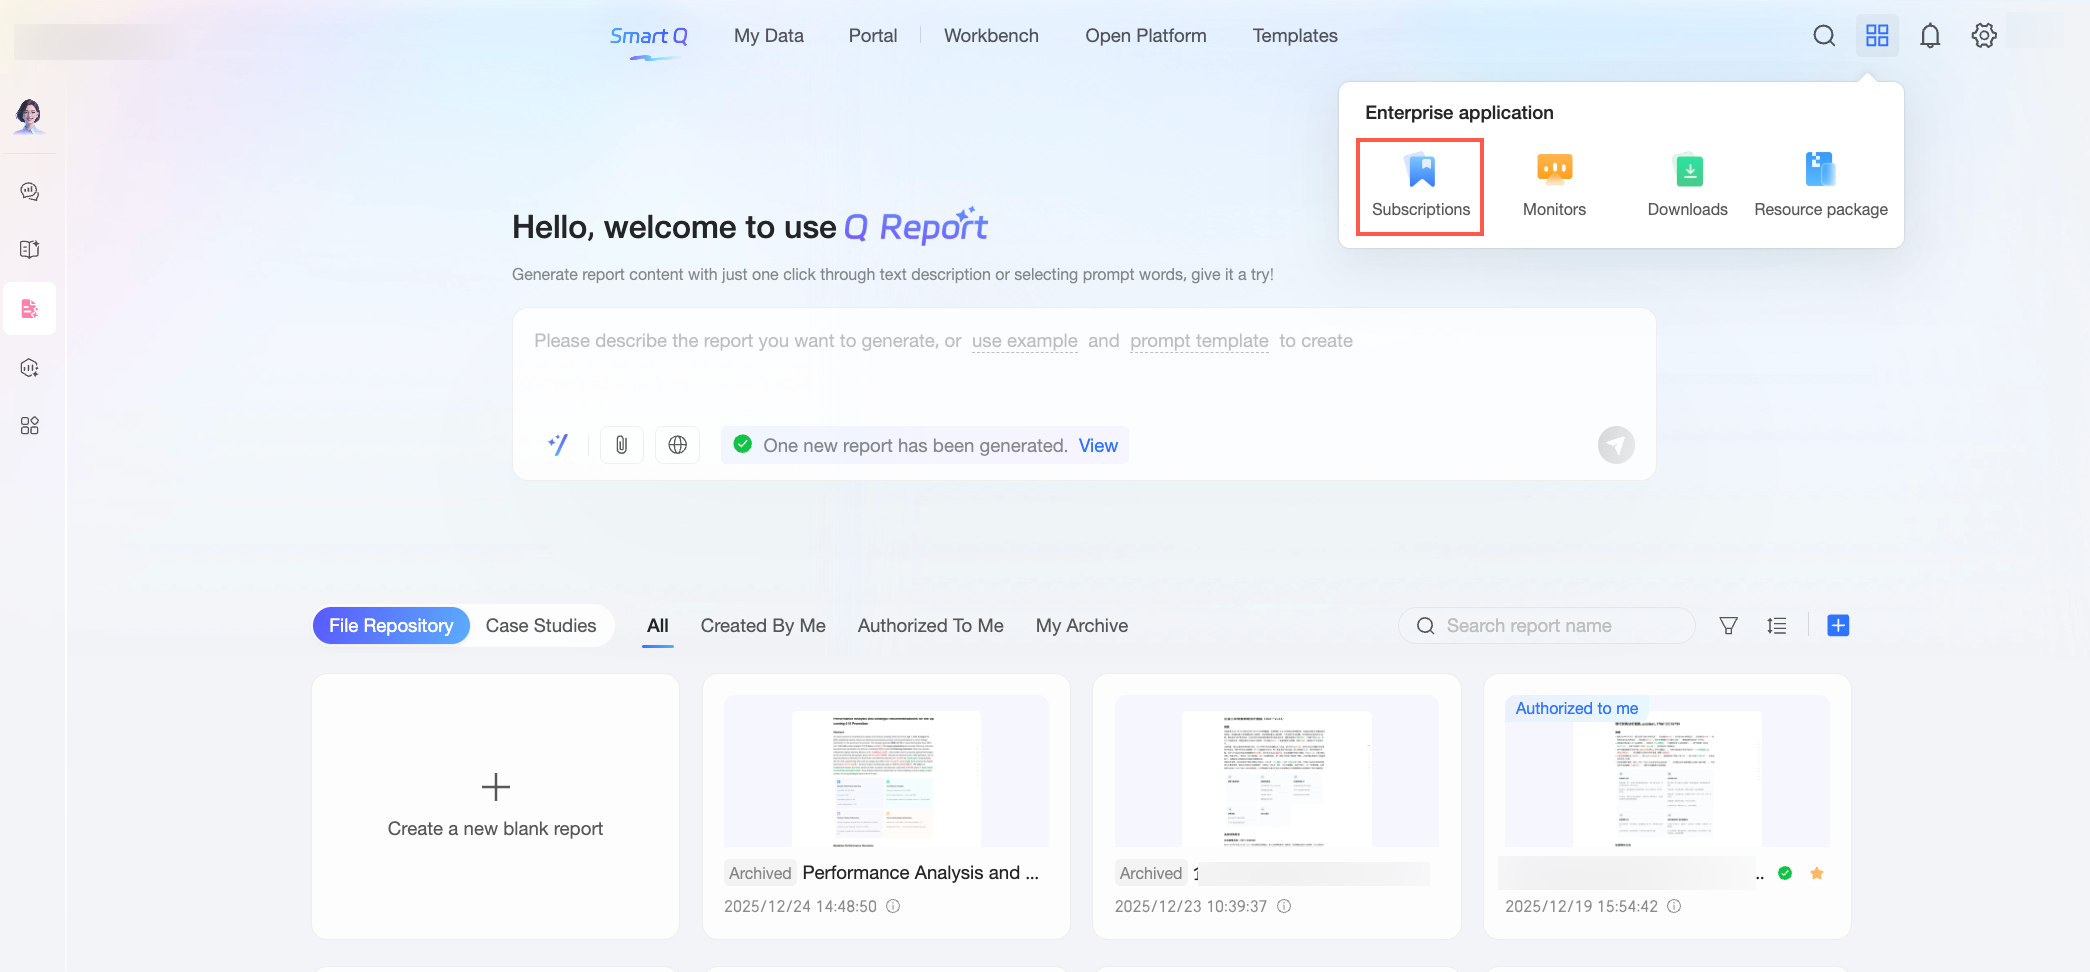
Report Access
By default, users can access Quick Q report features after an organization administrator adds them on the User Management page and assigns a Quick Q report seat. This access applies to all user types, including developer, analyst, and visitor. Organizations can restrict this feature for specific members by configuring Quick Q report access in a custom role and controlling access through role assignment.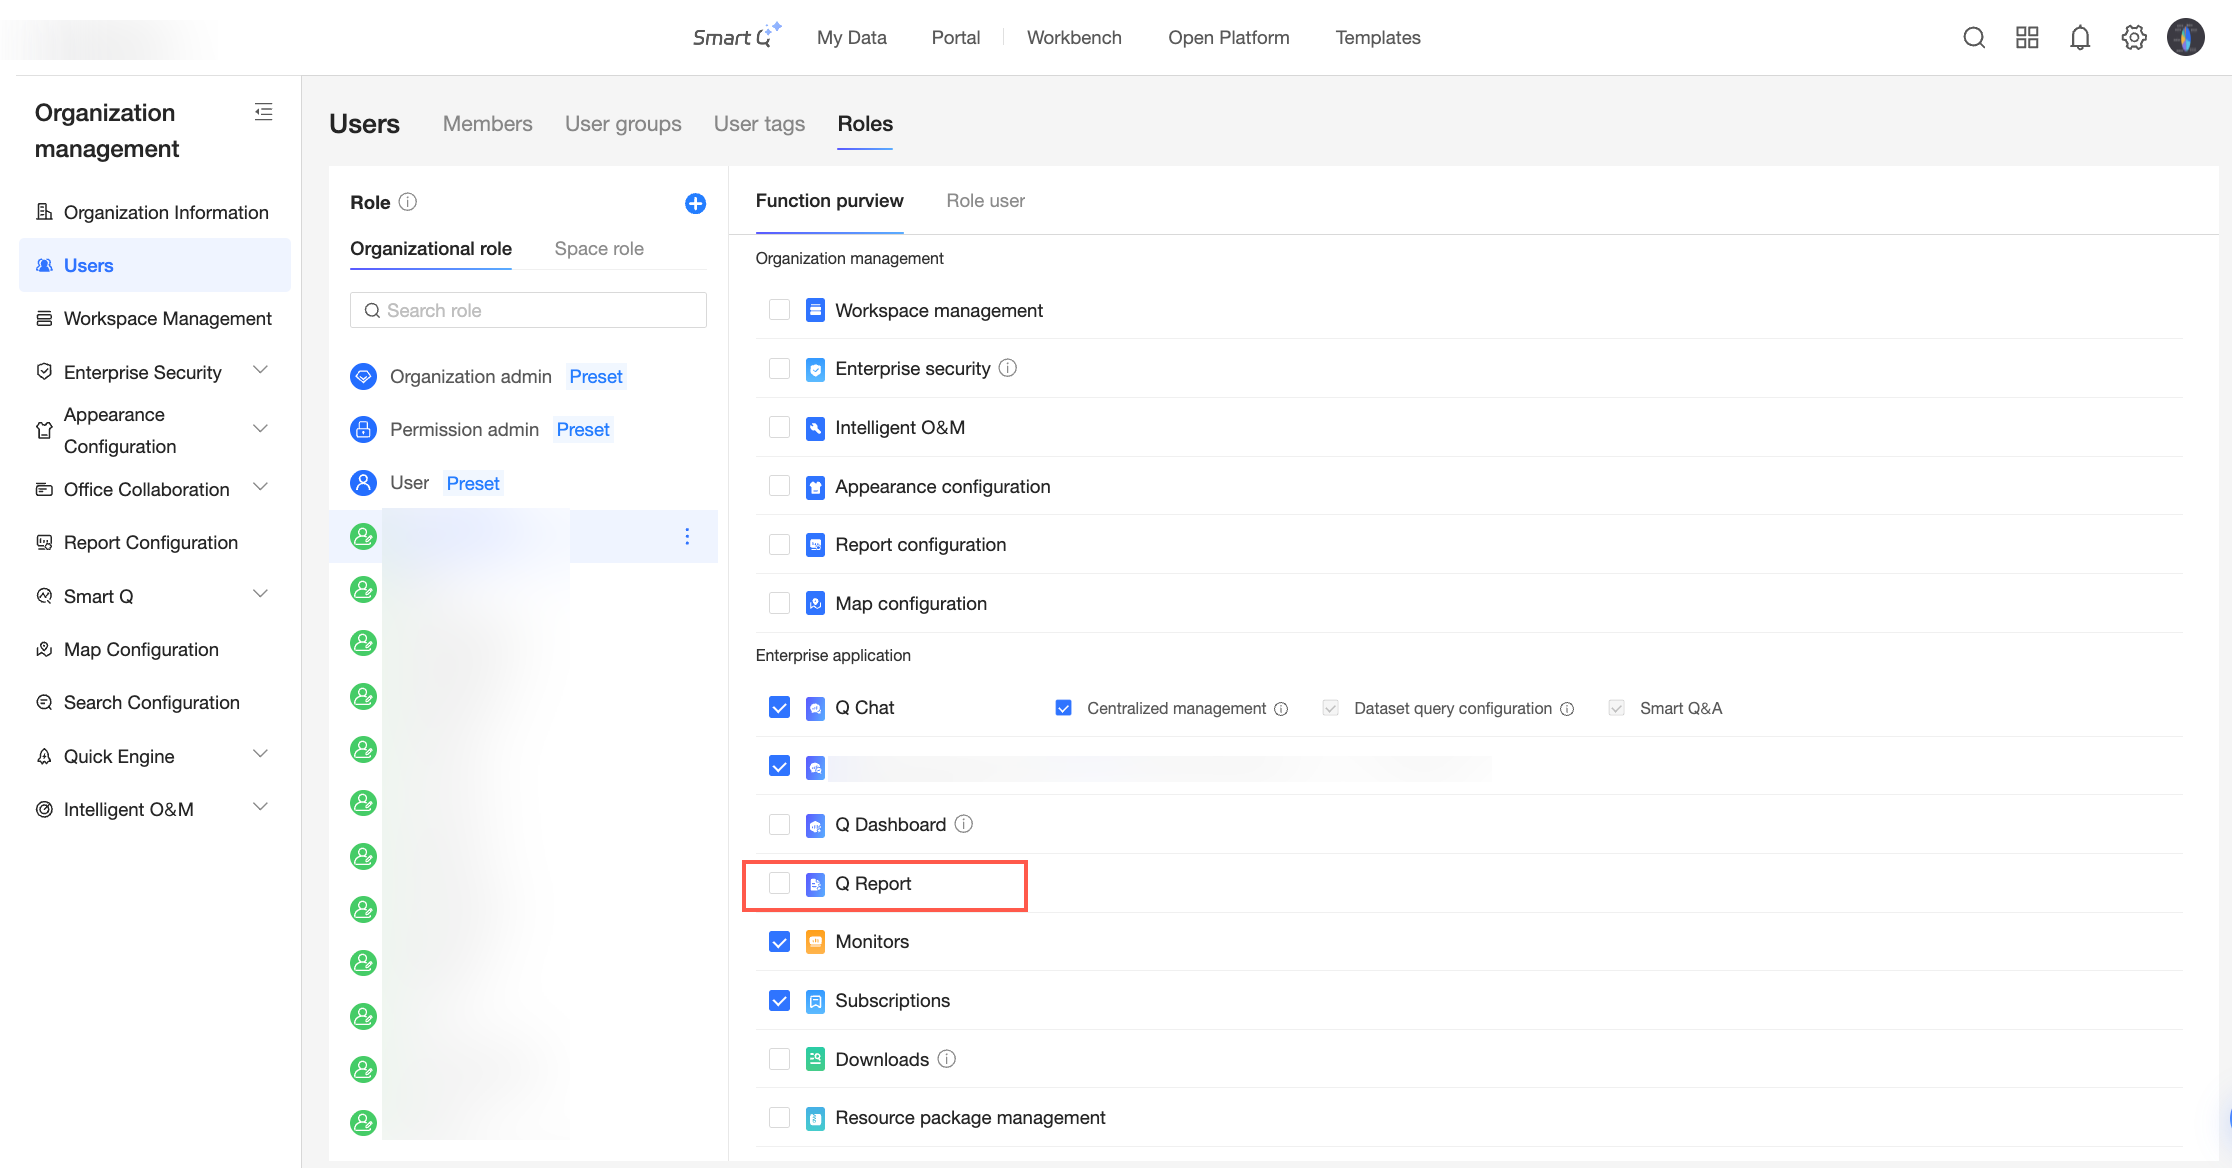
Clearing the Quick Q report checkbox for a custom role revokes access to Quick Q report features for any user assigned that role. For detailed instructions, see Manage roles.