The Xiao Q Report feature, powered by intelligent analysis agent technology, transforms the traditionally cumbersome and time-consuming process of report creation. It replaces manual tasks, such as searching for data, performing analysis, and compiling screenshots, with an intelligent process that automates data retrieval, generates insights, and dynamically integrates data.
Whether you need to create recurring reports, such as weekly or monthly summaries, or quickly generate a business analysis report to support decision-making, Xiao Q Report helps you upgrade from manual data analysis to intelligent, data-driven decision-making. This topic describes Xiao Q Report in detail.
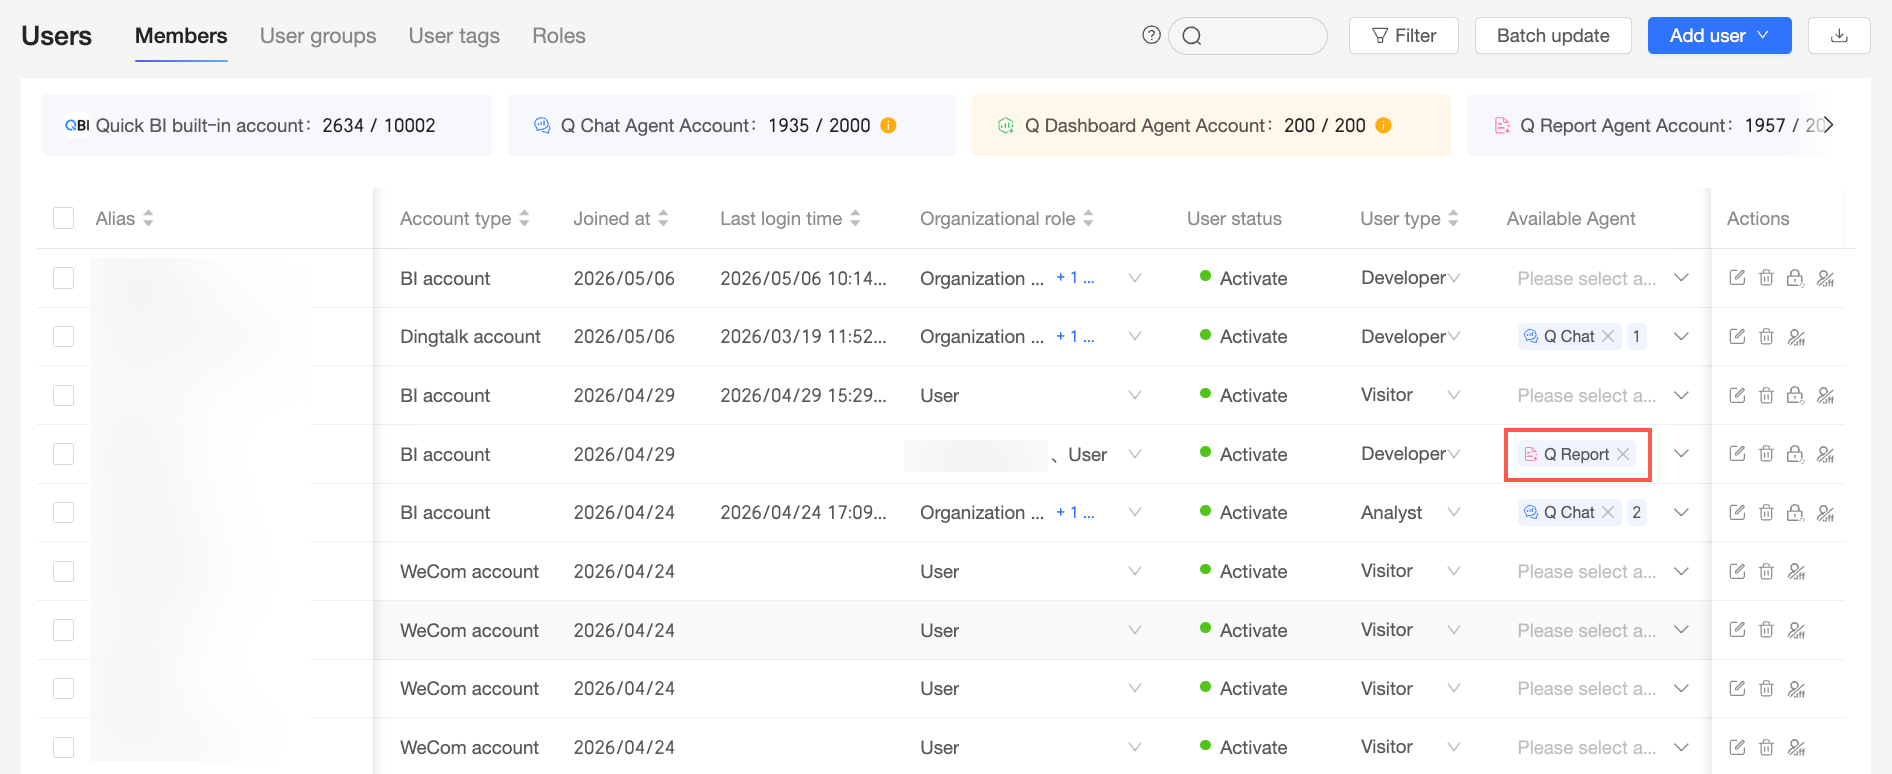
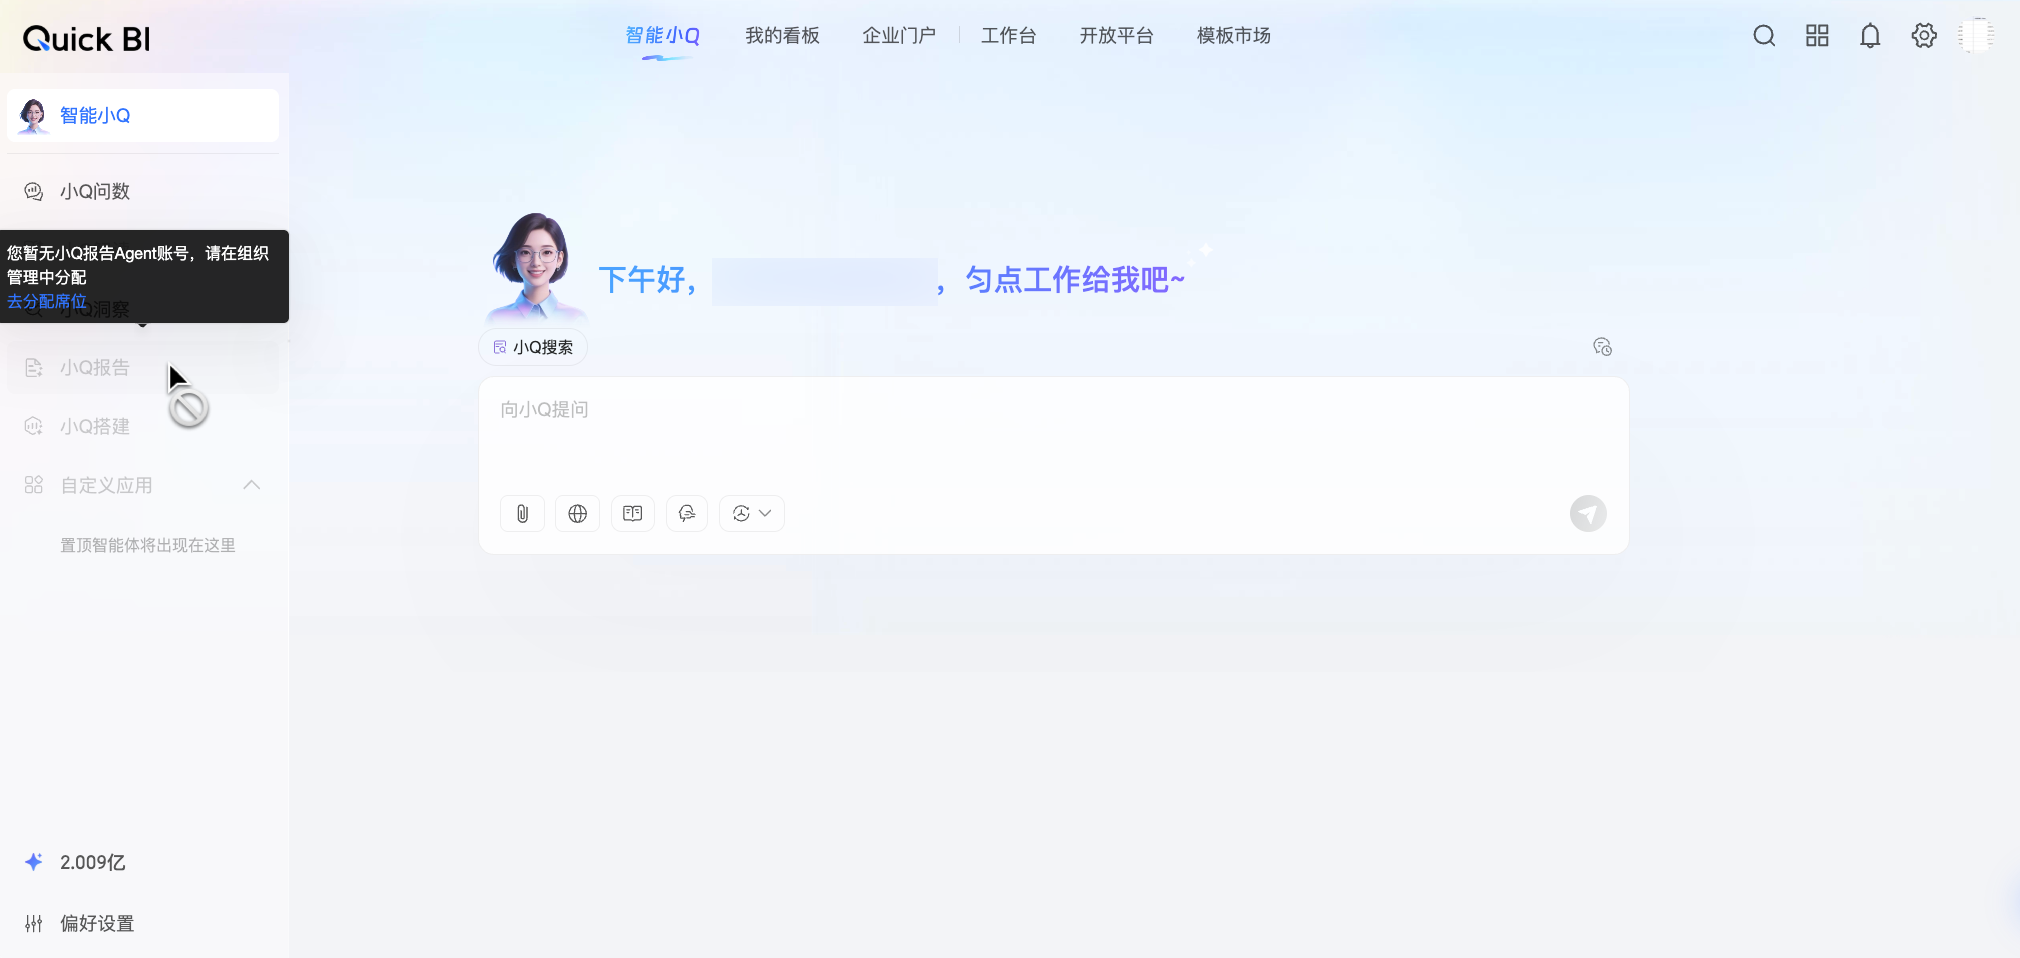
Xiao Q Report is a value-added module that requires a separate purchase. After purchase, an organization administrator can go to the member management page to assign usage seats to organization members as needed. Members without an assigned seat cannot use the Xiao Q Report feature. For detailed instructions, see Manage organization users.
The Xiao Q Report feature is available only in the Advanced Edition and Professional Edition. The Personal Edition is not supported.
Use cases
With capabilities like intelligent content generation and the combination of static content with dynamic metrics, Xiao Q Report significantly reduces manual workload and ensures timely information. It supports diverse business scenarios, such as tracking marketing campaign performance, conducting in-depth analyses of specific business topics, reporting on customer visits, and monitoring product quality.
Scenario 1: Marketing campaigns
Description: A campaign manager plans a 618 promotion and needs to review the results and performance data from the previous quarter's campaign to create the new plan.
Comparison: The following table compares the traditional approach with the Xiao Q Report approach for this scenario.
Traditional approach
Intelligent approach
Traditional marketing report creation requires manually finding data, performing analysis, and compiling screenshots. This process is labor-intensive, time-consuming, and prone to human error.
Manual data collection: Manually extract data from multiple systems (like a CRM system) or worksheets to gather information on user behavior, sales data, and time-based trends.
Manual analysis and screenshots: Calculate metrics like conversion rates and average daily sales using formulas, create charts, and then paste screenshots into a document.
Manual analysis and summary: Write analysis conclusions and strategic recommendations based on the data.
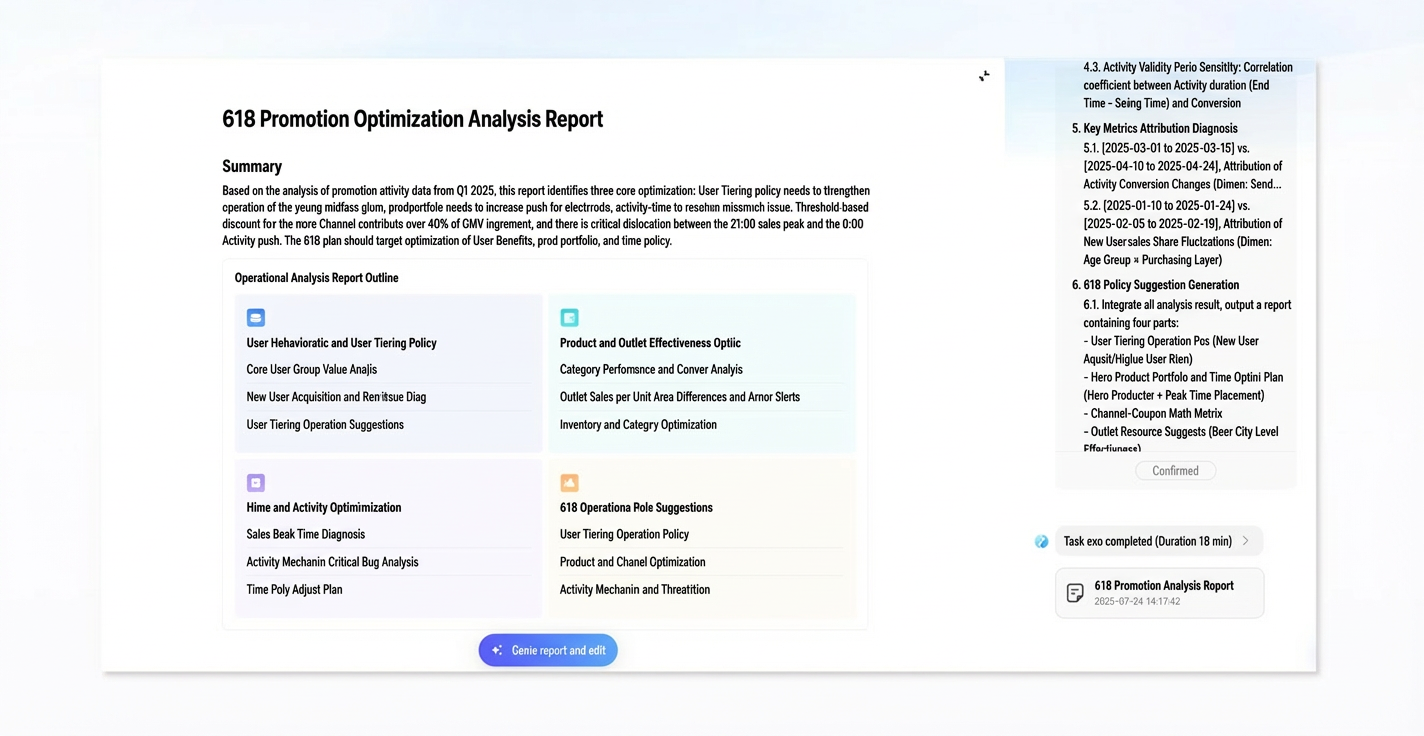
Xiao Q Report can generate a report quickly with a simple command.
Automated data retrieval: Automatically extracts and integrates relevant data from provided data resources based on the analysis plan.
Embedded visualizations: Xiao Q Report automatically generates suitable charts based on the analysis requirements and data. You can also directly embed charts created in Quick BI into the report.
Intelligent content generation: Automatically generates structured content and analytical insights based on the analysis results.
Scenario 2: Business analysis
Description: A financial analyst at a company needs to create a monthly business analysis report. This report is used in monthly meetings to support business and financial decisions by providing deep, data-backed insights. It helps decision-makers quickly grasp key financial issues without sifting through lengthy documents.
Comparison: The following table compares the traditional approach with the Xiao Q Report approach for this scenario.
Traditional approach
Intelligent approach
The traditional process for creating business reports is long and can result in outdated information and insufficient data insights.
Long creation cycle: Recreating reports with the latest data each month involves many repetitive and time-consuming steps. This long cycle means decision-makers lack real-time, dynamic data support.
Difficulty in integrating data with business knowledge: Key information, such as company operational data and internal business knowledge, is fragmented and lacks an effective integration mechanism. This leads to a disconnect between data analysis and internal business knowledge, making it difficult for reports to reflect comprehensive business dynamics.
Limited analytical depth: The analysis only lists data and does not connect it to business scenarios. This disconnects analysis from decision-making.
Xiao Q Report combines static content with dynamic metrics. It can automatically fetch metric data to generate a dynamic report based on a fixed monthly template.
Dynamic data updates: Fetches data dynamically based on a fixed report structure, eliminating the tedious process from data collection to content creation and significantly reducing the report creation time.
Intelligent data and knowledge linking: Upload internal business knowledge as local files, such as Word documents, and combine them with existing resources in Quick BI, such as datasets and reports. This deep integration of data and knowledge produces analysis reports that are tailored to your company's business context and management logic.
Intelligent in-depth insights: Uses large model inference capability and multiple algorithms to generate intelligent insights about data performance and recommend response strategies.
Scenario 3: Customer visits
Description: A sales representative needs to create a visit report before meeting a client to review key information such as the client's status and partnership history. This helps them develop more effective visit strategies and build stronger client relationships.
Comparison: The following table compares the traditional approach with the Xiao Q Report approach for this scenario.
Traditional approach
Intelligent approach
Traditional customer visit preparation involves collecting client information and checking historical partnership data. This process is highly dependent on manual effort and is subject to information limitations.
Time-consuming data collection and integration: Customer data is spread across different systems (like a CRM system or ERP system) and must be manually collected and integrated, a time-consuming process.
Limited information integration: It is difficult to systematically combine information from multiple sources, such as the client's recent activities and industry trends, leading to a lack of a holistic view and deep correlation analysis.
Analysis depends on personal experience: The quality of the analysis relies on the sales representative's personal experience and judgment, which can be limited and may result in a superficial analysis.
Xiao Q Report can quickly generate a visit report with a single click, using its internet search capability to effectively integrate internal and external information resources.
Automated data retrieval: Automatically retrieves data based on analysis plans from existing customer data reports in Quick BI, eliminating manual data assembly and significantly reducing preparation time.
Supports internet search: Integrates external information retrieval to automatically fetch public data like the client's latest news, industry policies, and market sentiment. It then merges this with internal data, effectively combining internal and external information.
Intelligent data analysis: Uses the analytical power of large models to provide intelligent insights into customer behavior and partnership history. This helps formulate effective customer visit strategies and improve relationship management.
Features
Xiao Q Report is a decision-support tool that combines intelligent content generation with document editing capabilities. It is designed to improve the efficiency and quality of writing, analyzing, and sharing data reports across various business scenarios. With capabilities like intelligent analysis planning, automated data retrieval, insight analysis, visualization, and document authoring, Xiao Q Report transforms raw business data and static visual reports into shareable, actionable assets for decision-making. This creates an efficient cycle from data insights to business action.
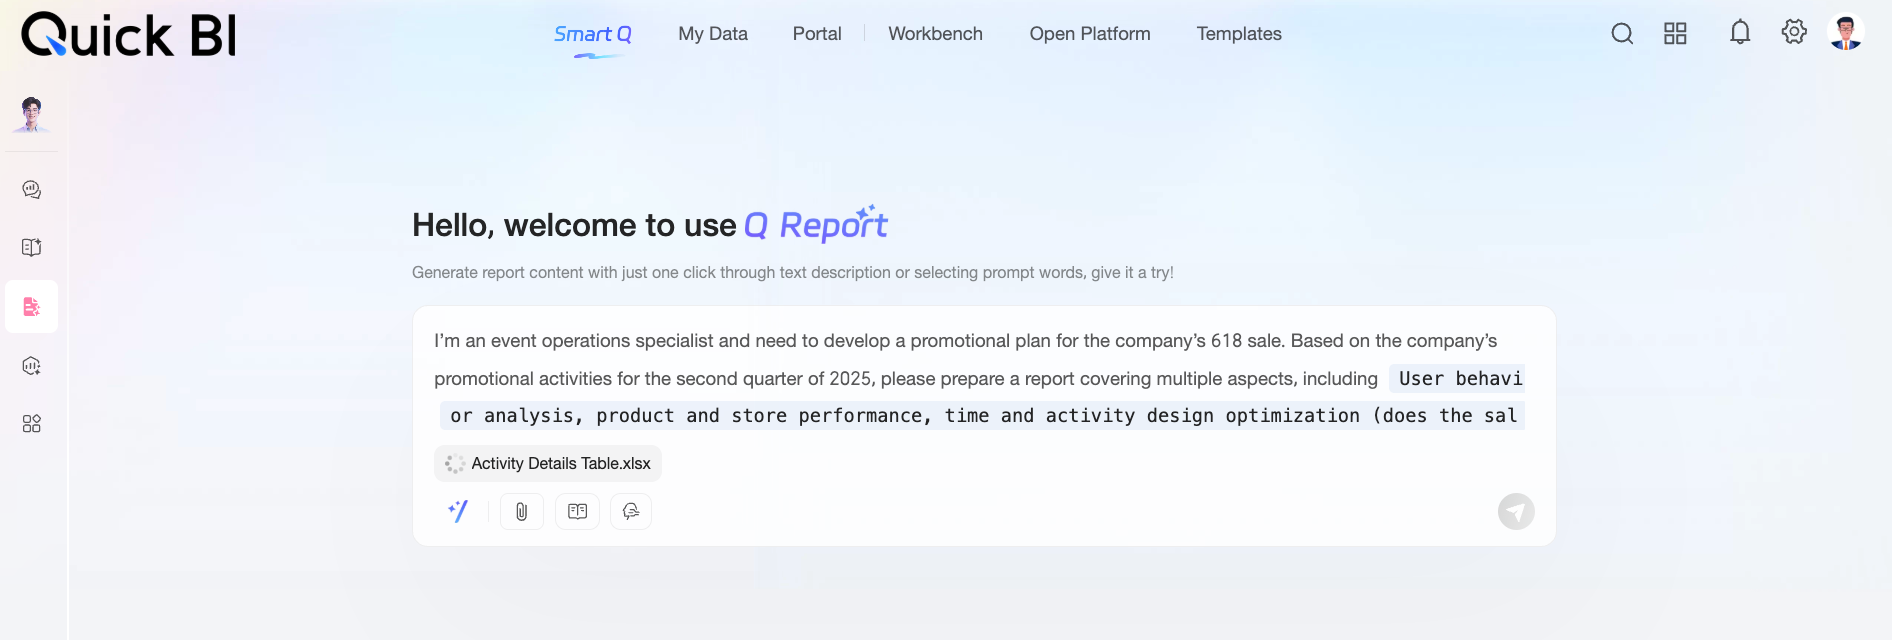
Intelligent content generation: Generate a report with one click
Simply enter a prompt based on your analysis needs, and the system automatically completes the entire report generation process, from intelligent analysis logic construction and automated data retrieval and insights to content narrative integration. This helps you easily obtain a well-structured Xiao Q Report with a professional analytical framework.
Intelligent analysis logic construction: Based on the large model inference capability from models like DeepSeek, the system quickly analyzes your prompt to create a data analysis logic tailored to your industry and analysis requirements.
Automated data retrieval and insights: Based on the confirmed data analysis plan, the system retrieves and interprets the required data, then automatically generates clear visual charts and provides insights and recommendations based on the data.
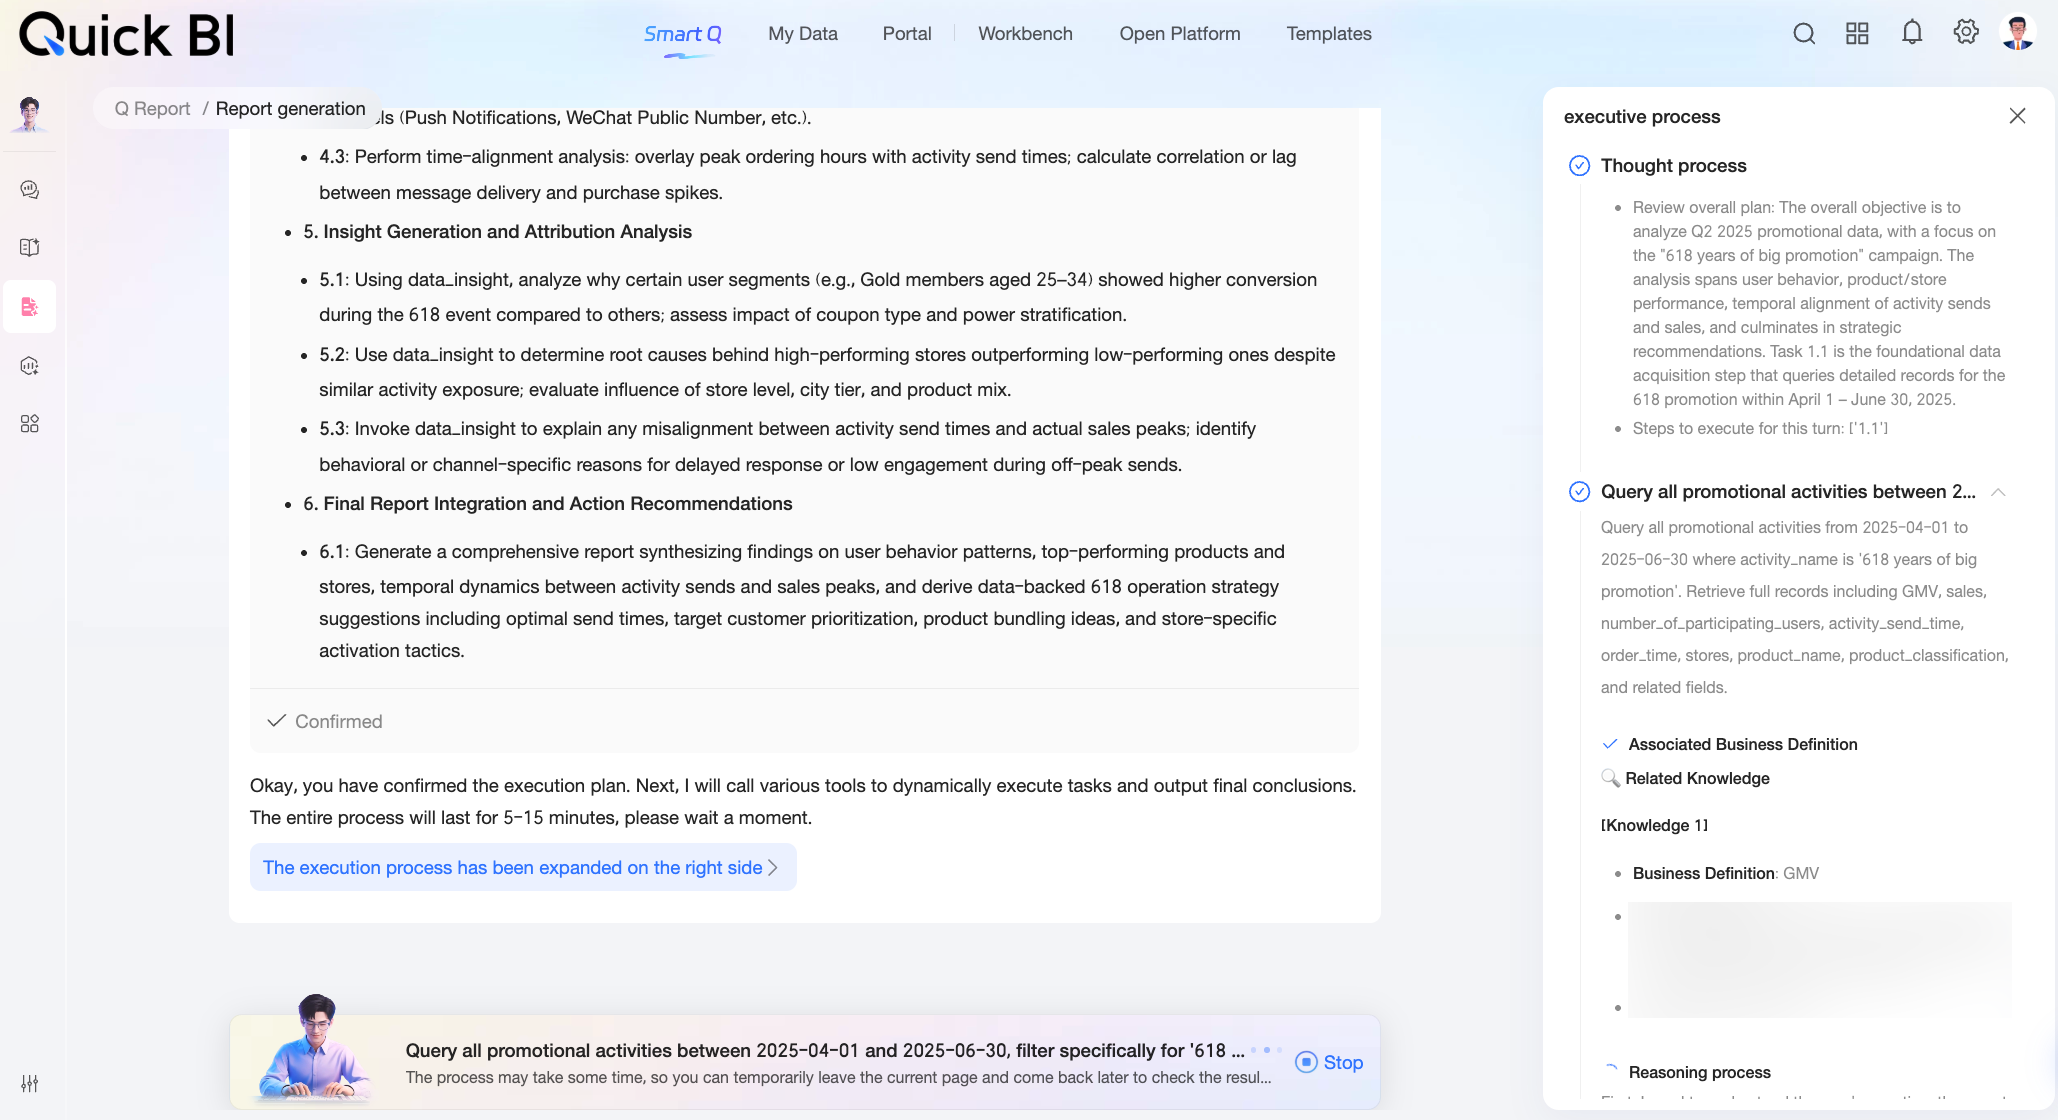
Content narrative integration: It weaves the intelligently generated data interpretations and visual charts into a contextual narrative, forming a structured, intelligent report.
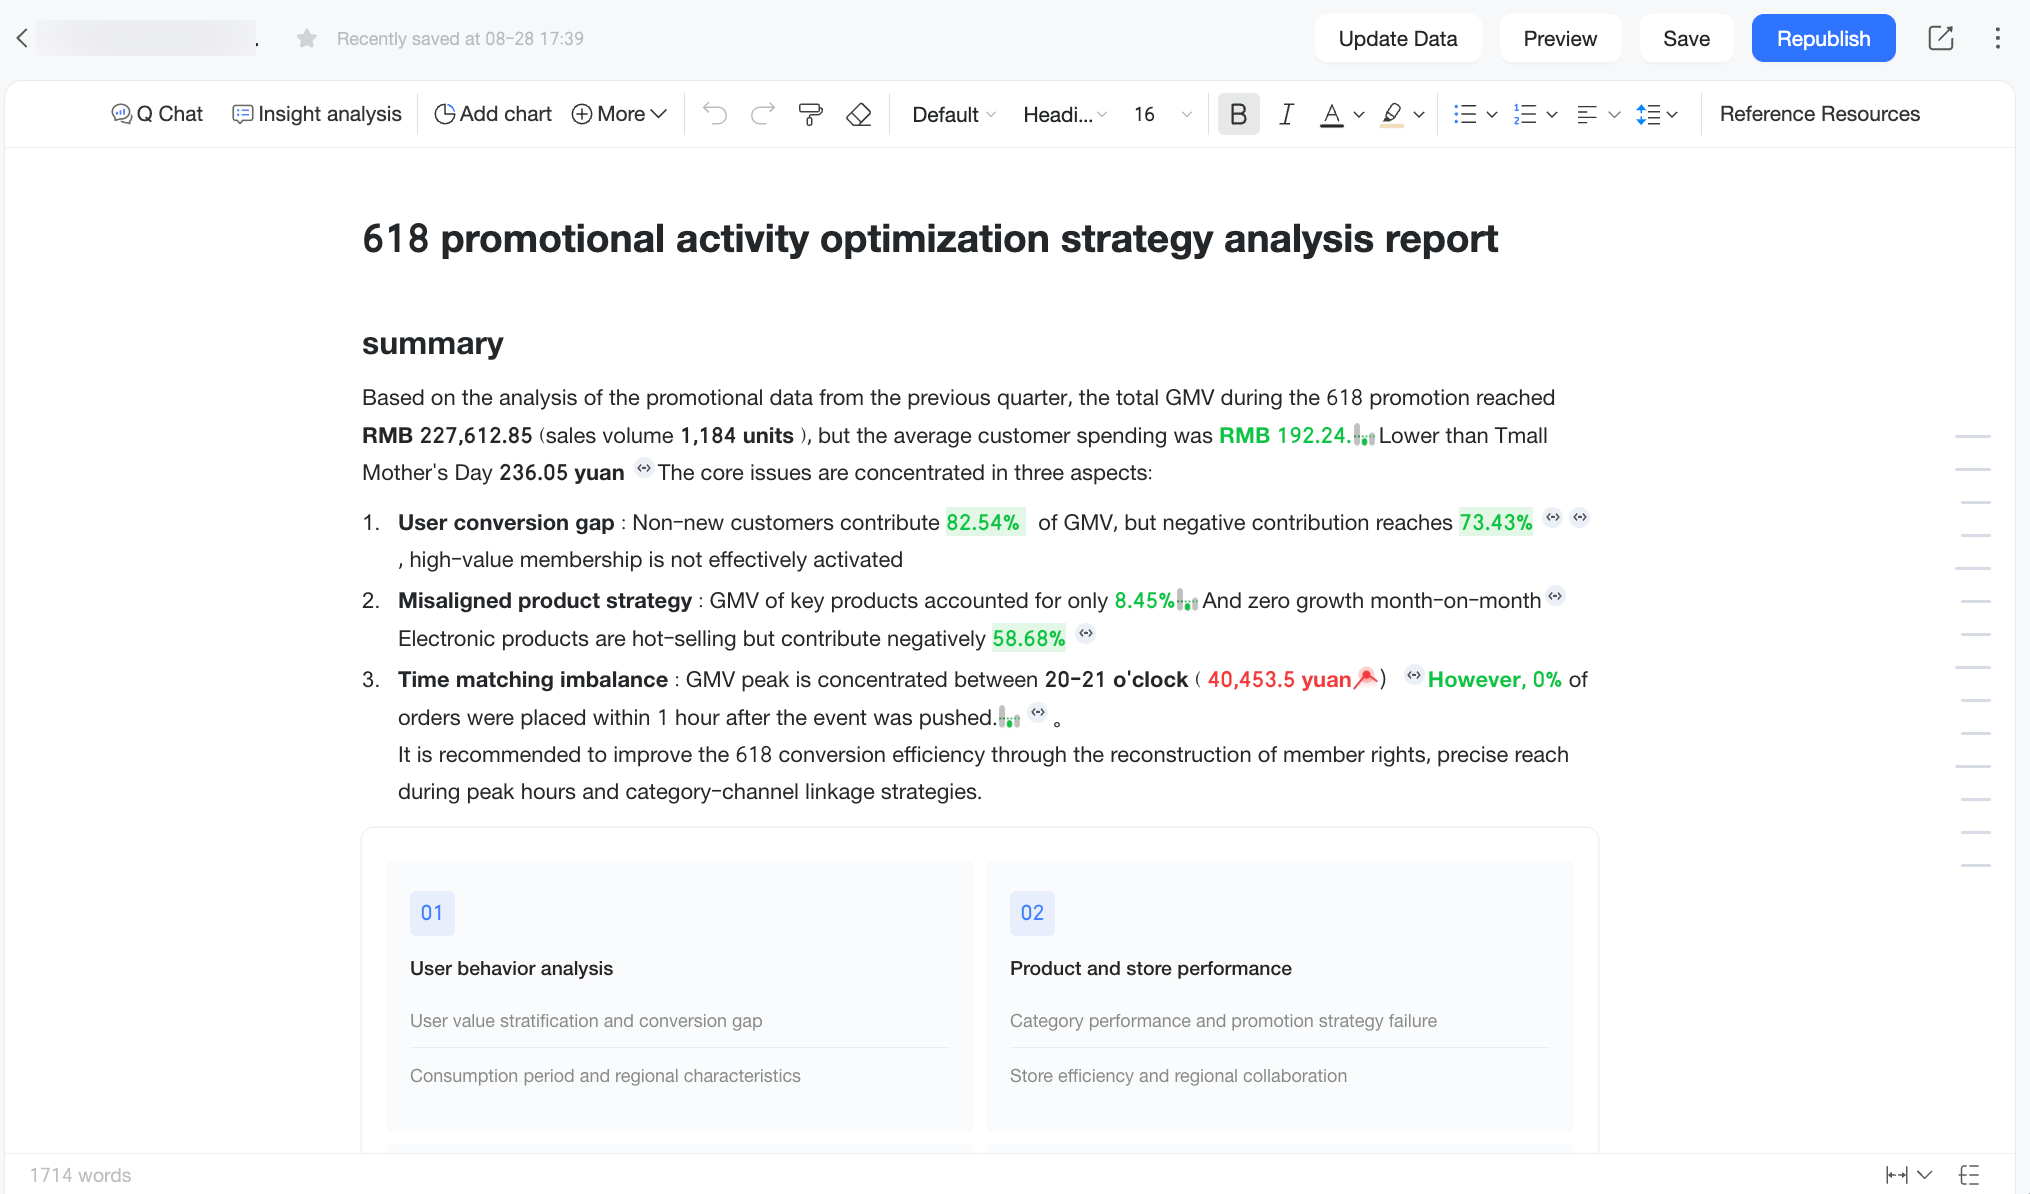
Document editing capabilities: Flexibly edit report content
After the report is generated, you can use the document editing features in Quick BI to flexibly edit the content. This ensures the report better suits your specific business scenarios and enterprise needs, giving report creators final control over the content while enjoying the benefits of intelligent efficiency.
On the editing page, you can adjust visual elements like page styles and text formats. You can also enrich the report by embedding more charts, adding an intelligent data query, or using the insight analysis feature for a deeper dive into a specific section of the report.
Procedure
The following table outlines the procedure for using Xiao Q Report and provides links to relevant documentation.
Step | Operation | Description |
1 | Create a new Xiao Q Report. You can choose a creation method based on your analysis needs:
| |
2 | After creating the report, you can adjust the content, text styles, and layout on the editing page. You can also directly embed an existing dashboard, data interpretation, or intelligent data query results into the Xiao Q Report. The editing page supports not only traditional text editing but also integrates intelligent data query, analysis, and chart embedding capabilities to help you efficiently complete the entire process from data integration to content presentation. | |
3 | After creating the report, you can share it with others, or go to the report list page to view, manage, and configure permissions for existing reports. |
Account permissions
The following table describes the account permissions required to perform various operations in Xiao Q Report.
Xiao Q Report is an organization-level feature. By default, any user within the organization who has a Xiao Q Report seat can use it. If your organization has specific access control needs and you want to restrict some members from using this feature, you can configure Xiao Q Report permissions in a custom role. By assigning this role, you can control which users can use the Xiao Q Report feature. For detailed instructions, see Report usage permissions.
Action | Permissions |
Create | All user types can create Xiao Q Reports. As long as an organization administrator adds a user through member management and assigns a usage seat, that user can create reports using the Xiao Q Report feature in Quick BI, regardless of whether their user type is developer, analyst, or viewer. |
Edit | By default, you can edit reports that you create. If you need to collaborate with team members to refine or maintain a report, you can grant editing permissions to specific members through collaborative authorization. |
View | By default, you can view reports that you create. You can also allow others to view your report using the Share feature. If you select Generate data results based on viewer's permissions when you save the report, the system dynamically queries and updates the data based on the current viewer's data permissions each time they open the report. For more information, see Save a report. |