On the metric monitoring page, you can query, rename, delete, and perform batch operations on monitoring metrics.
Prerequisites
You have configured monitoring and alerts. See Configure monitoring and alerts.
Role permissions
Permissions for metric monitoring vary by role as follows:
Users with permission to view reports can create metric monitoring and view monitoring created by others.
An organization administrator can view and manage (edit, delete) all metric monitoring in the organization.
An alert recipient can view the corresponding metric monitoring.
Metric Monitoring Center
Log on to the Quick BI console.
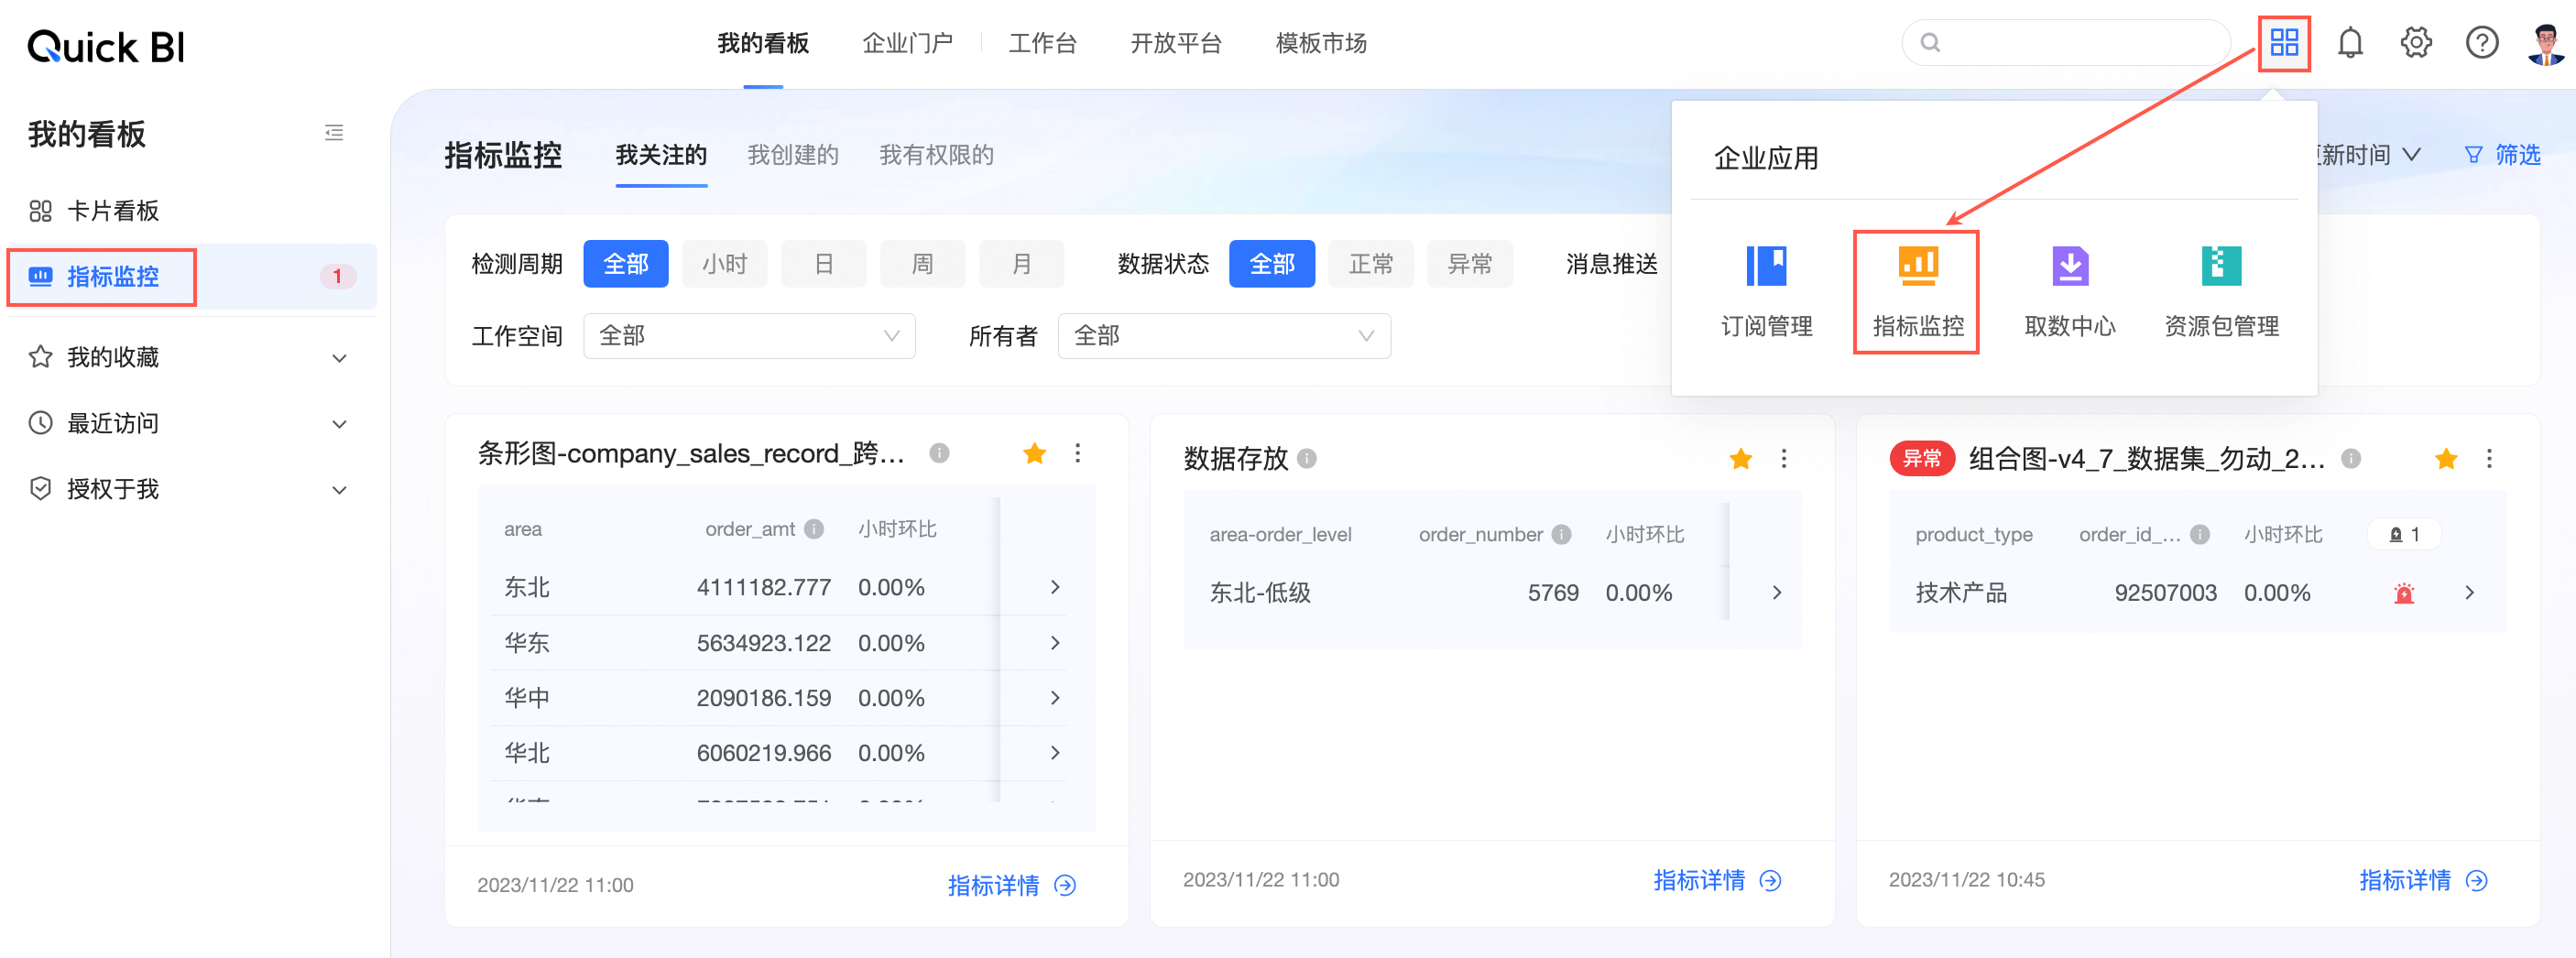
On the right side of the Quick BI top navigation bar, click in the Enterprise Applications section, or on the My Dashboards page.
The Metric Monitoring Center appears.
Search metric monitoring
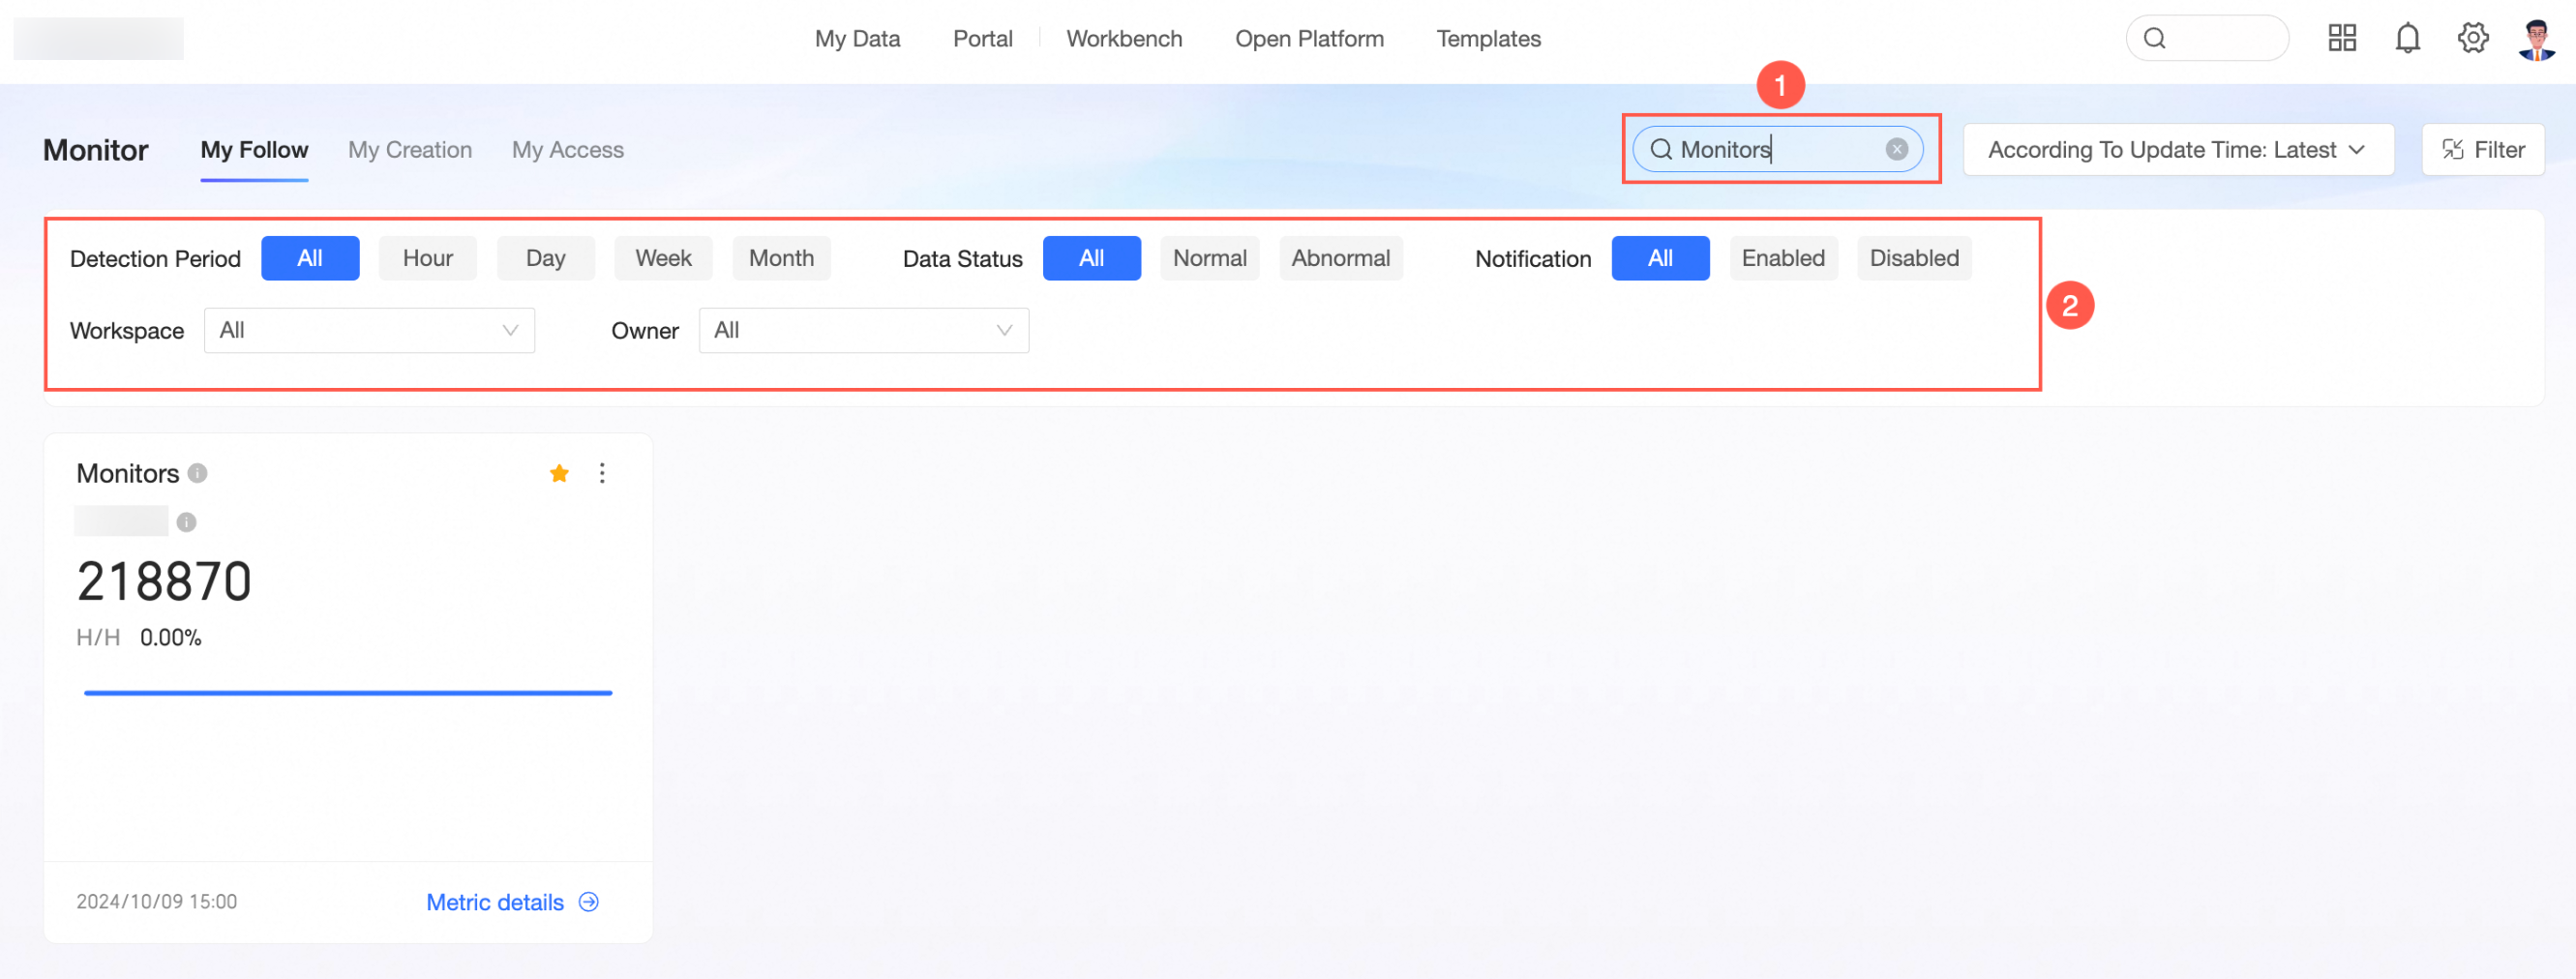
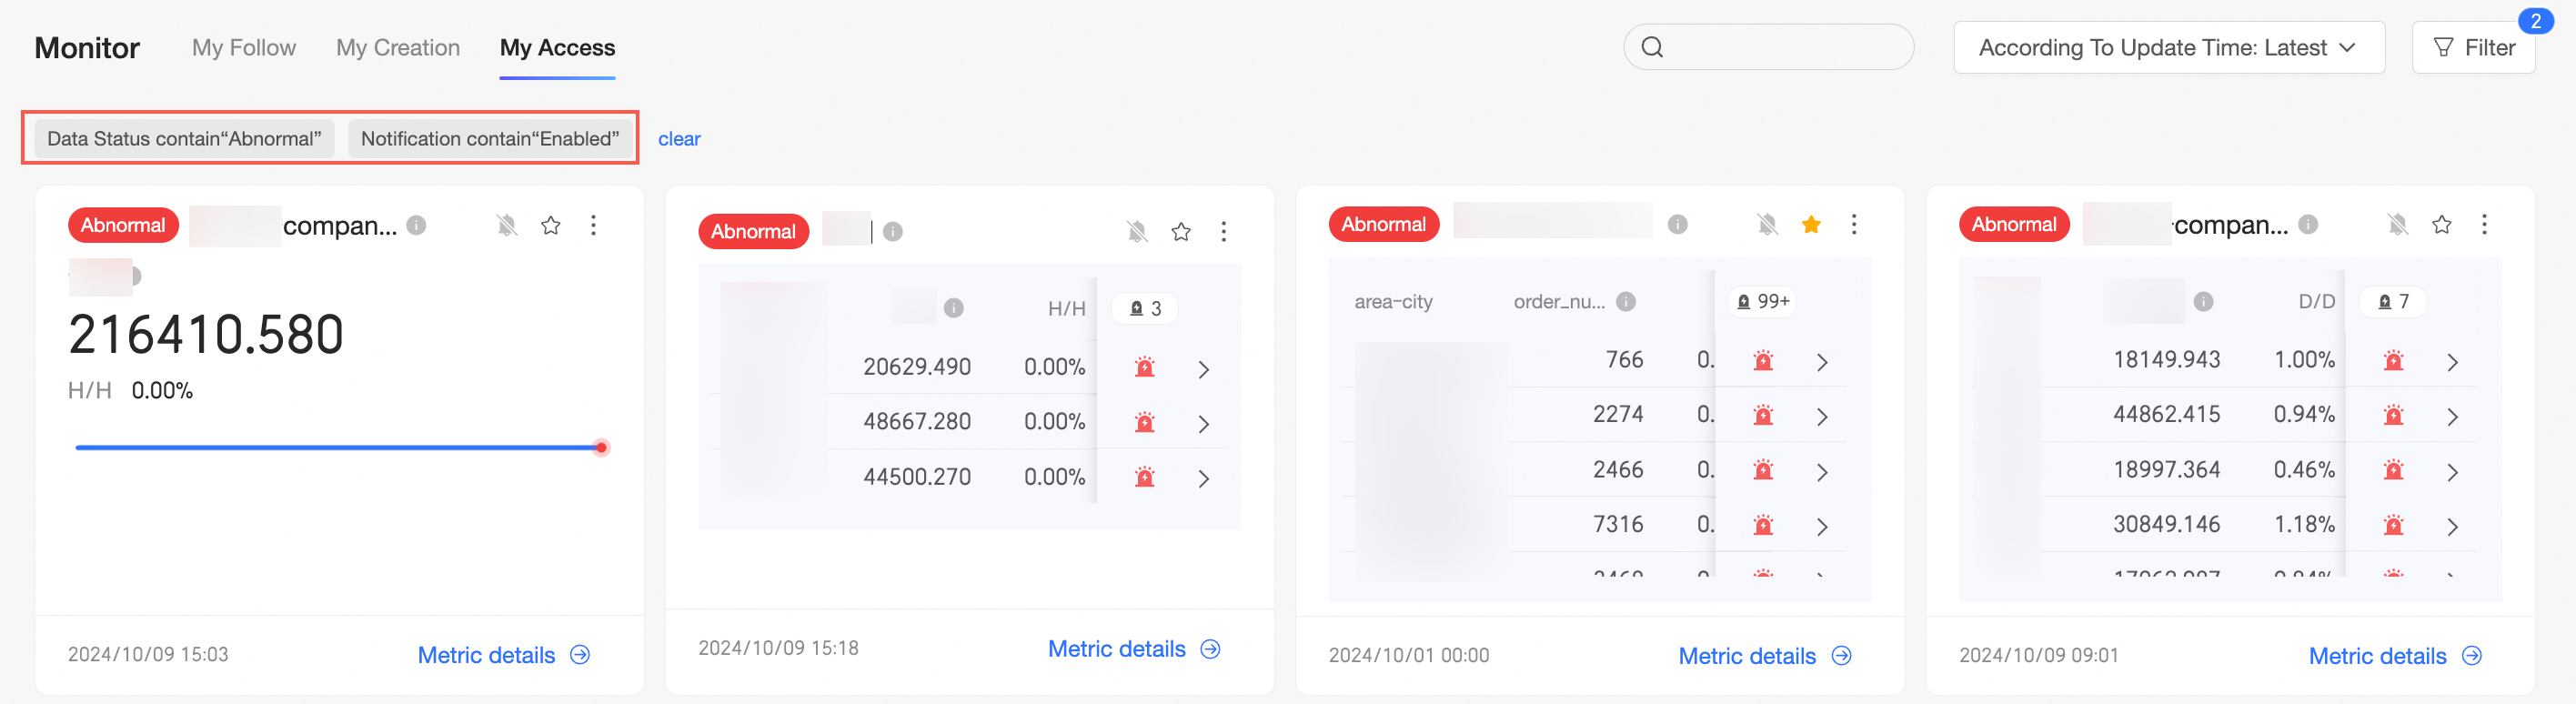
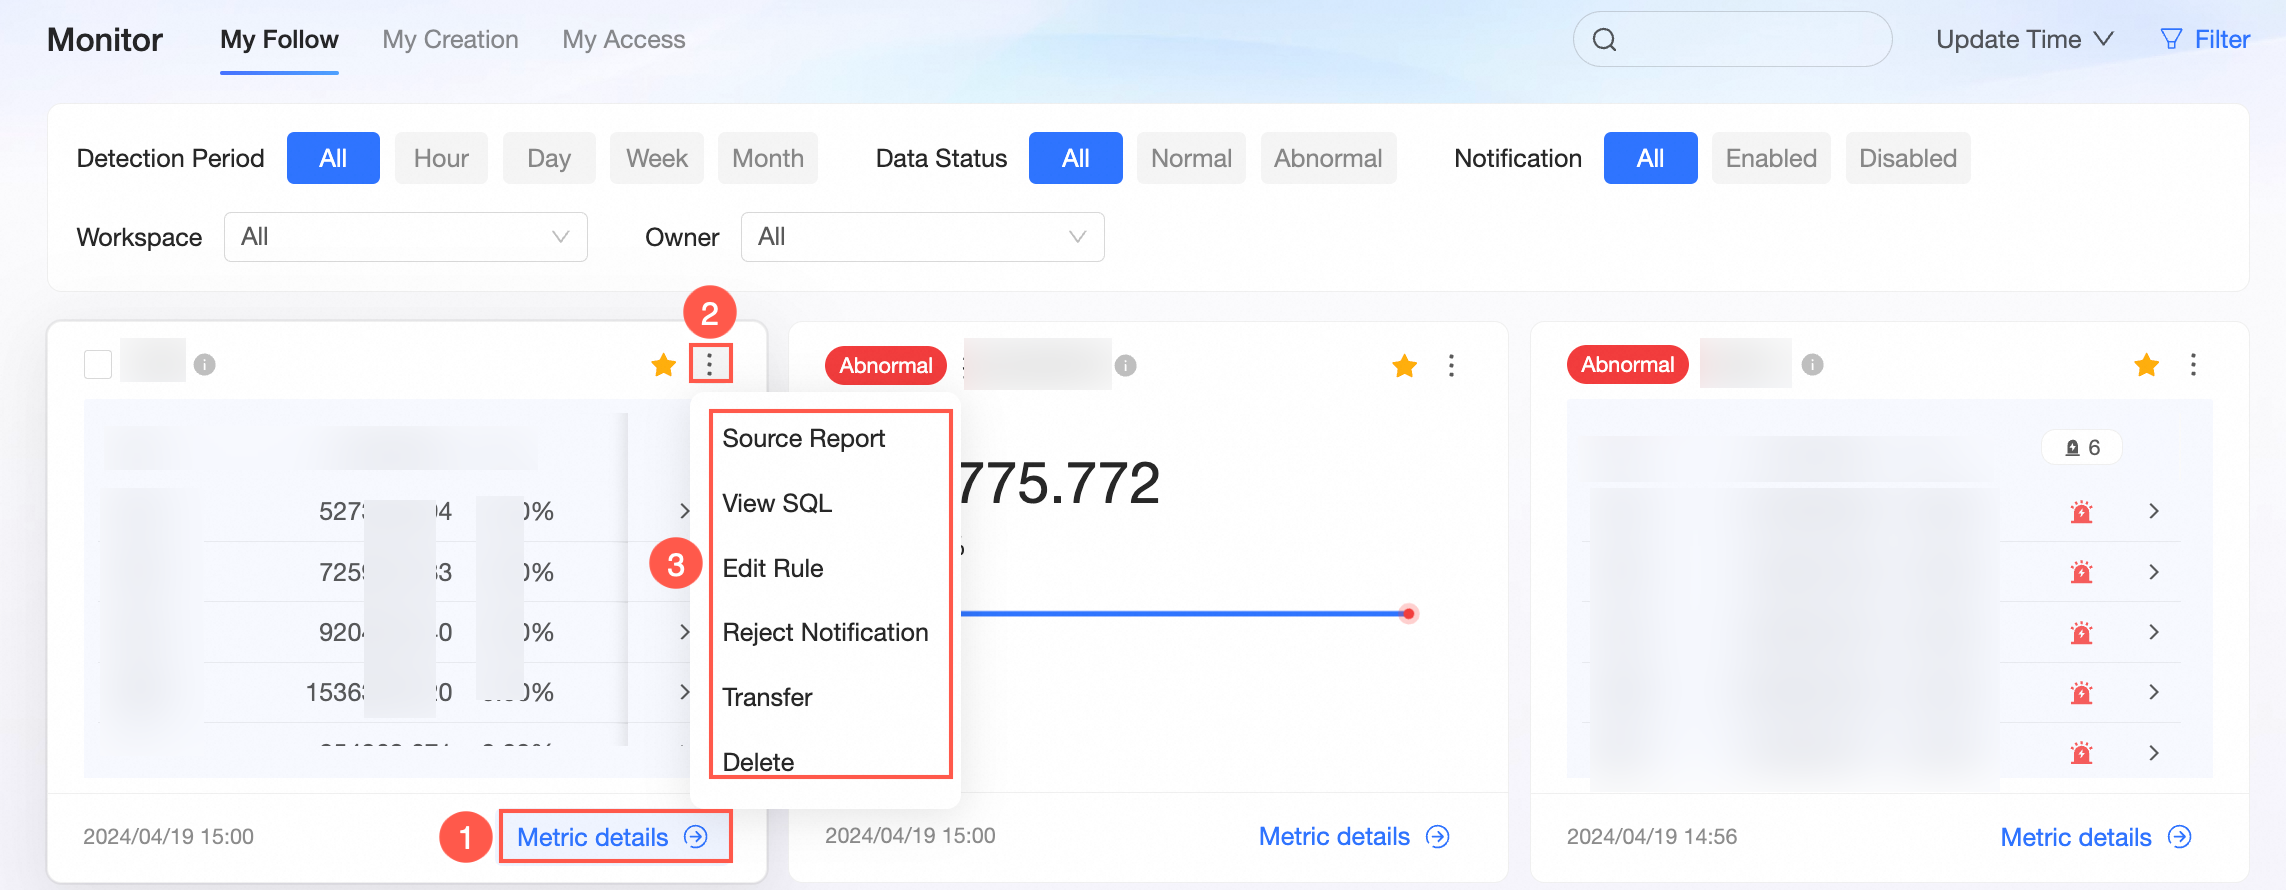
On the metric monitoring page, enter a metric name keyword in the search box (①) to quickly find a specific monitoring metric. You can also filter metrics by clicking Detection Cycle, Data Status, push notification, workspace, or owner in the filter area (②).
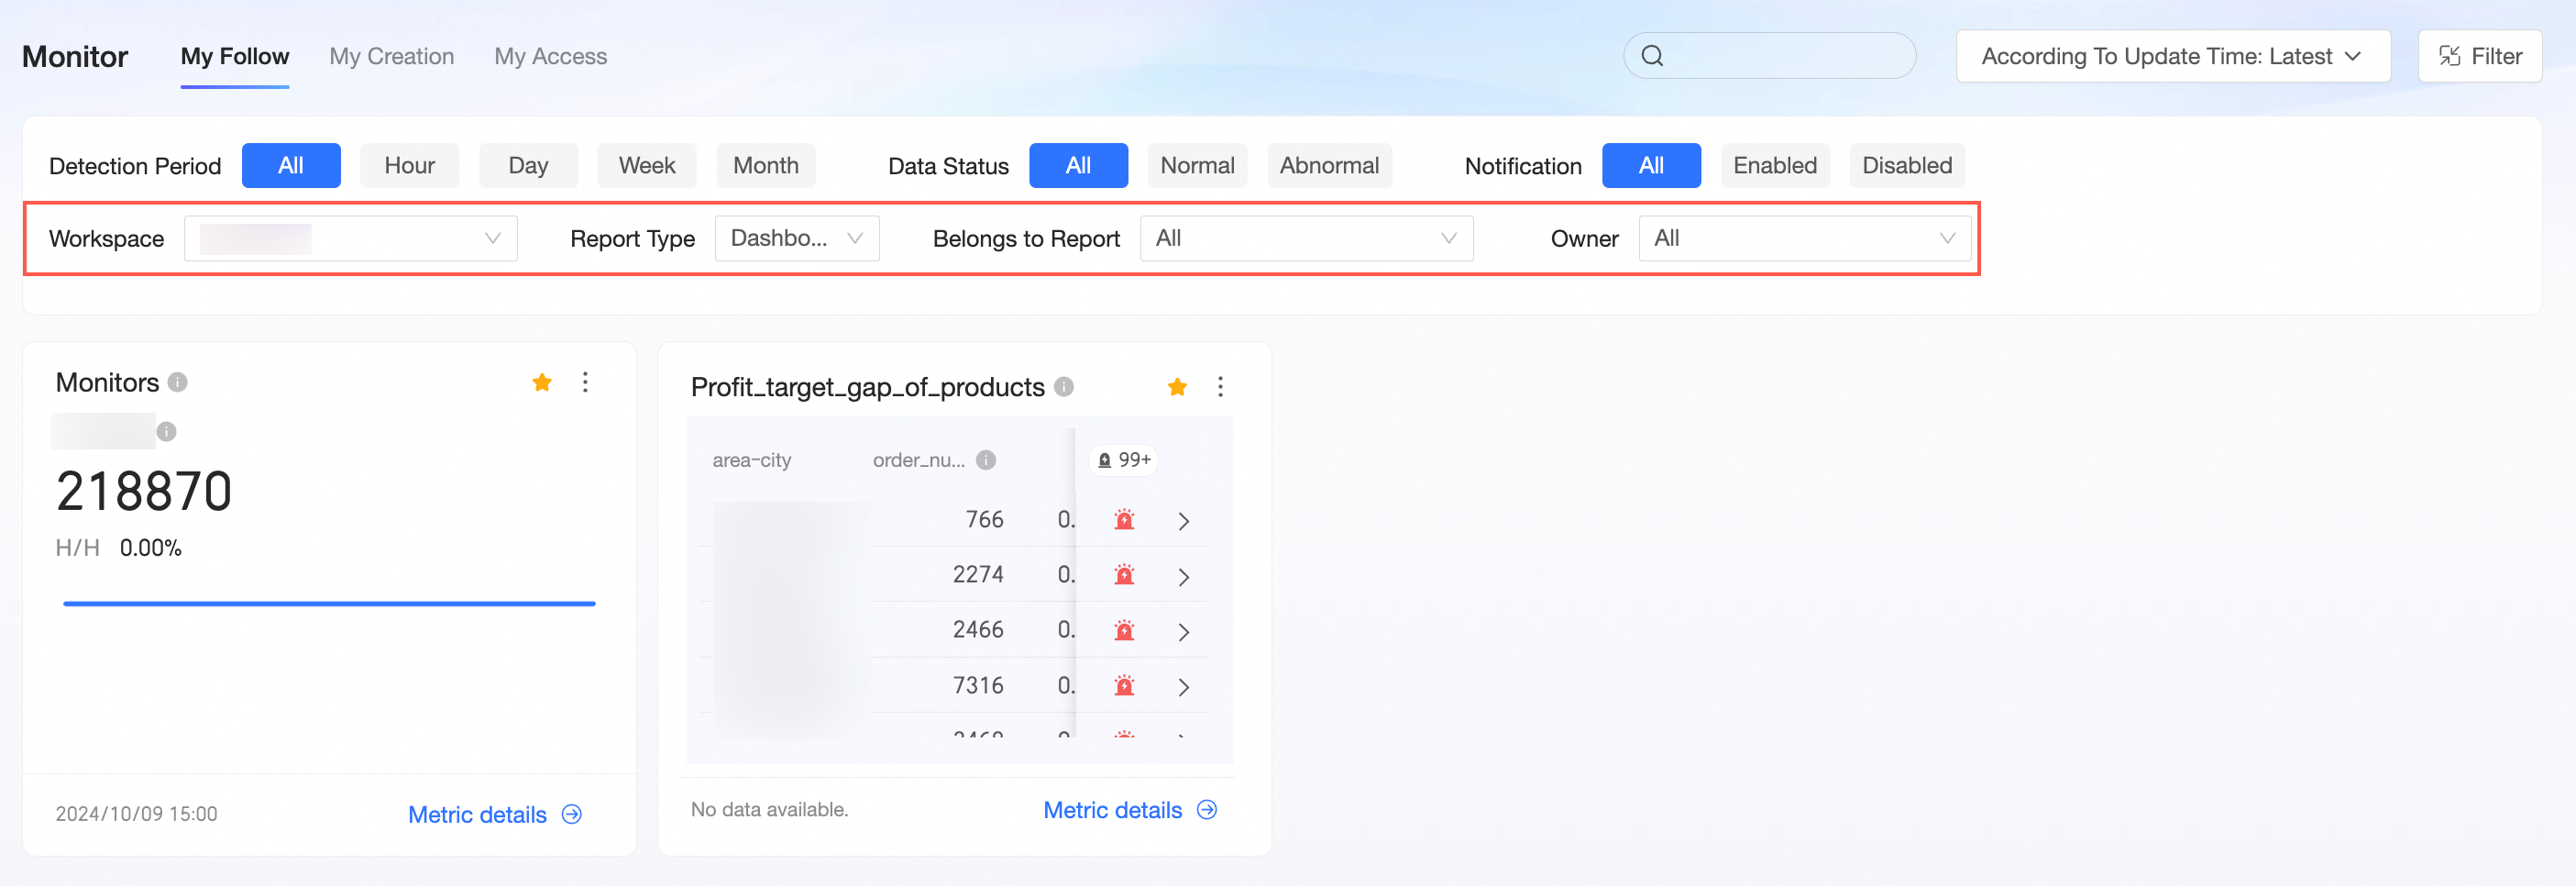
After you select a workspace in the filter area, you can view the metric monitoring status in specific reports by filtering by Report Type or Source Report.
You can click the Filter icon in the upper-right corner to hide the filter area. Once hidden, you can view the applied filters and can delete or clear them.
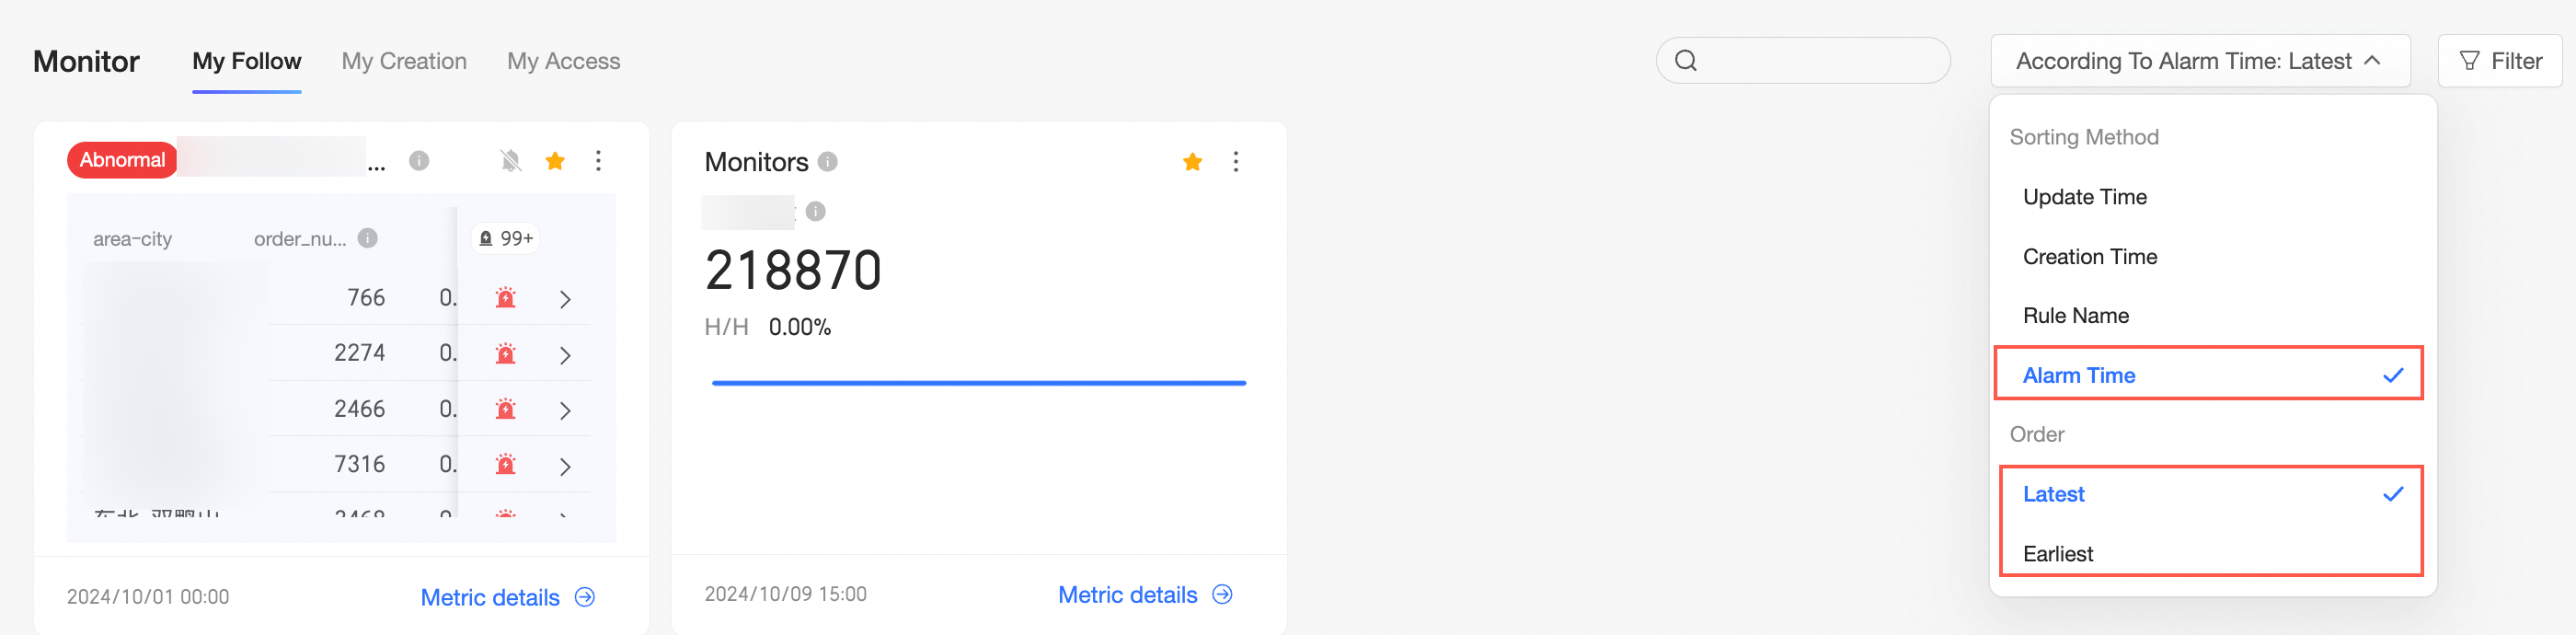
You can sort metrics by Update Time, Creation Time, Rule Name, or Alert Time. By default, metrics are sorted by update time, with the newest appearing first.
When sorting by update time, creation time, or alert time, you can choose to display the newest or oldest items first.
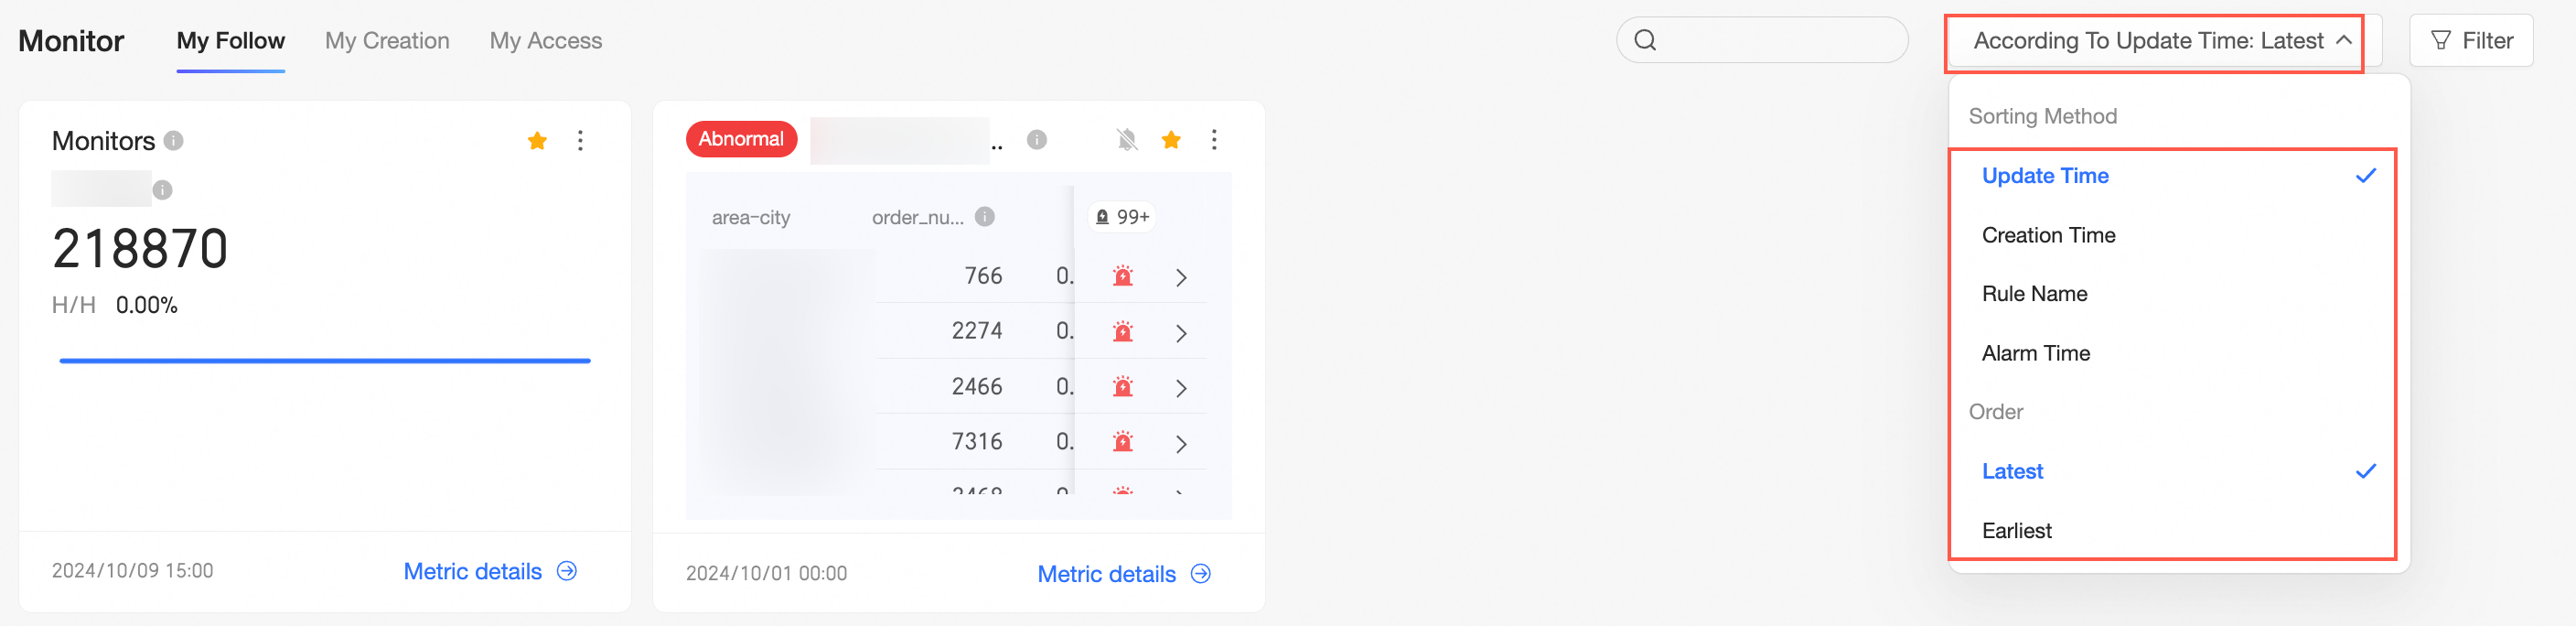
When sorting by rule name, you can choose between A-Z or Z-A order.

Batch operations
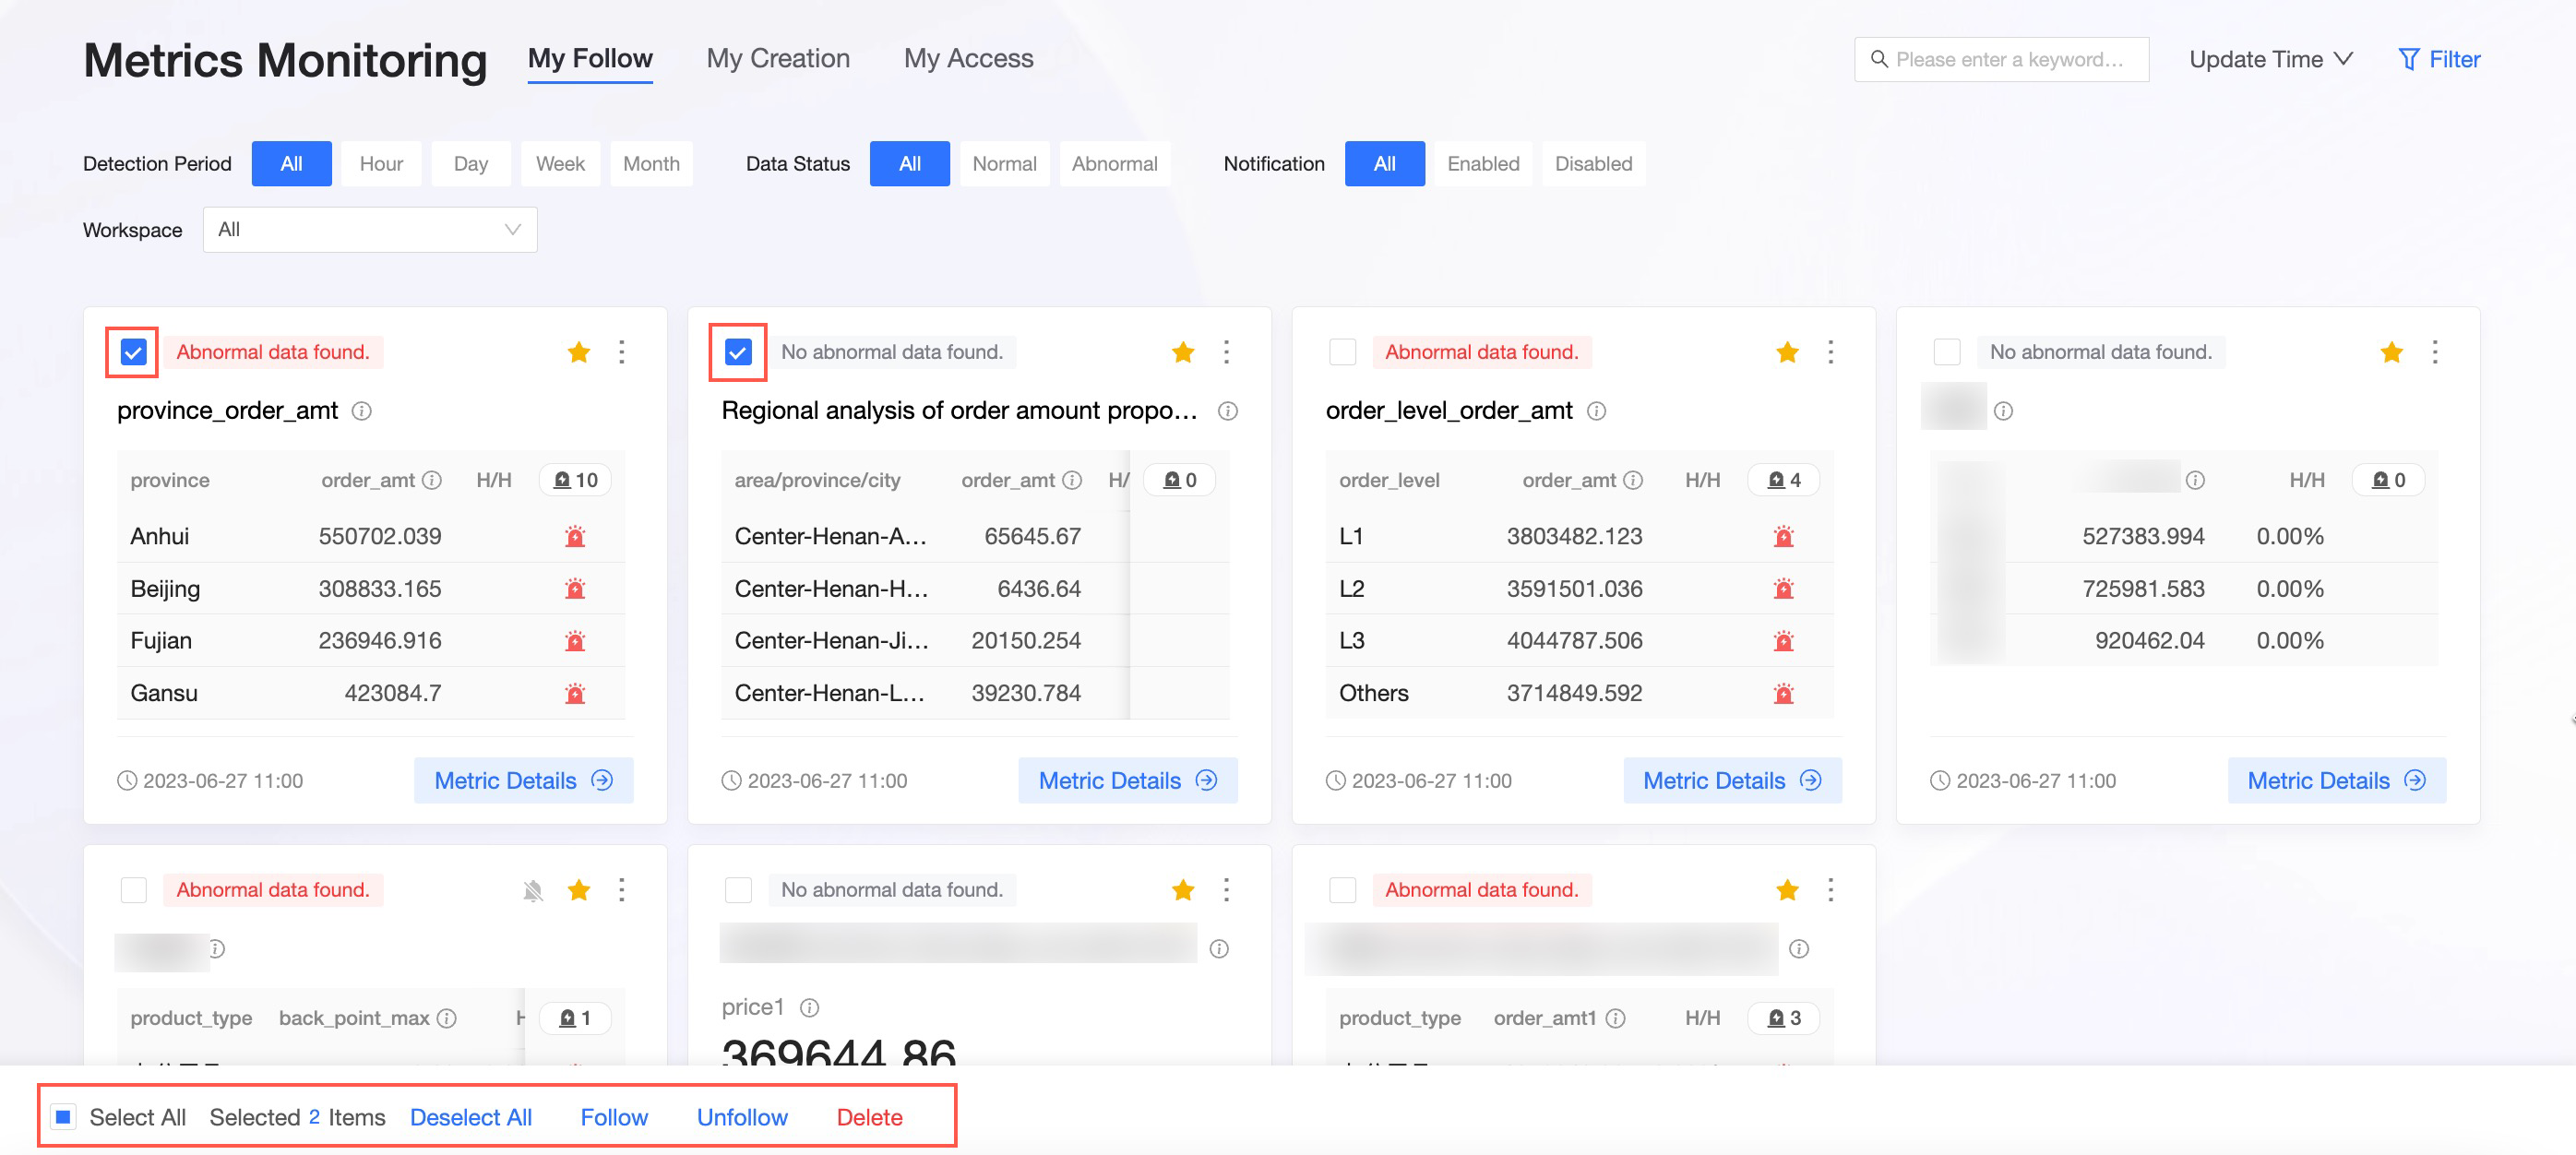
On the metric monitoring page, you can select multiple metrics to perform batch operations on.
Hover over a metric card and select the checkbox in its upper-left corner. After selecting one or more cards, you can Follow, Unfollow, or Delete them from the lower-left corner of the page.
Metric card operations
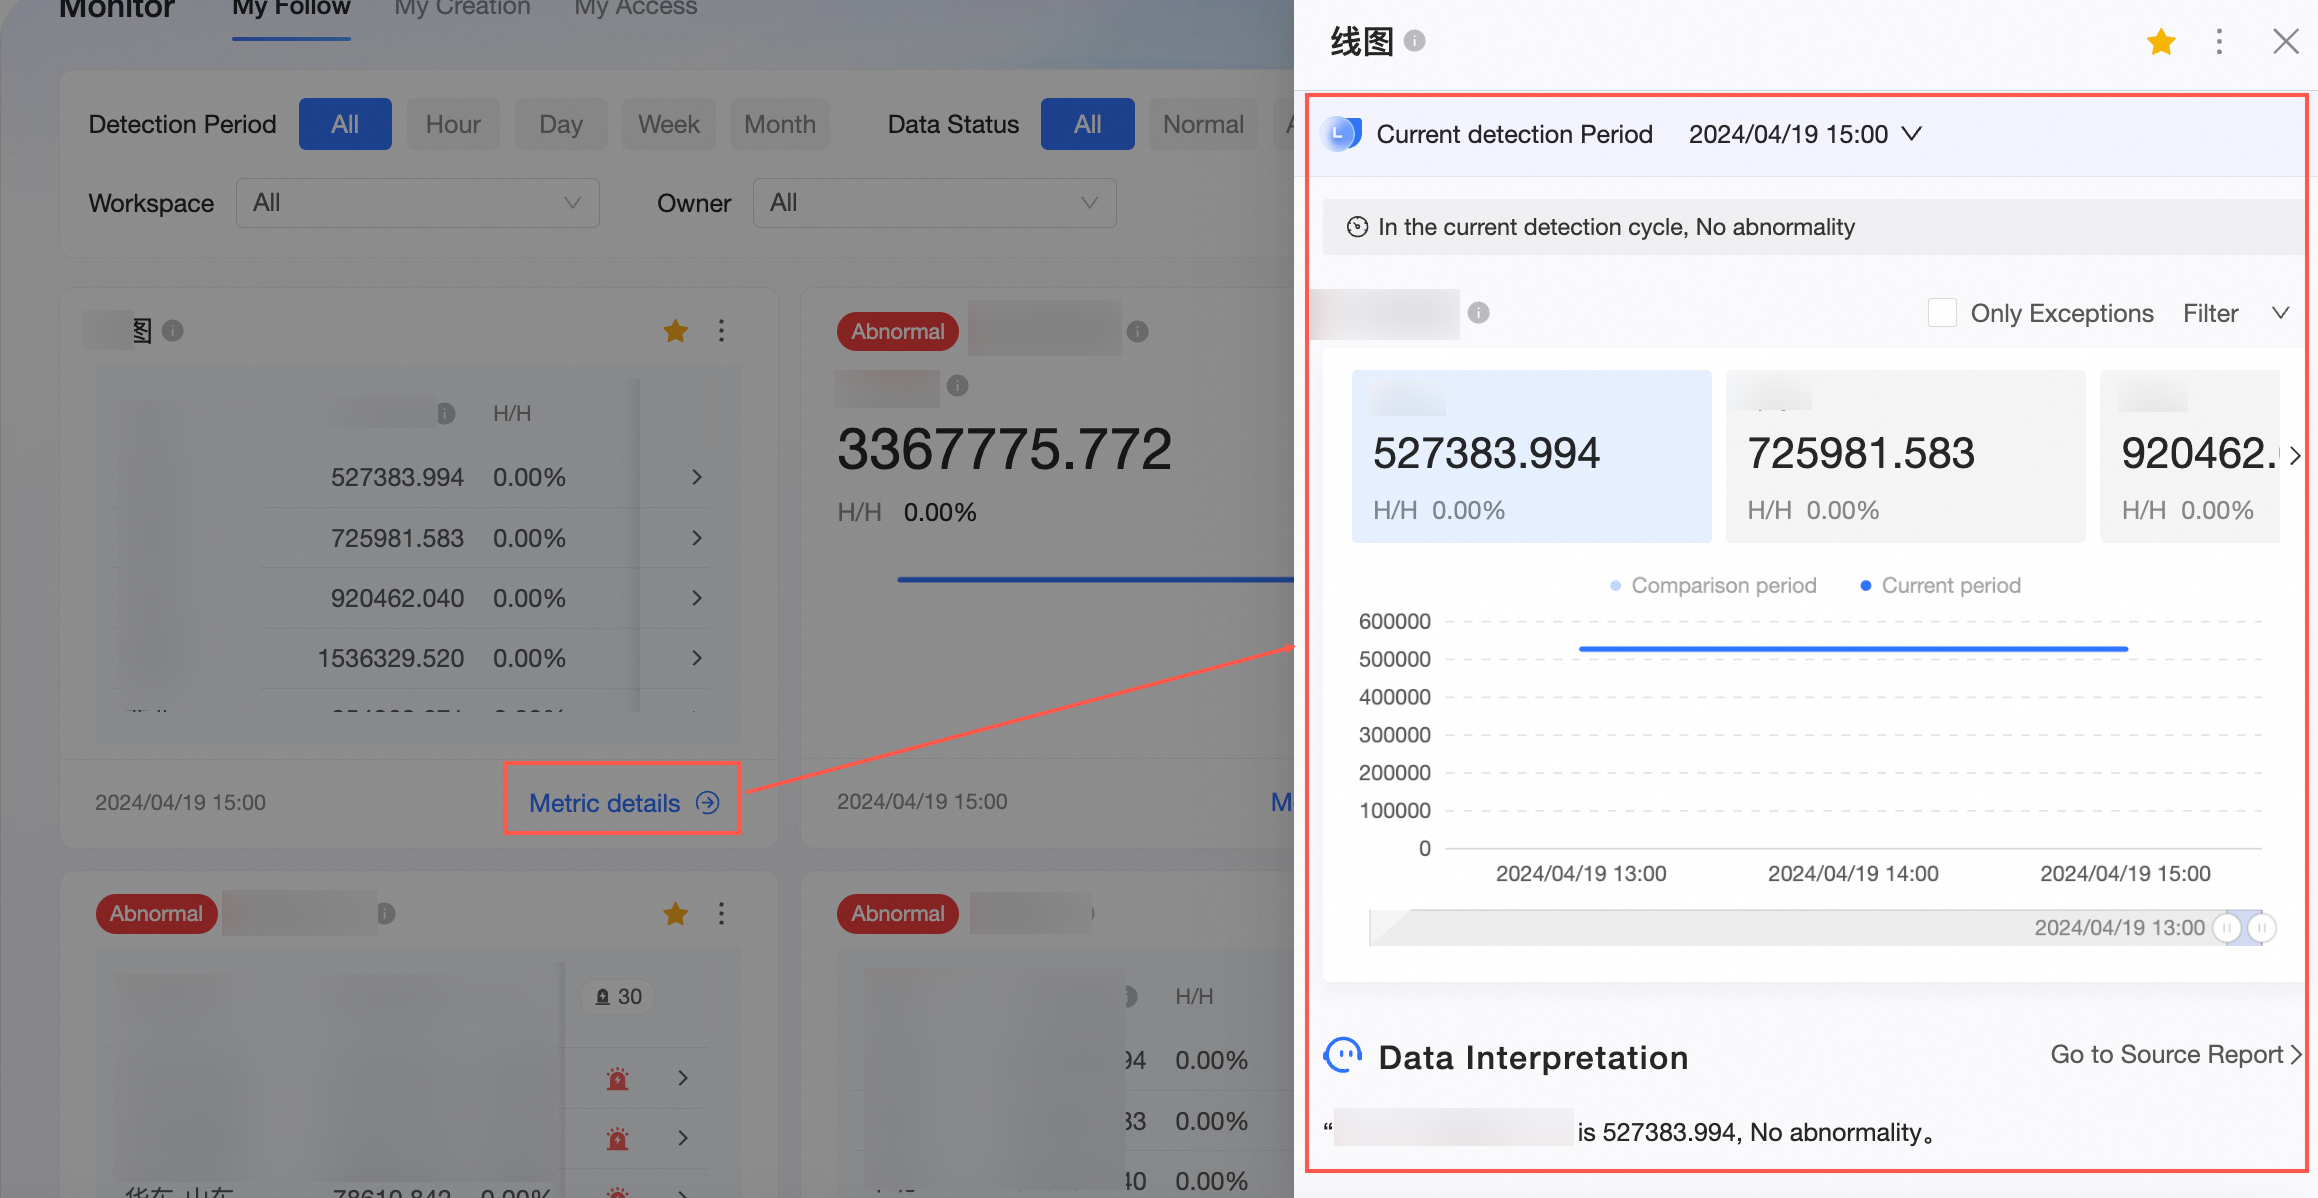
To view the details of a specific monitoring metric, click Metric Details (①) in the lower-right corner of the card to view alert details. You can also click the
icon (②) in the upper-right corner of the card to access more options, such as Source Report, View SQL, Edit Rule, Mute Push Notifications, Transfer, and Delete (③).Metric Details
Source Report
Click this option to navigate to the source report of the current metric card.
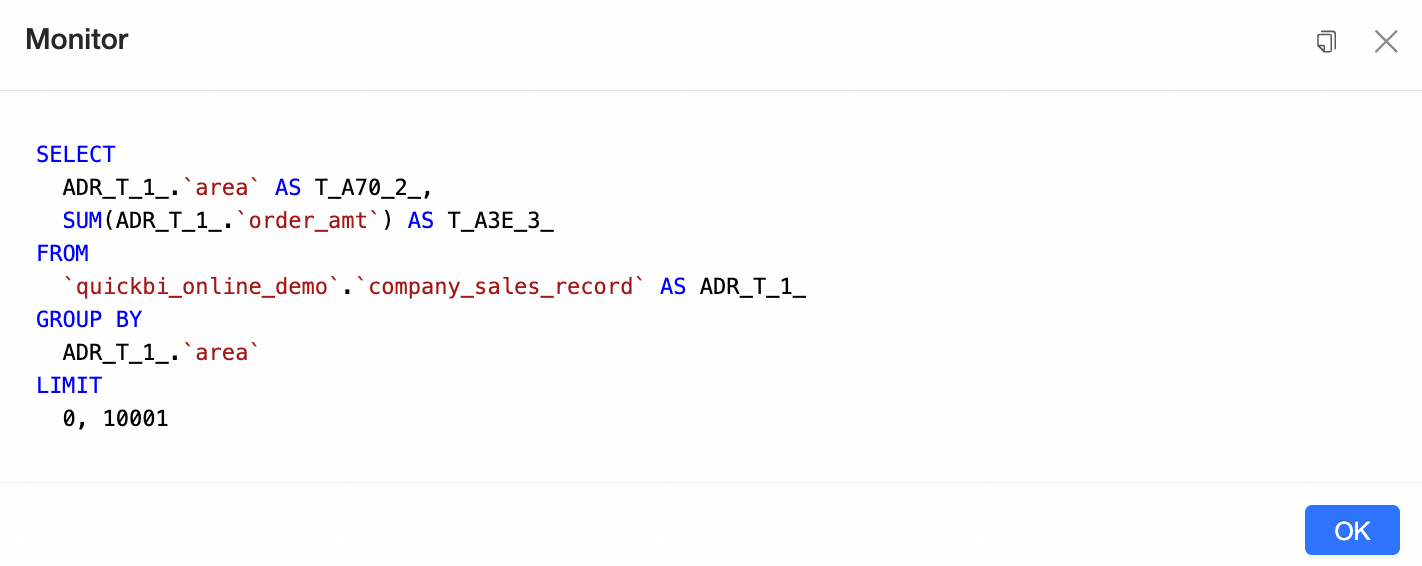
View SQL
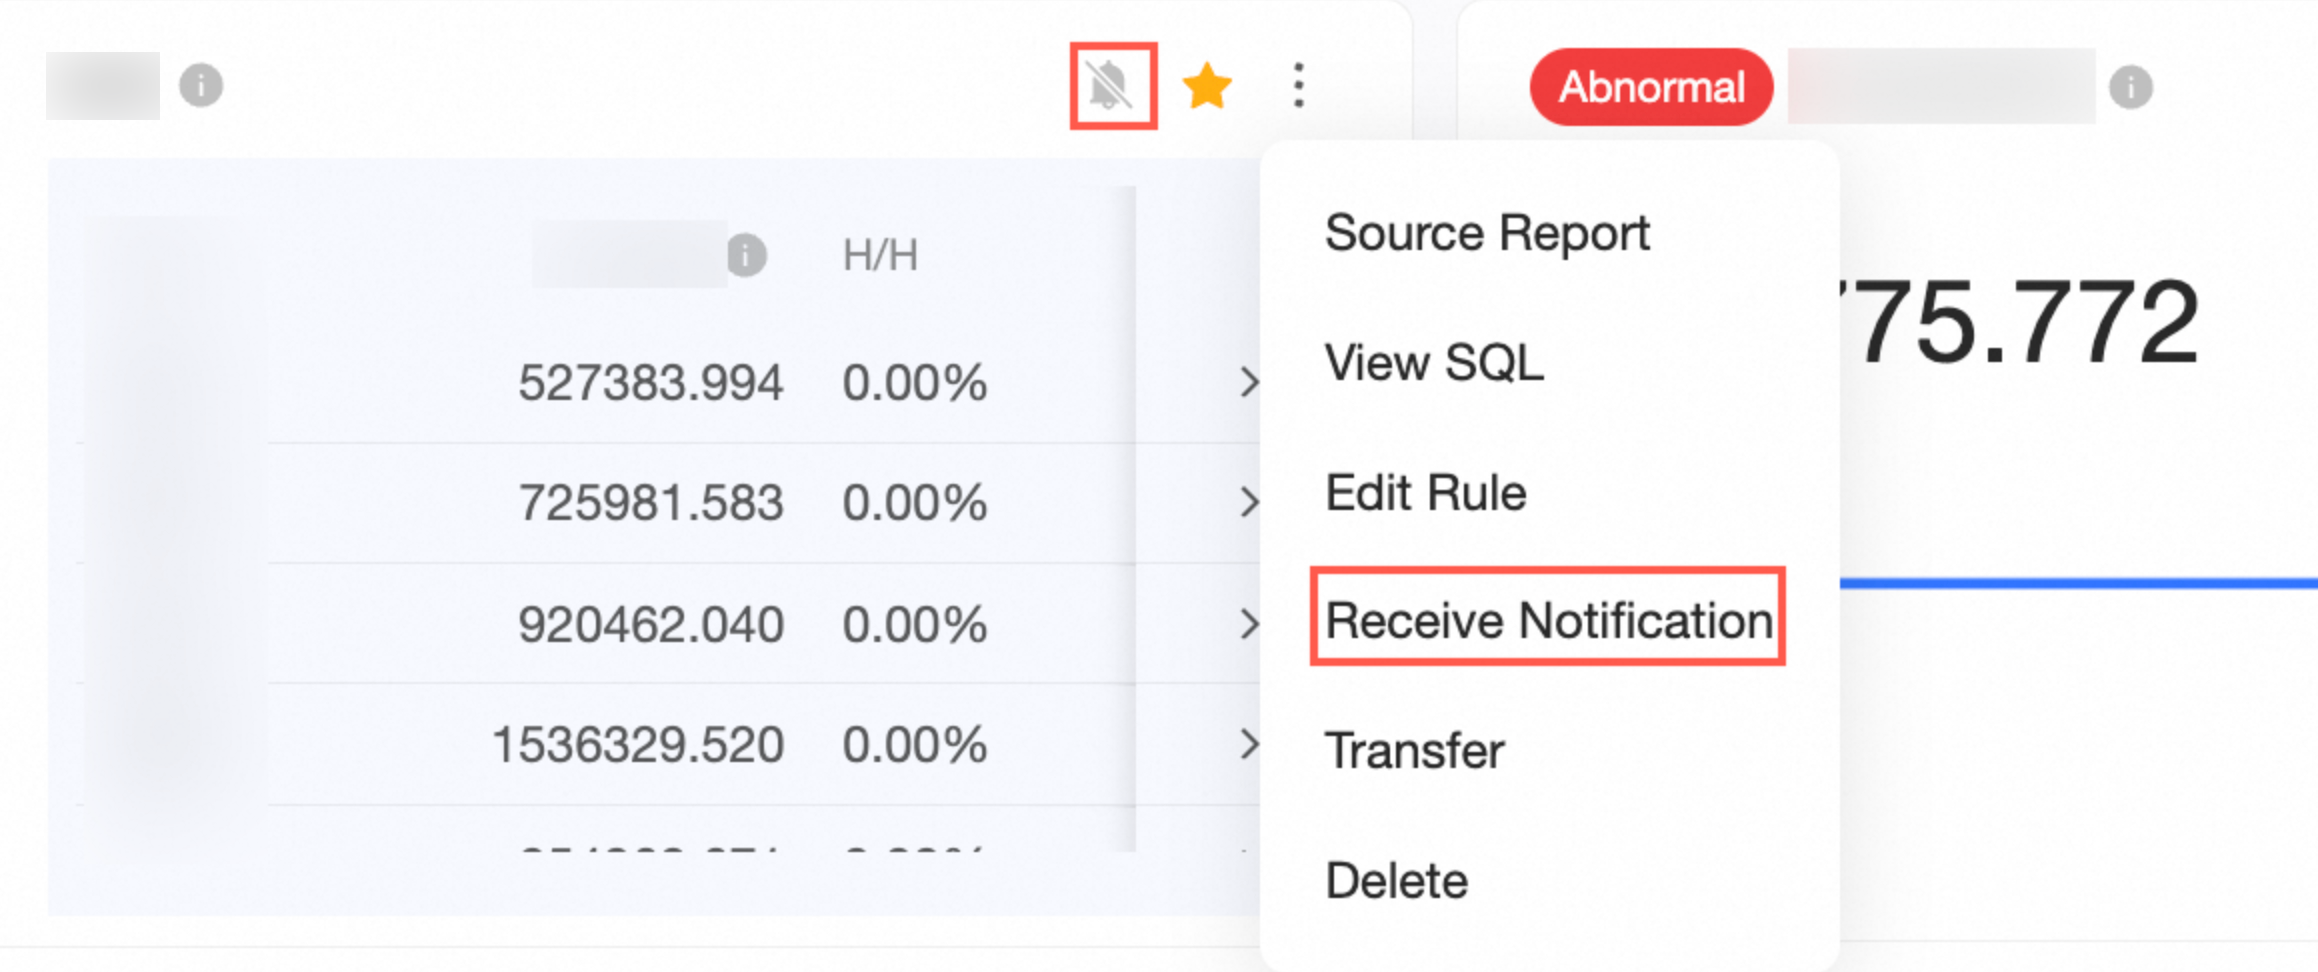
Mute Push Notifications
After you mute push notifications, you will no longer receive alerts. An
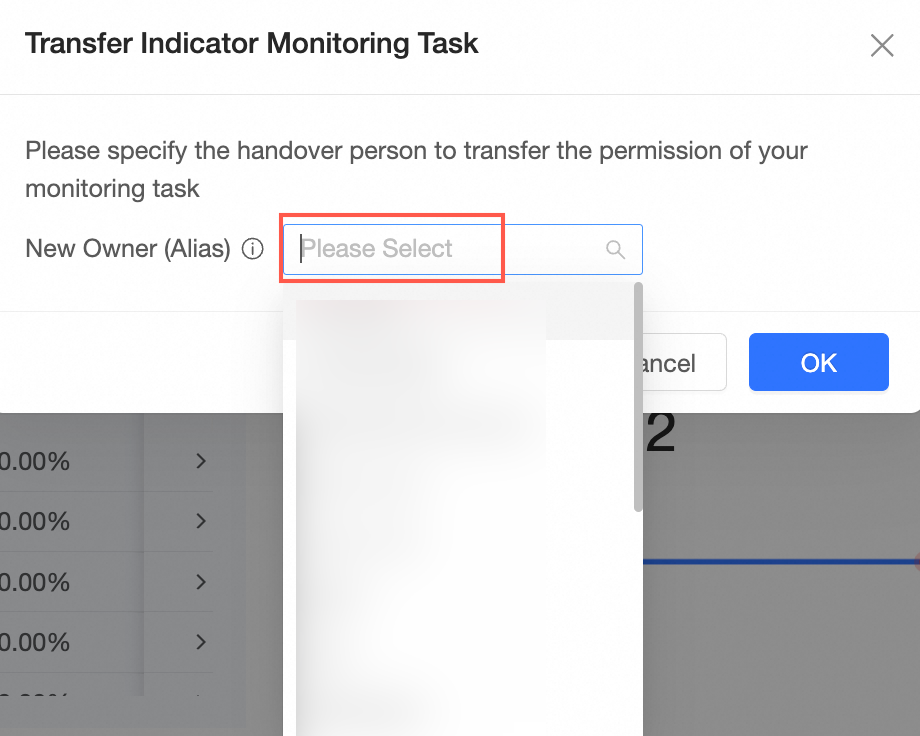
icon appears in the upper-right corner. You can click Unmute Notifications to resume them.Transfer
You can transfer the monitoring task by selecting an assignee and clicking OK.
NoteThe assignee must have permission to view the report. Otherwise, the monitoring task will become invalid.
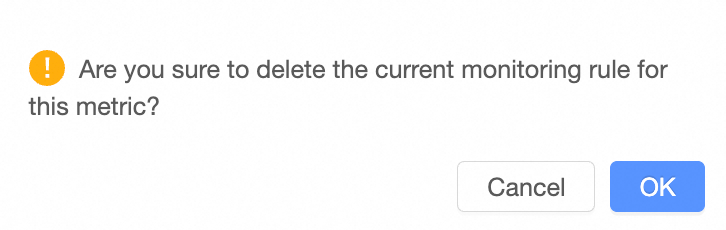
Delete
You can delete a monitoring metric. In the confirmation dialog, click OK to delete the metric.
Metric monitoring on a dashboard
Log on to the Quick BI console.
Select a dashboard and, on the preview page, click Metric Monitoring in the upper-right corner.
The metric monitoring page for the report appears.
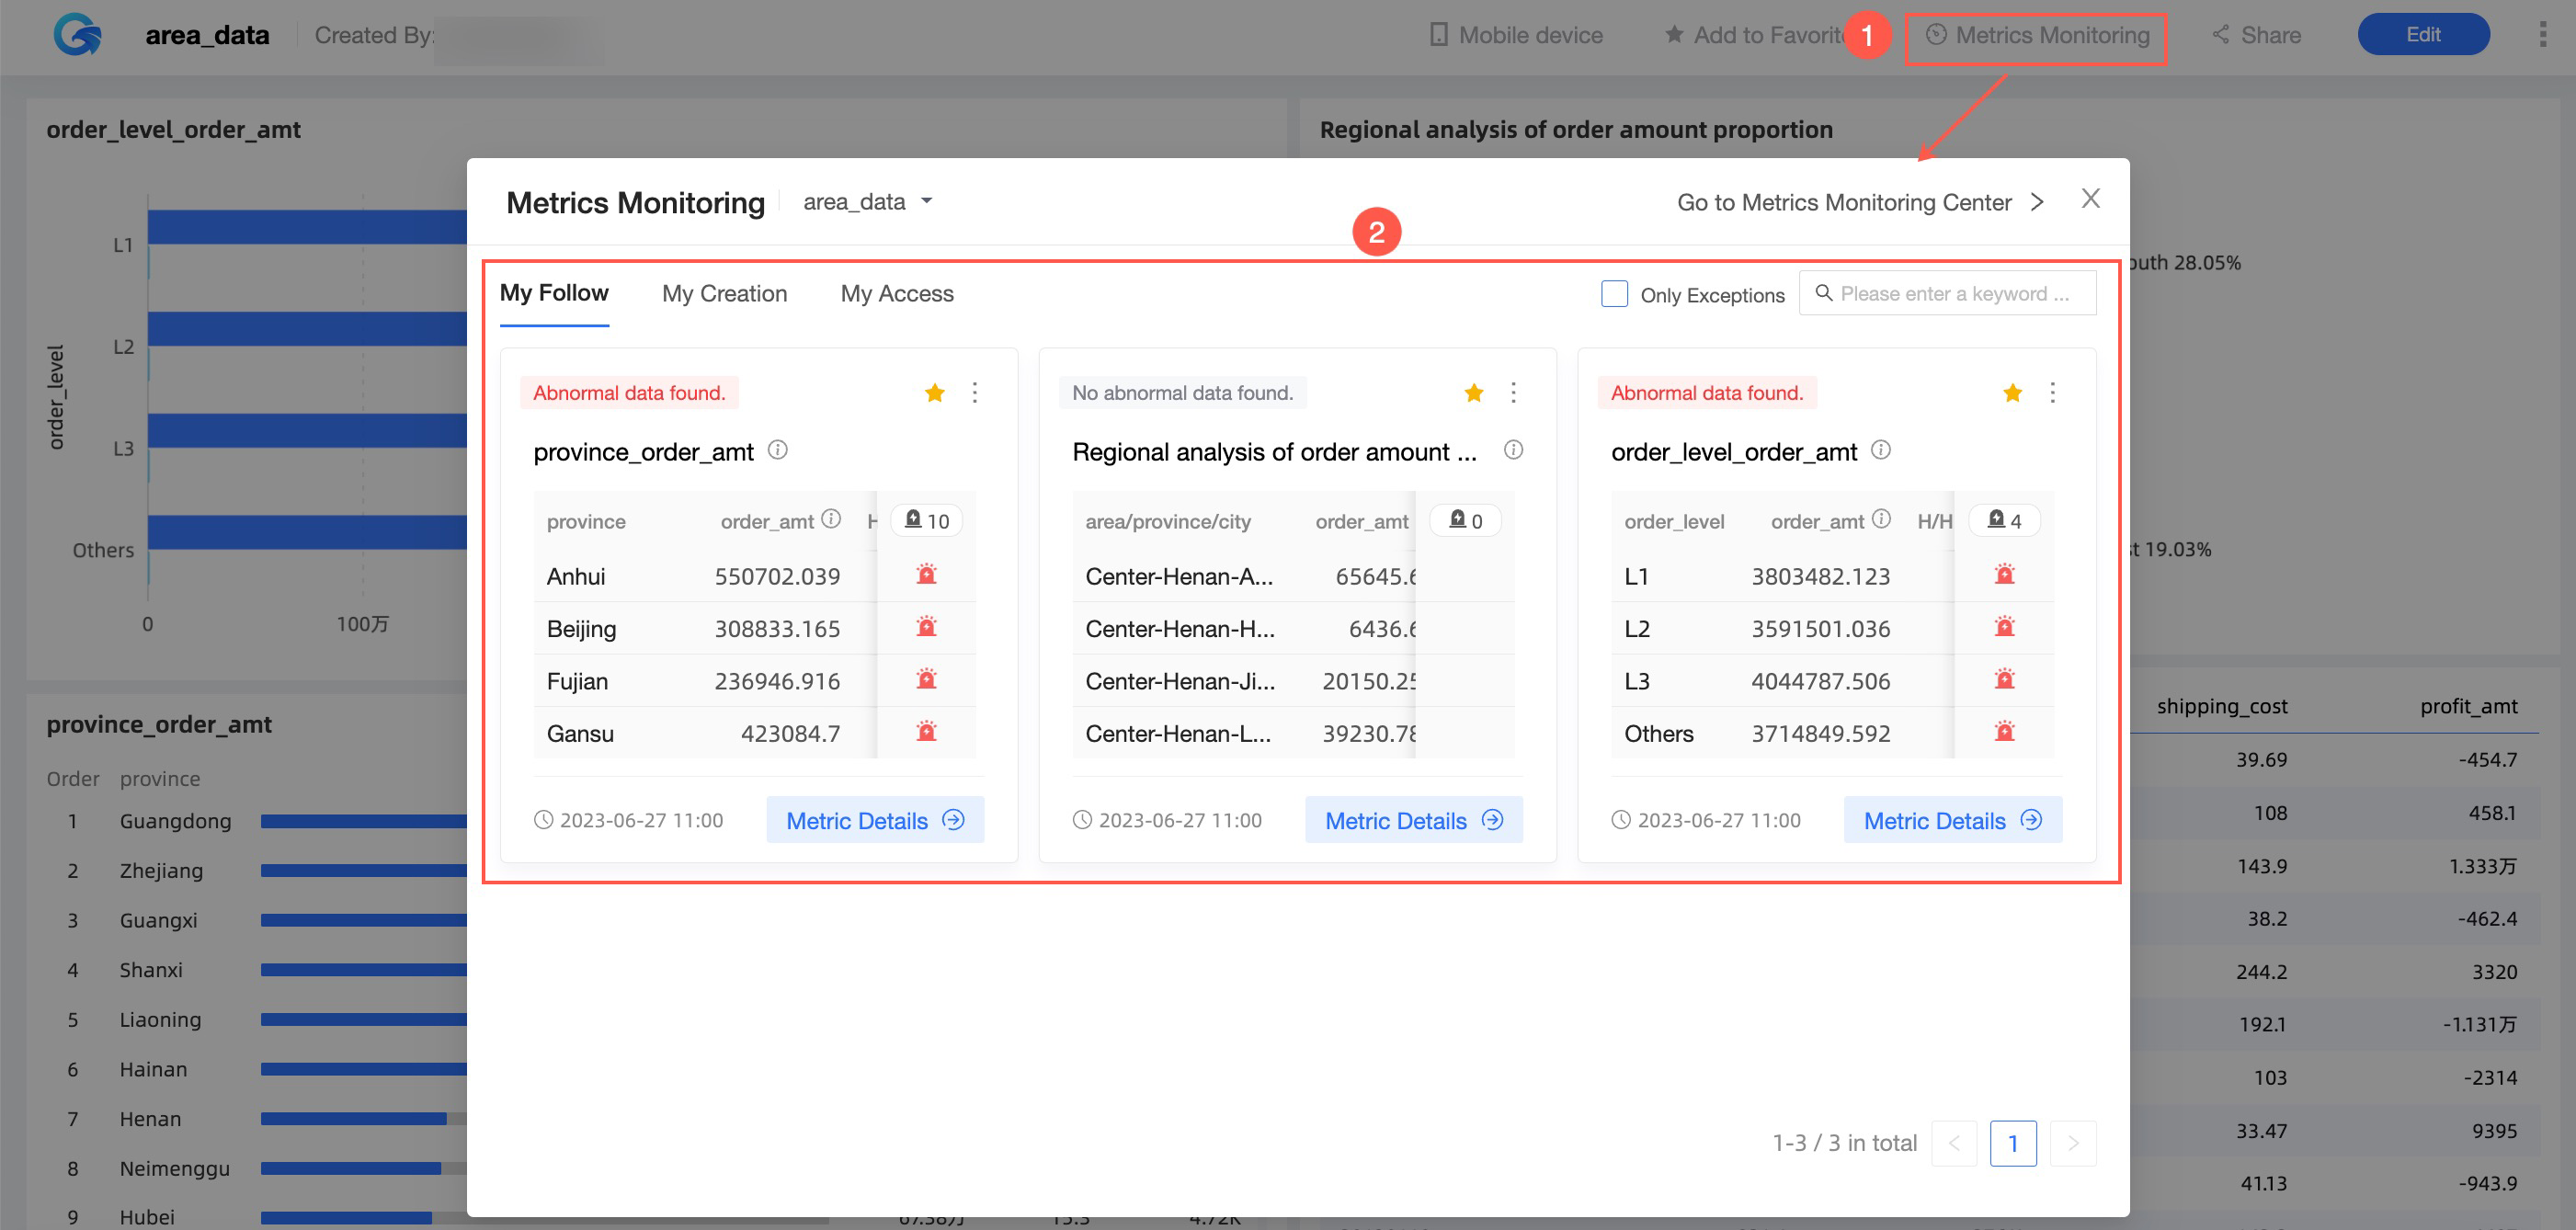
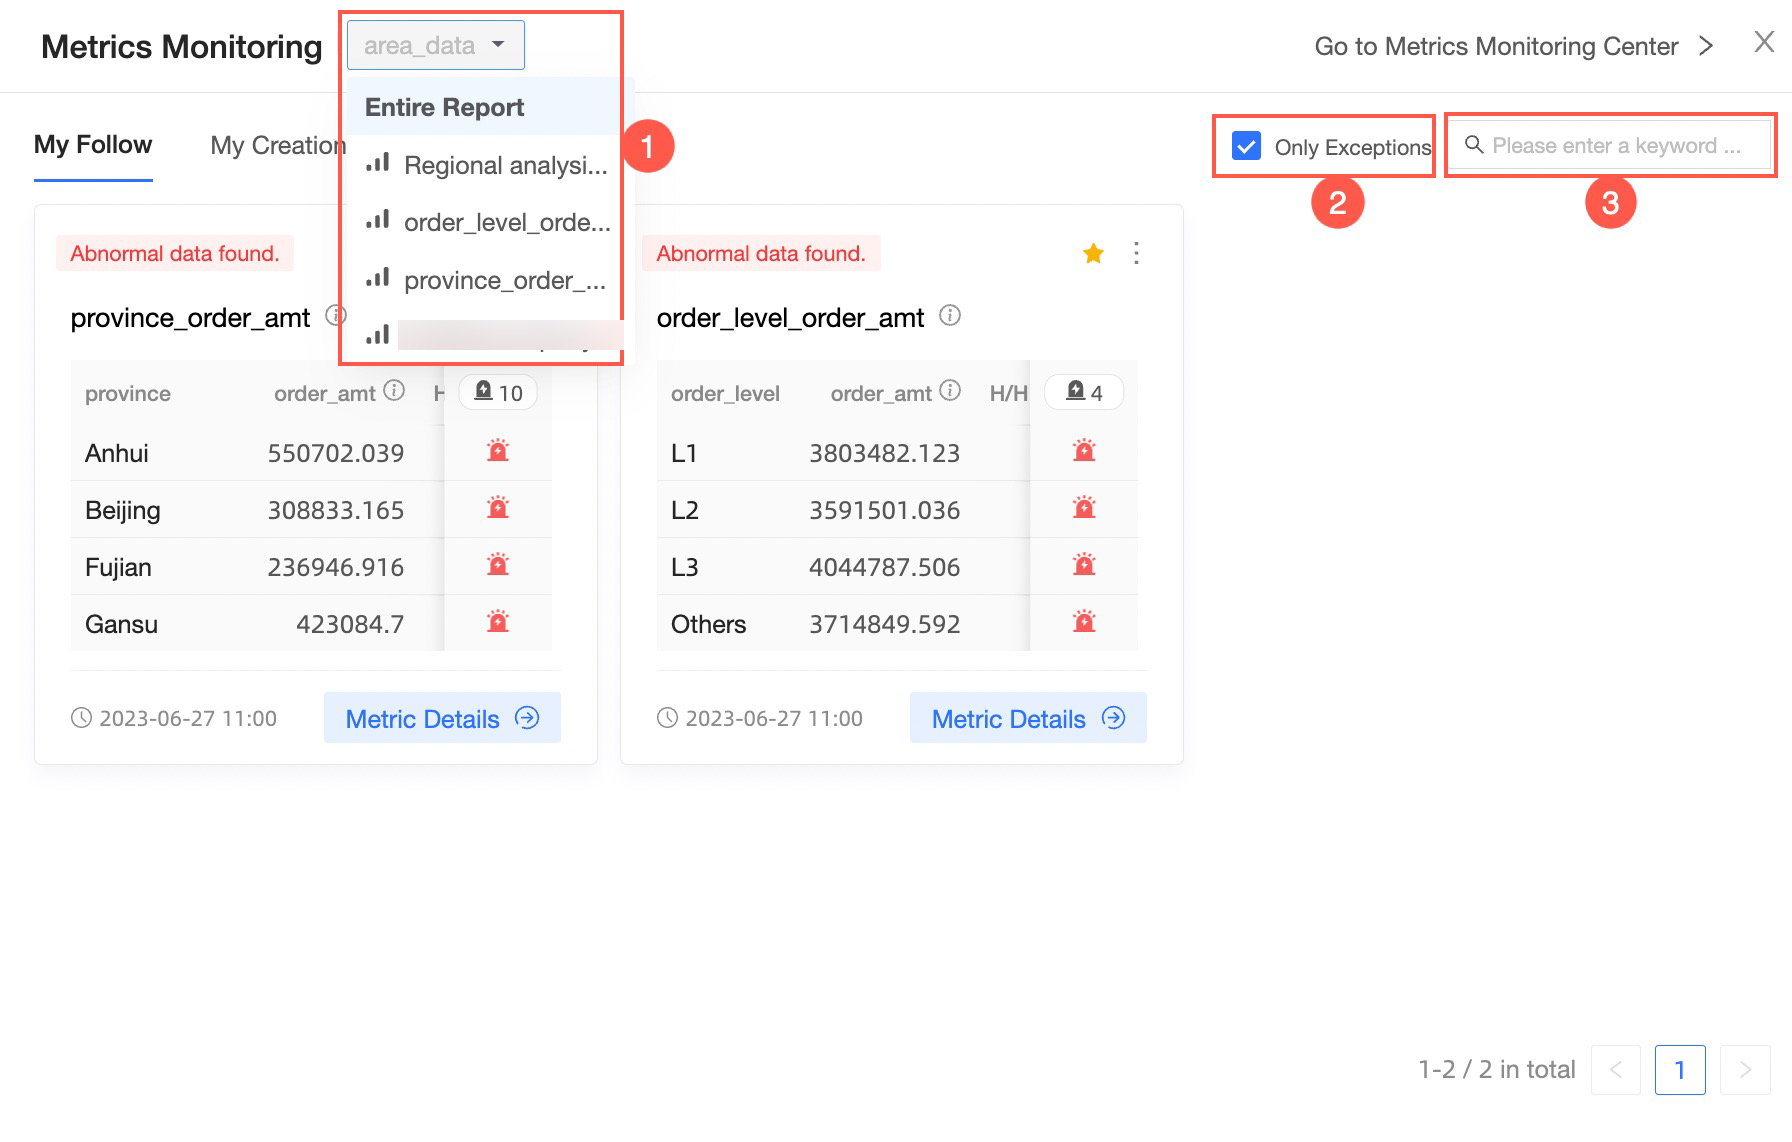
Search metric monitoring
On the metric monitoring page for the report, you can switch in the upper-left corner (①) to query either the entire report or a specific chart. When you select the View Anomalies Only checkbox, the page displays only anomalous metrics (②). In the search box on the right, you can enter a keyword to quickly find anomalous metrics (③).