ApsaraVideo VOD integrates with multiple monitoring and logging services so you can track CDN performance, playback quality, resource configuration compliance, and operational activity—all in one place. Use these capabilities to detect problems early, set up proactive alerts, and audit changes across your infrastructure.
Resource data monitoring and statistics
ApsaraVideo VOD provides built-in monitoring and statistics across three areas: CDN resource usage, playback quality, and playback behavior. Use these metrics to understand system performance, diagnose issues, and inform business decisions.
Resource monitoring
Resource monitoring returns CDN metrics at a 5-minute or 1-hour granularity. Metrics cover traffic, bandwidth, origin pull, and HTTP status codes for accelerated domain names. You can query up to the last year of data, with a maximum range of 90 days per query.
The Resource monitoring page provides five tabs:
|
Tab |
What it shows |
|
Accelerated traffic and bandwidth |
Traffic volume and bandwidth usage over time |
|
Origin statistics |
Origin pull traffic and requests |
|
Requests |
Request counts by domain |
|
Hit rate |
CDN cache hit rate |
|
HTTP Code |
Distribution of HTTP response codes |
Filter data by tag, domain name, region, ISP, or time granularity. Select a preset range (Today, Yesterday, Last 7 days, or Last 30 days) or enter a custom range, then click Search. Results appear as a trend chart and a data table.
For more information, see Data monitoring.
Real-time monitoring
Real-time monitoring returns CDN metrics at a 1-minute granularity—finer than resource monitoring—covering traffic, bandwidth, origin pull, and HTTP status codes for a single accelerated domain name. Data is available for the last 7 days, with a maximum range of 24 hours per query.
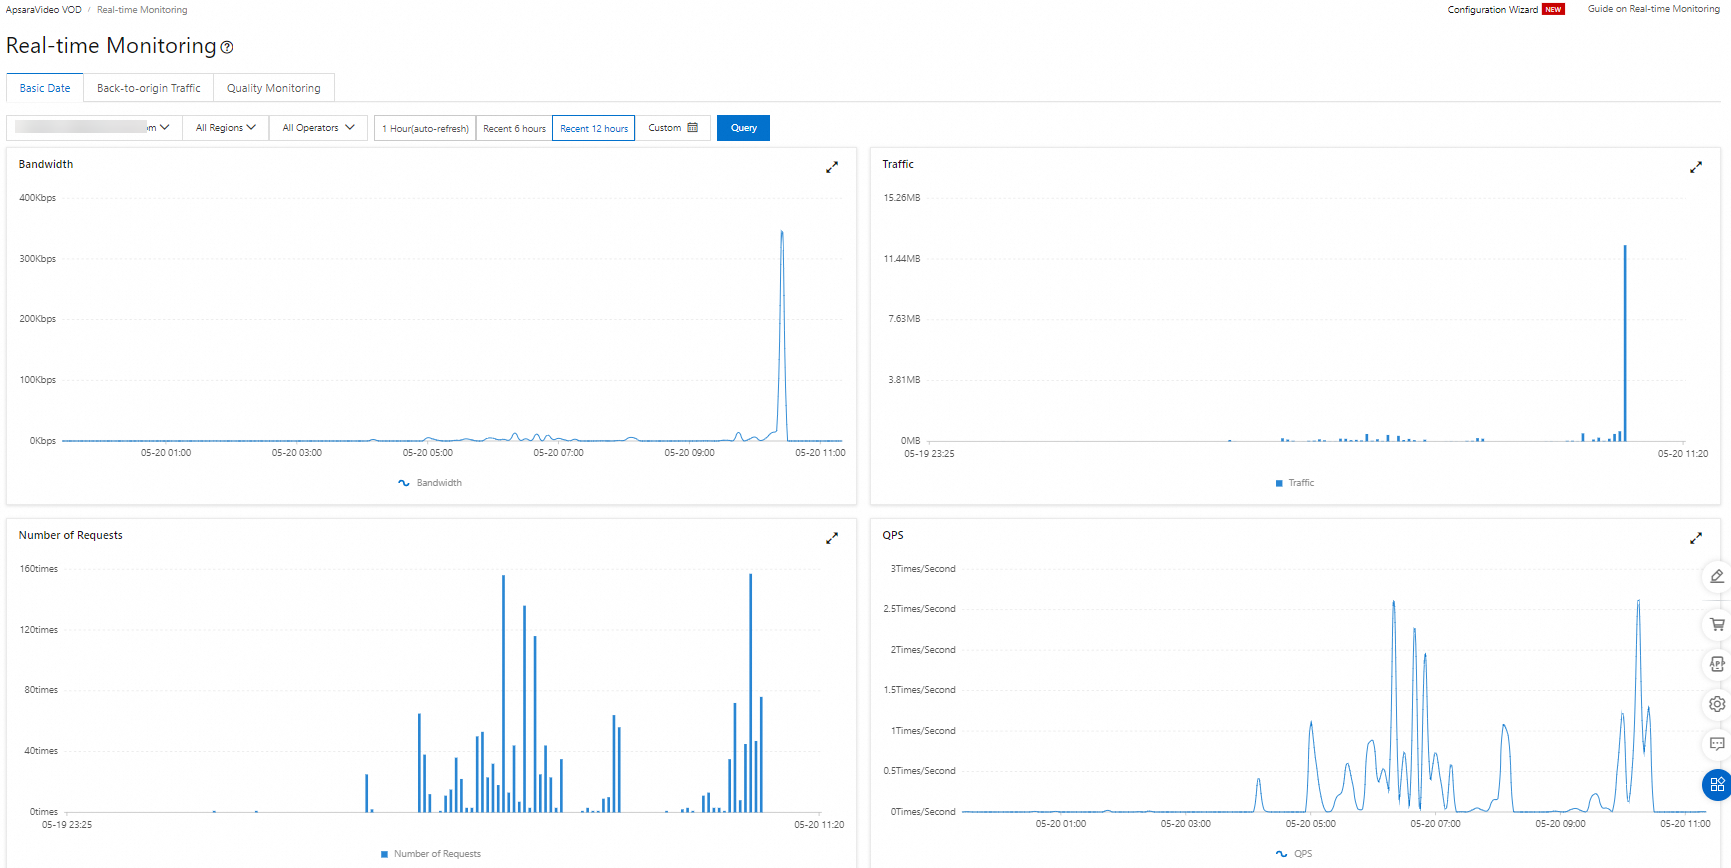
For more information, see Data monitoring.
Playback quality monitoring
Playback quality monitoring uses event tracking data reported by the ApsaraVideo Player SDK to surface three key metrics:
|
Metric |
Use this metric to |
|
Playback failure rate |
Identify the proportion of play attempts that fail to start. A high rate points to issues with video processing or CDN availability. |
|
Instant playback rate |
Track how often videos start playing immediately. A low rate suggests slow startup, which degrades user experience. |
|
Stuttering rate |
Measure how frequently playback interruptions occur. Correlate with bandwidth or CDN metrics to diagnose the root cause. |
The Playback quality monitoring page shows a banner indicating that you must use the MediaBox audio and video SDK with a valid license and log reporting enabled. The page includes four tabs: Application overview, QOS Insights, QOE Insights, and Operations statistics.
On the Application overview tab, filter by scenario (such as Interactive live streaming), client type (such as Web), OS type, and time range (Last 1 hour, Last 6 hours, Last 12 hours, Today, or Custom). Add filters for Plays, Actual plays, First frame, All resolutions, or All network types, then click Search. Four monitoring panels appear:
Plays — total play count
Actual plays — plays that reached actual video content
First frame time — time to first frame in milliseconds
Unique users — distinct user count
From any panel, navigate to QOS Insights or QOE Insights for deeper analysis.
For more information, see Playback quality monitoring (legacy).
Statistical analysis
Statistical analysis uses ApsaraVideo Player SDK data to report on playback behavior and popular content. Use it to:
Identify the most-viewed videos on your platform
Understand where and when content is viewed
Track viewing trends to inform content and delivery decisions
For more information, see Playback Data Statistics.

Health status monitoring
The Alibaba Cloud Health Status page shows the real-time operational status of all Alibaba Cloud services by region. Subscribe to RSS feeds to receive automatic notifications when a service exception occurs.
To subscribe: in the RSS column of the product status table, click the RSS icon for the service you want to monitor.
CloudMonitor
ApsaraVideo VOD is integrated with CloudMonitor. Use its basic features free of charge to monitor CDN domain name metrics and playback quality metrics in real time.
For setup instructions, see Use CloudMonitor to view metrics and configure alerts for VOD domain names and playback quality.
Custom alert rules
CloudMonitor supports custom alert rules so you get notified before issues affect users. Key concepts:
Rule: a threshold condition on a metric that triggers an alert
Alert blacklist: a policy that suppresses alert notifications for a specific metric during a defined period
Set an alert rule for any metric and receive notifications by phone, SMS, email, DingTalk chatbot, or through the Alibaba Cloud app.
To create custom monitoring dashboards for your own metrics, see Manage charts on a custom monitoring dashboard.
To suppress alerts for a metric during maintenance or known incidents, see Create an alert blacklist policy.
Cloud Config
ApsaraVideo VOD is integrated with Cloud Config. Use it free of charge to track configuration history and audit your cloud resources for compliance. Cloud Config monitors resource configuration changes continuously and flags non-compliant resources.
Resource configuration detection
Cloud Config detects operational records for your Alibaba Cloud account and all associated RAM users. By default, it records resource configuration changes every 10 minutes.
MLPS 2.0 cloud pre-check
Cloud Config translates MLPS 2.0 regulations into automated checks for cloud resource configurations. Enable the MLPS 2.0 cloud pre-check feature with a single click, and Cloud Config monitors your resources for compliance continuously. Download the pre-check report and submit it to an inspection agency for filing.
Real-time query and analysis of audit data
Deliver resource configuration change histories and non-compliant event data to a Logstore in Simple Log Service (SLS). Once delivered, use SLS to centrally query and analyze the log data.
For setup instructions, see Deliver data to Simple Log Service.
ActionTrail
ApsaraVideo VOD is integrated with ActionTrail, which records all user logins and resource access activities in your account. Use ActionTrail for:
Security analytics: detect anomalous access patterns
Intrusion detection: identify unauthorized access attempts
Resource change tracking: audit who changed what and when
Compliance auditing: maintain a complete activity log for audit submissions
ActionTrail captures operations performed through the Alibaba Cloud console, OpenAPI, and developer tools. For a list of supported audit events, see Audit events of ApsaraVideo VOD.
By default, ActionTrail retains events from the last 90 days. To retain logs beyond 90 days, create a trail to deliver event records to Simple Log Service (SLS) or Object Storage Service (OSS). For setup instructions, see Create a trail.
After delivering events to SLS or OSS, query or analyze them directly in those consoles. For more information, see Query events in the SLS or OSS console.
To track events older than 90 days that predate trail creation, submit a ticket to request the required permissions.
Log download
ApsaraVideo VOD lets you query and download raw CDN access logs for any accelerated domain name. Logs from the last 30 days are available for download.
For more information, see Log download.
Simple Log Service
ApsaraVideo VOD is integrated with Simple Log Service (SLS), Alibaba Cloud's log collection and analytics platform. Deliver real-time logs from ApsaraVideo VOD accelerated domain names to SLS for real-time analytics.
ApsaraVideo VOD provides a built-in log analytics template. Logs are retained for 7 days. After delivery, use SLS to query, analyze, download, deliver, and transform logs, and create alerts.
To configure real-time log delivery, see Configure real-time log delivery.
To query, analyze, or export logs after delivery, see Common operations on logs of Alibaba Cloud services.