Stress test Spring Cloud services
Application stress testing lets you measure system performance and gather key metrics. These metrics help you configure optimal protection rules to ensure high availability for your services. This topic describes how to stress test Spring Cloud services.
Prerequisites
Your application is connected to AHAS Application Protection. For more information, see Connect an application.
Background
Application stress testing is available only if the following conditions are met:
- The application SDK version is 1.8.5 or later.
- Application Protection is in advanced protection mode.
- The application is in a non-public network environment.
Step 1: Create a stress testing scenario
Log on to the AHAS console, and then select a region in the upper-left corner of the page.
In the left-side navigation pane, choose .
On the Application Protection page, click the target application card on the application cards tab.
In the left-side navigation pane of the application details page, choose API details, and then click the web service tab.
On the API details page, click the
 icon.
icon.In the Stress Test Configuration panel, configure the parameters on the Scenario Configuration and stress configuration tabs.
The following table describes the parameters on the Scenario Configuration tab.
Parameter
Description
Example
Scenario name
The name of the stress testing scenario.
test-springcloud
Service address
The IP address and port number. You can specify the actual port of your application. Separate multiple service addresses with a comma (,).
192.168.xx.xx:8080
192.168.xx.xx,192.168.xx.xx:8081
URI path
The request path.
/demo
Request method
The request method. Valid values are GET, POST, PUT, and DELETE.
NoteGET and DELETE methods support only the URL path.
POST
Request header
For supported Content-Type and parameter formats, see Spring Cloud reference examples.
Content-Type: application/json
Request parameter
The request parameters. For supported Content-Type and parameter formats, see Spring Cloud reference examples.
NoteRequest parameters are required for POST or PUT methods.
{"name": "cart", "age": 20}
Timeout (ms)
The timeout in milliseconds (ms).
1000
Print log
Specifies whether to automatically print log information. Enabling this feature may affect performance. We recommend disabling it during formal stress tests.
Off
The following table describes the parameters on the Stress Configuration tab.
Parameter Description Stress test mode Transactions per Second (TPS) mode. Traffic model The traffic model. Valid values are fixed pressure, stepped pressure, and spiky pressure. - Fixed pressure: Applies a constant load based on the configured TPS value. During the public preview, the maximum TPS is 1,000.
- Stepped pressure: Applies a load that gradually increases from a minimum value to a maximum value over a specified ramp-up period. After reaching the maximum, the load is sustained.
- Spiky pressure: Applies a load that fluctuates between a peak and a valley value in a sawtooth pattern, based on the configured durations.
TPS The target TPS. The maximum value is 1,000. Test duration (minutes) The duration of the stress test. During the public preview, the duration must be between 3 and 10 minutes.
Step 2: Run the stress testing task
After you create a stress testing scenario, you can run the stress testing task.
- In the Stress Test Configuration panel, click Save Configuration and Start Stress Test.Note
Preparing the testing environment can take about a minute.
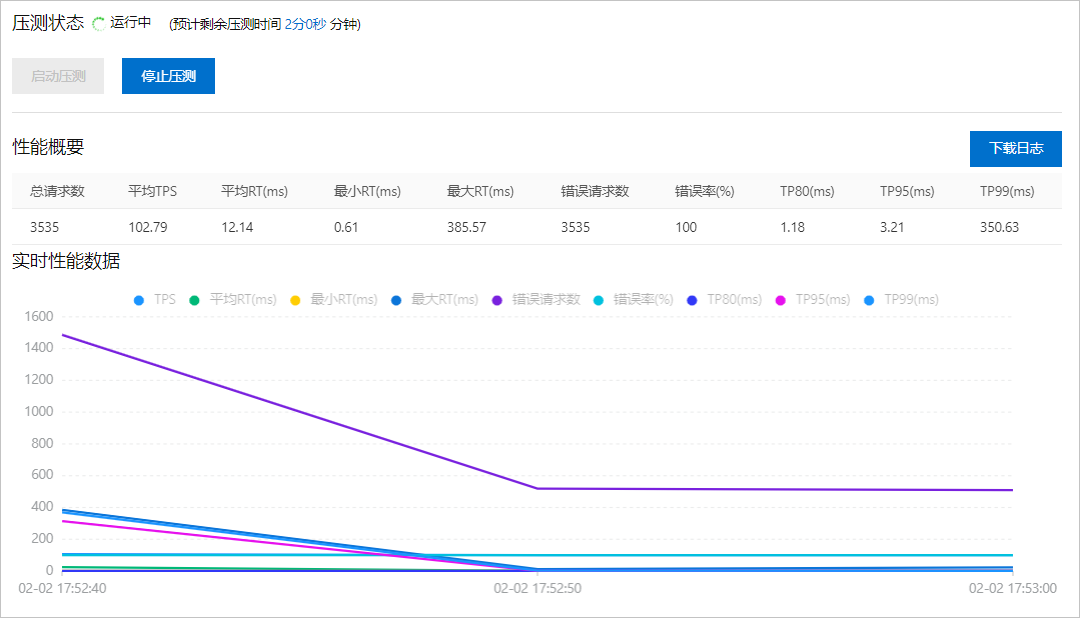
- You can view real-time performance metrics in the Performance Summary and Real-time Performance Data sections.
Step 3: View the stress testing report
After the stress test is complete, you can view the stress testing report.
- In the left-side navigation pane of the application details page, choose application stress testing. Find your target scenario and click Details in the Actions column.
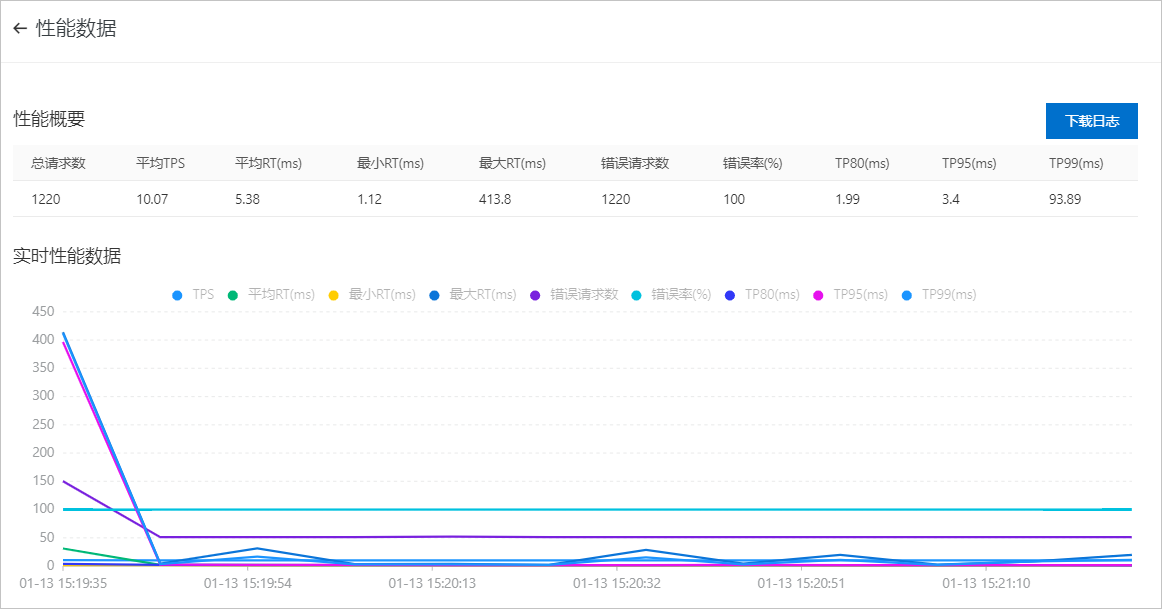
- In the Performance Data panel, view the stress testing report.
 Note
NoteThe Real-time Performance Data section displays aggregated data from all load generators every 10 seconds. The interval may vary depending on the test duration. Click a legend item above the chart to show or hide the corresponding data series.
Parameter Description Total requests The total number of requests initiated during the stress test. Average TPS The average TPS across all load generators during the test. TPS = Total Requests / Total Runtime. Average RT (ms) The average response time across all load generators. Min RT (ms) The minimum response time recorded across all load generators. Max RT (ms) The maximum response time recorded across all load generators. Failed requests The total number of failed requests across all load generators. Failure rate The average failure rate across all load generators. TP80 (ms) The average 80th percentile (P80) response time across all load generators. TP95 (ms) The average 95th percentile (P95) response time across all load generators. TP99 (ms) The average 99th percentile (P99) response time across all load generators. - In the Performance Data panel, click Download Logs to download the logs generated during the stress test.
Step 4: Configure protection rules
Based on the stress testing report results, you can configure protection rules in AHAS Application Protection. In the left-side navigation pane of the application details page, choose rule management. For more information, see Configure throttling rules.
Spring Cloud reference examples
Content-Type | Parameter format |
application/x-www-form-urlencoded | [{"name": "cart"},{"age": 20}] |
application/json (Default) | {"name": "cart", "age": 20} |