Add a CSV file
This document describes how to add a CSV file as a data source in DataV.
Prerequisites
You have a CSV file ready to be added as a data source.
Procedure
Log on to the DataV console.
On the My Data tab, select Data Source Management and click Add Data.
From the Type list, select CSV File.
Upload the CSV file.
NoteThe CSV file cannot exceed 512 KB.
Click OK to add the data source.
FAQ
CSV file format issues
Save original files, such as Excel files, as CSV files. Do not change the file format by only renaming the file extension, because this will cause a fault.
DataV console compatibility issues
Because Google Chrome restricts the HTTP protocol, you must open the DataV console using an HTTPS URL to add a CSV file as a data source.
Static data example
[
  {
    "x": "Jan",
    "y": 2,
    "s": "Precipitation"
  },
  {
    "x": "Jan",
    "y": 2.6,
    "s": "Evaporation"
  },
  {
    "x": "Feb",
    "y": 4.9,
    "s": "Precipitation"
  },
  {
    "x": "Feb",
    "y": 5.9,
    "s": "Evaporation"
  },
  {
    "x": "Mar",
    "y": 7,
    "s": "Precipitation"
  },
  {
    "x": "Mar",
    "y": 9,
    "s": "Evaporation"
  },
  {
    "x": "Apr",
    "y": 23.2,
    "s": "Precipitation"
  },
  {
    "x": "Apr",
    "y": 26.4,
    "s": "Evaporation"
  },
  {
    "x": "May",
    "y": 25.6,
    "s": "Precipitation"
  },
  {
    "x": "May",
    "y": 28.7,
    "s": "Evaporation"
  },
  {
    "x": "Jun",
    "y": 76.7,
    "s": "Precipitation"
  },
  {
    "x": "Jun",
    "y": 70.7,
    "s": "Evaporation"
  },
  {
    "x": "Jul",
    "y": 135.6,
    "s": "Precipitation"
  },
  {
    "x": "Jul",
    "y": 175.6,
    "s": "Evaporation"
  }
]
Data format example
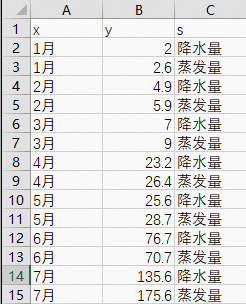
In a CSV file, the first row contains the field names, such as x, y, and s. The subsequent rows contain the corresponding field values. Based on the static data in the preceding example, the content of the CSV file is as follows.
Demo
This demo uses a line chart to demonstrate how to import a CSV file into DataV. The file contains data about monthly precipitation and evaporation from January to July.
Log on to the DataV console.
On the My Visualization page, select a visualization application and click Edit.
On the canvas editor page, add the Line Chart widget.
On the Data panel, click Configure Data Source.
Set Data Source Type to CSV File.
In the Select Existing Data Source section, click New to add a CSV data source.
Import the local Precipitation and Evaporation.csv file and click OK.
In the Select Existing Data Source section, select the data source for the imported CSV file. The chart does not display any content yet.
Map the
colorFieldfield to thesfield. As shown in the figure, the chart is now displayed correctly.