The analyzer is built on DataV datasets and the widget analysis mode. It adds interactive and dynamic data query features, such as drill-down and filter interactions, to widgets. The analyzer uses your feedback to change the data model, which creates a complete visual analytics loop within your application. You can use all interactions in preview mode and in published applications. This topic describes how to use the interaction features of the analyzer.
To configure analyzer interactions, you must first create a widget in analysis mode. For more information about how to create a widget that supports analysis mode and enter analysis mode, see Enter widget analysis mode. After you create the analysis widget, an analyzer wraps it. The layer tree shows the widget as follows:
Before you use analyzer interactions, you must disable the scanline animation.
All analysis interactions are available in preview mode and in published applications.
Analyzer configuration panel
In the canvas editor, click the analyzer in the layer list. Alternatively, select a BI analysis widget on the canvas and then click the  icon in the upper-right corner of the widget to select the corresponding analyzer. After you select the analyzer, you can configure its style parameters in the Configuration panel on the right.
Breadcrumb: Configures the style of the area within the analyzer that displays the drill-down interaction effect and path.
Parameter
Description
Show
Turn on the switch to show the breadcrumb. Turn off the switch to hide the breadcrumb.
Layout
Sets the layout of the breadcrumb around the corresponding analysis widget. Options include Top Left, Top Center, Top Right, Bottom Left, Bottom Center, and Bottom Right.
Position
Sets the position of the breadcrumb relative to the analysis widget. Options include Inside or Outside.
Text Style
Sets the style of the text within the breadcrumb, including the font, font weight, font size, and text color.
Menu Bar: Configures the style of the menu bar within the analyzer that displays the data refresh and copy traceId interaction features.
Parameter
Description
Show
Turn on the switch to show the menu bar. Turn off the switch to hide the menu bar.
Layout
Sets the layout of the menu bar around the corresponding analysis widget. Options include Top Left, Top Center, Top Right, Bottom Left, Bottom Center, and Bottom Right.
Position
Sets the position of the menu bar relative to the analysis widget. Options include Inside or Outside.
Size
Sets the size of the menu bar. The default value is 48.
Info Label: Configures the style of the info label that displays the name of the analysis widget and the filter interactions that affect its data.
Parameter
Description
Show
Turn on the switch to show the info label. Turn off the switch to hide the info label.
Layout
Sets the layout of the info label around the corresponding analysis widget. Options include Top Left, Top Center, Top Right, Bottom Left, Bottom Center, and Bottom Right.
Position
Sets the position of the info label relative to the analysis widget. Options include Inside or Outside.
Size
Sets the style of the info label text, including the font, font weight, font size, and text color.
Error Message: Sets the text style for analyzer error messages, including the font, font weight, font size, and text color.
Analyzer data panel
The analyzer does not require data configuration.
Analyzer interaction panel configuration
To configure analyzer interactions, click the Interaction panel on the right side of the canvas.
Analysis exploration
Parameter
Description
Drill-down priority
When Drill-down priority is selected, clicking a widget in preview or published mode first triggers a drill-down. If no further drill-down is possible, a selection is triggered.
Selection priority
When Selection priority is selected, clicking a widget in preview or published mode first triggers a selection for filter interaction.
Filter interaction: When you drill down or make a selection in preview or published mode, other linkable widgets are filtered based on the drill-down scope or selected item. The following filter interaction configuration features are supported.
NoteOnly widgets that use the same dataset can be linked for filter interactions.
Feature
Operation
View supported interactions
Different BI analysis widgets within the same analyzer may not support all interaction features. You can view the supported interactions for each BI widget by checking the icon to the right of the widget in the filter interaction panel.
Select BI analysis widgets for filter interaction
Select one or more BI analysis widgets wrapped in the same analyzer. After selection, you can configure filter interaction effects.
Select filter interaction effect
For each selected widget, configure the corresponding filter interaction effect. The effects include Trigger filter interaction in other widgets or Accept filter interaction from other widgets.
NoteWidgets that interact with each other must use the same dataset.
Go to widget interaction
Click the
 icon to the right of a BI analysis widget that supports filter interactions to go to its interaction panel. You can then customize the widget's interaction features.
Basic analyzer interaction features
The analyzer is the basic unit for all analysis interactions. If multiple analysis widgets are within the same analyzer, they share analysis interaction controls and some interaction configuration features.
Multiple analysis widgets are placed within the same analyzer only when you add multiple analysis mode sub-widgets to a Basic Plain Map 3.0 widget in the canvas editor.
After you select an analyzer, you can find its interaction settings in the Interaction panel on the right. In this panel, you can configure the drill-down and filter interaction features for the BI analysis widgets that the analyzer contains.
When you preview or publish a visualization application and hover over an analysis widget, you can access the following basic interaction features of the analyzer.
Feature |
Description |
Refresh data |
Click the |
Copy traceId |
Click the |
Change trigger effect |
Click the
Note
The effect option switched in the breadcrumb is temporary. When the page for the previewed or published application is refreshed, the settings revert to the original configuration in the analyzer's interaction panel. |
Show drill-down path |
After you configure drill-down fields in the widget's data panel, you can click to perform drill-down interactions in preview mode and in the published application. After a drill-down, the widget's breadcrumb (top left by default) shows the current drill-down path. Click the breadcrumb menu to return to a specific drill-down level. |
Filter interaction |
Analysis widgets can interact with each other. You can click an option to filter data. For two analysis widgets to interact, they must meet two conditions:
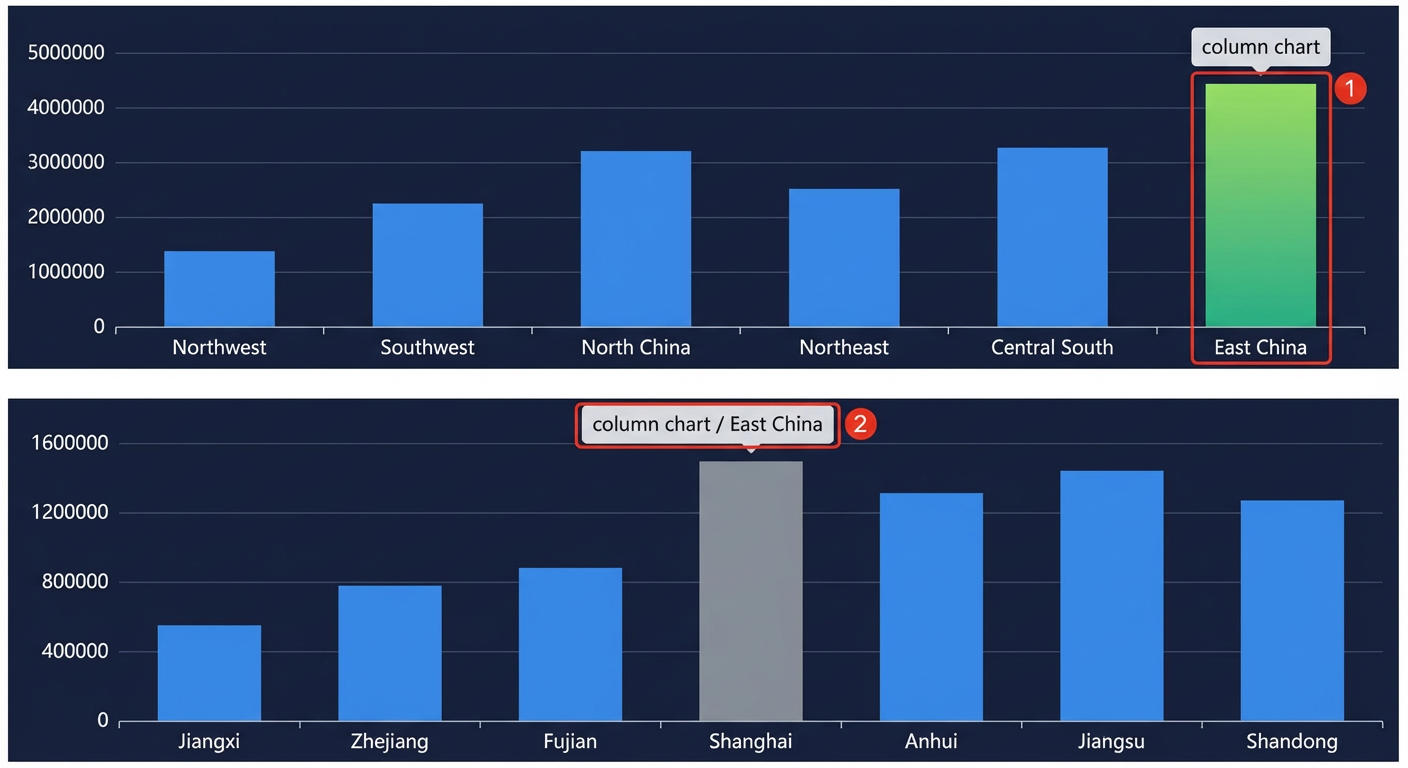
When filter interaction is enabled, if you drill down on a selected item, the linked widget filters and displays the corresponding data. For example, if you drill down on East China in the region widget, the linked widget that uses the same dataset filters the data to show results where Region=East China.
Note
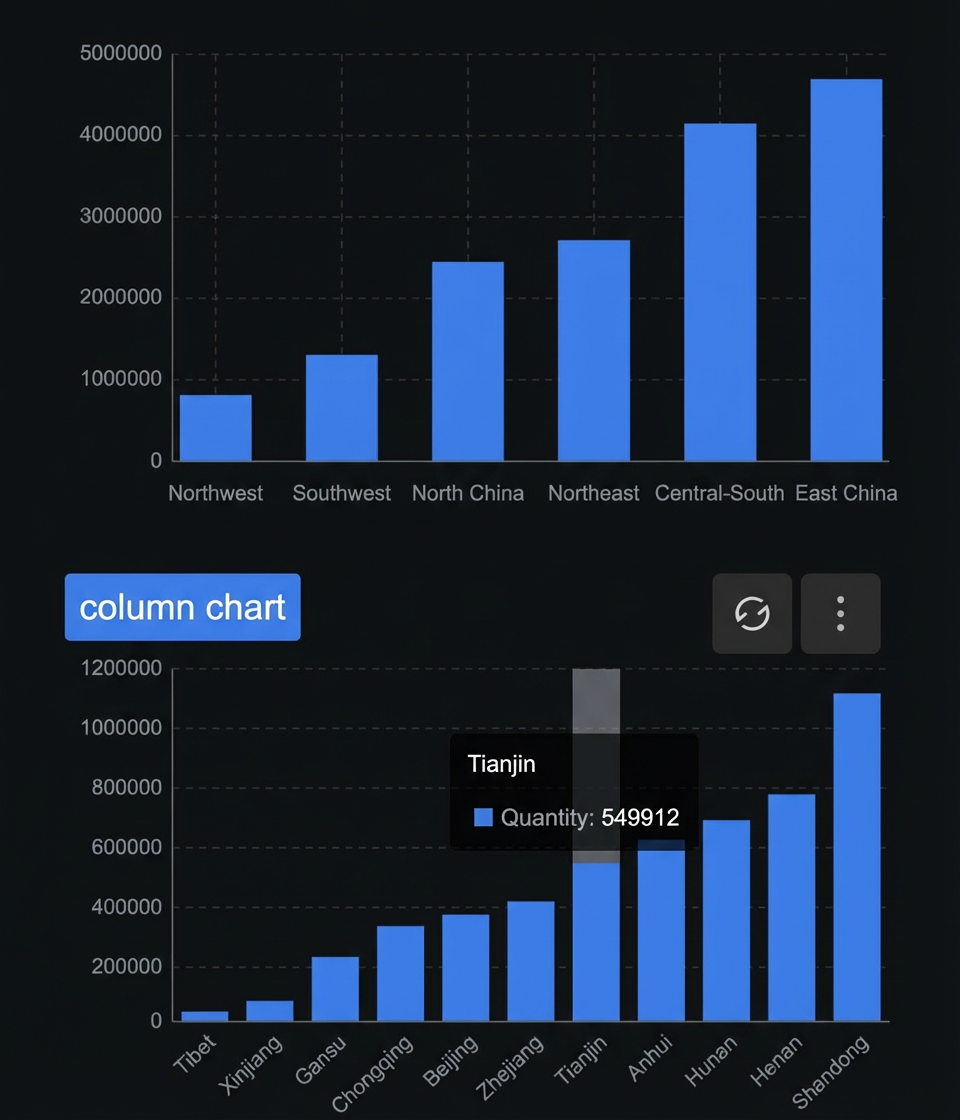
An analysis widget interacts with other widgets on the same screen. The interaction is bi-directional. You can disable some interactions in the filter interaction configuration. Figure 1. Before widget filter interaction Figure 2. Widget filter interaction effect |
 icon in the widget's menu bar (top right by default) to refresh the data for the analyzer and its corresponding analysis widget.
 icon in the widget's menu bar (top right by default) and select Copy traceId. If the analyzer has a problem, you can report the copied ID to DataV technical support for help to resolve the error.
 or
or  icon in the widget's breadcrumb (top left by default). In the drop-down list, you can switch between drill-down priority and selection priority.
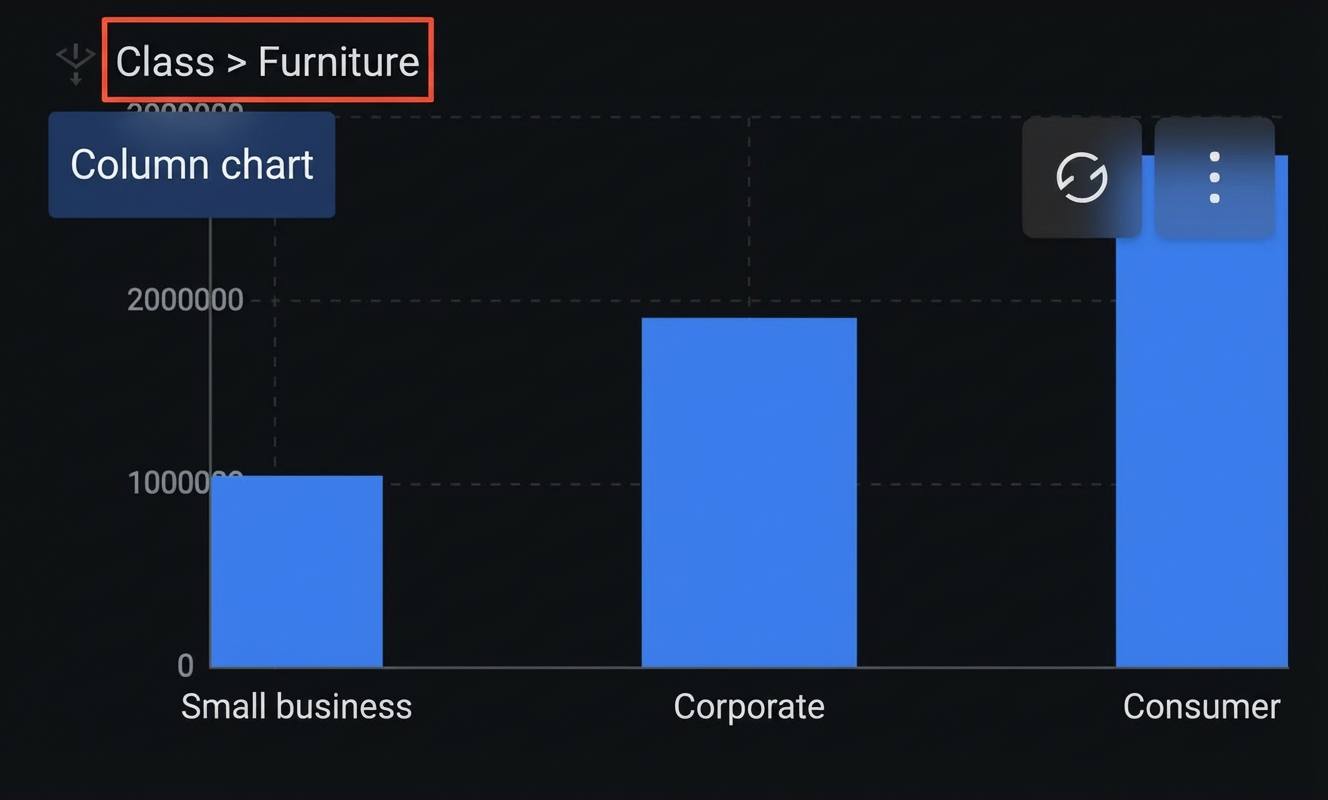
Analysis widget interaction style configuration
If Selection priority is set for interactions between linked widgets in an analyzer, you can also configure parameters such as the trigger method and selection method for the selected state. You can find these settings in the Interaction > Selected State section of the style configuration panel for each analysis widget.
The configuration items vary slightly for different widgets. For more information, see BI analysis widgets.
Quickly go to the analyzer configuration panel from the analysis widget configuration panel
When you configure a BI analysis widget, you can use the following two methods to quickly access the configuration panel of the corresponding analyzer:
Click Configure Analyzer Interaction at the bottom of the interaction panel of the BI analysis widget to open the interaction panel of the analyzer.
Click Configure Analyzer Style at the bottom of the style configuration panel of the BI analysis widget to open the style configuration panel of the analyzer.
Analyzer blueprint editor interaction configuration
Although you cannot export a BI analysis widget to the blueprint editor to configure associated interactions, you can export its corresponding analyzer. You can then configure blueprint-related events and actions for the analyzer.
In the canvas editor, right-click the analyzer for the BI analysis widget in the layer list and select Export to Blueprint Editor.
- Click the
 icon in the upper-left corner of the page.
 On the blueprint editor configuration page, click the Analyzer|xxx node in the imported nodes list. The configuration parameters for the analyzer appear on the blueprint editor canvas, as shown in the following figure.
Events
Event
Description
When drill-down or selection changes
When a drill-down or selection change event is triggered, a data item of the object type is thrown to automatically control the data analysis display. It must include the following fields:
{
  "id": "",                    // The ID of the analyzer where the drill-down or selection occurred.
  "drillStack": [              // Records the drill-down path.
    {
      "comId": "",             // The ID of the widget that initiated the drill-down.
      "datasetId": 96,         // The ID of the dataset used for the drill-down.
      "fields": [              // Detailed information about the drill-down, stored by column.
        {
          "chartKey": "x",
          "code": "L",
          "alias": "region",
          "dateTimeGranularity": "",
          "geoFormat": "",
          "values": [          // The actual values stored in the database.
            "East China"
          ],
          "displayValues": ""  // Differs from the actual database value if a geographic transformation is applied.
        }
      ]
    }
  ],
  "brushes": [                // Records the selected content of all widgets/sub-widgets.
    {
      "comId": "",            // The ID of the widget that initiated the selection.
      "selections": [         // Detailed information about the selection, stored by column.
        {
          "chartKey": "x",
          "code": "L",
          "alias": "region",
          "dateTimeGranularity": "",
          "geoFormat": "",
          "values": [
            "East China"
          ],
          "displayValues": ""
        }
      ]
    }
  ]
}
Actions
Action
Description
Drill Down
When a drill down action is performed, pass data of the object type. It must include the following fields:
{
  "id": "",      // The ID of the widget to drill down. This is required when the analyzer wraps multiple sub-widgets.
  "items": [     // The data items to select. For a single selection: {x:'Shanghai',y:100}. For a batch selection: [{x:'Shanghai',y:100},{x:'Shenzhen',y:75}].
    {
      "any": ""   // any
    }
  ]
}
Drill Up
When a back off drill down action is performed, pass data of the object type. It must include the following fields:
{
  "depth": 0,          // The level to back off to. 0 clears the drill-down, and -1 backs off one level.
  "forceClear": false  // The default value is false. If set to true, it forces the selection to be cleared even if no actual backoff occurs.
}
Select
When a select action is performed, pass data of the object type. It must include the following fields:
{
  "id": "",       // The ID of the widget to select from. This is required when the analyzer wraps multiple sub-widgets.
  "items": [      // The data items to select. For a single selection: {x:'Shanghai',y:100}. For a batch selection: [{x:'Shanghai',y:100},{x:'Shenzhen',y:75}].
    {
      "any": ""   // any
    }
  ]
}