The DataV widget analysis mode offers a different creation pattern than the standard data and style configuration of widgets. This mode features a data-centric flow with automated style configuration and exploratory view construction. It optimizes how data is attached to views, which makes it easier to create visualization applications from data-generated models. This topic describes three methods to enable the Business Intelligence (BI) analysis mode for a widget.
Enable analysis mode by creating a BI analysis widget
You can add three types of BI analysis widgets in the canvas editor:
BI analysis chart widgets: In the asset panel, click the BI Analysis module. Click or drag a chart widget from the module list to the canvas. The widget automatically enters analysis mode. When you add the widget, the Change Dataset dialog box automatically appears. Customize the dataset content to start the data-centric creation flow for the BI analysis mode widget.
Figure 1. Select a BI analysis chart widget
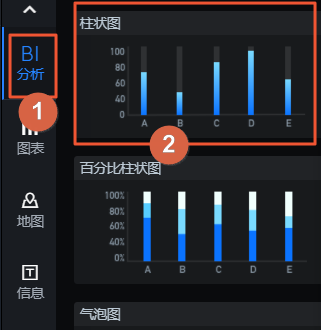
Figure 2. Change the dataset
Figure 3. Enter the analysis mode data panel
BI analysis sub-widgets: In the asset panel, click the BI Analysis module. Click or drag a sub-widget that supports analysis mode from the module list to the canvas. This lets you quickly create a map widget in analysis mode that contains specific types of sub-widgets.
Figure 4. Add a specific sub-widget
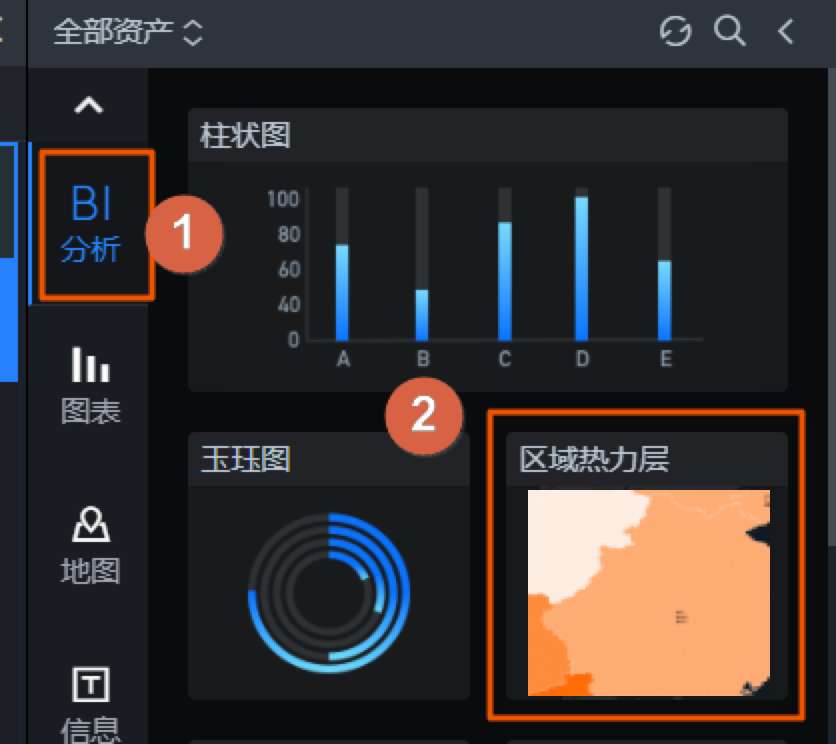
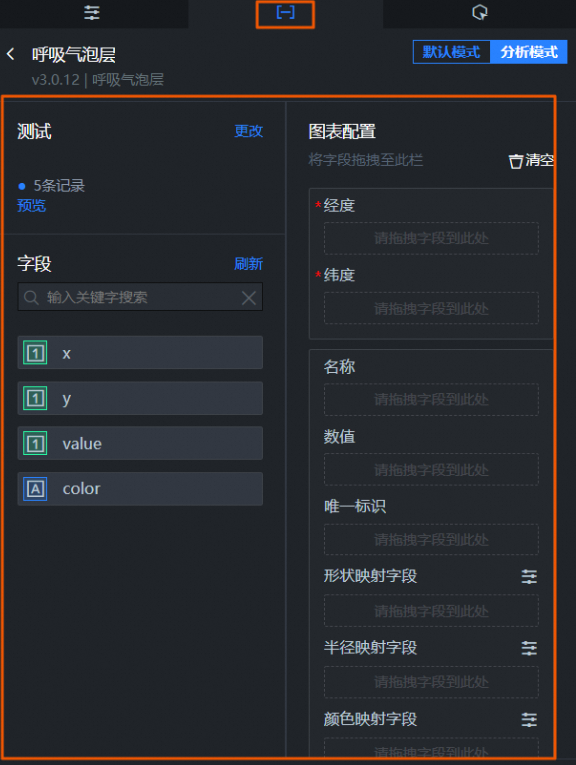
Figure 5. Enter the sub-widget analysis mode
 Note
NoteThe BI Analysis module currently contains a limited number of chart widgets and sub-widgets. More types of BI analysis widgets will be added in the future. For more information about the widgets, see BI Analysis Widgets.
Map sub-widgets: In the asset panel, click the Map module. Click or drag the Basic Flat Map 3.0 widget to the canvas. In the sub-widget management panel of the map, enable Create in Analysis Mode. Then, in the creation panel, select the sub-widgets to add to enter the map sub-widget analysis mode.
Figure 6. Select the Basic Flat Map 3.0 widget
Figure 7. Add an analysis mode sub-widget
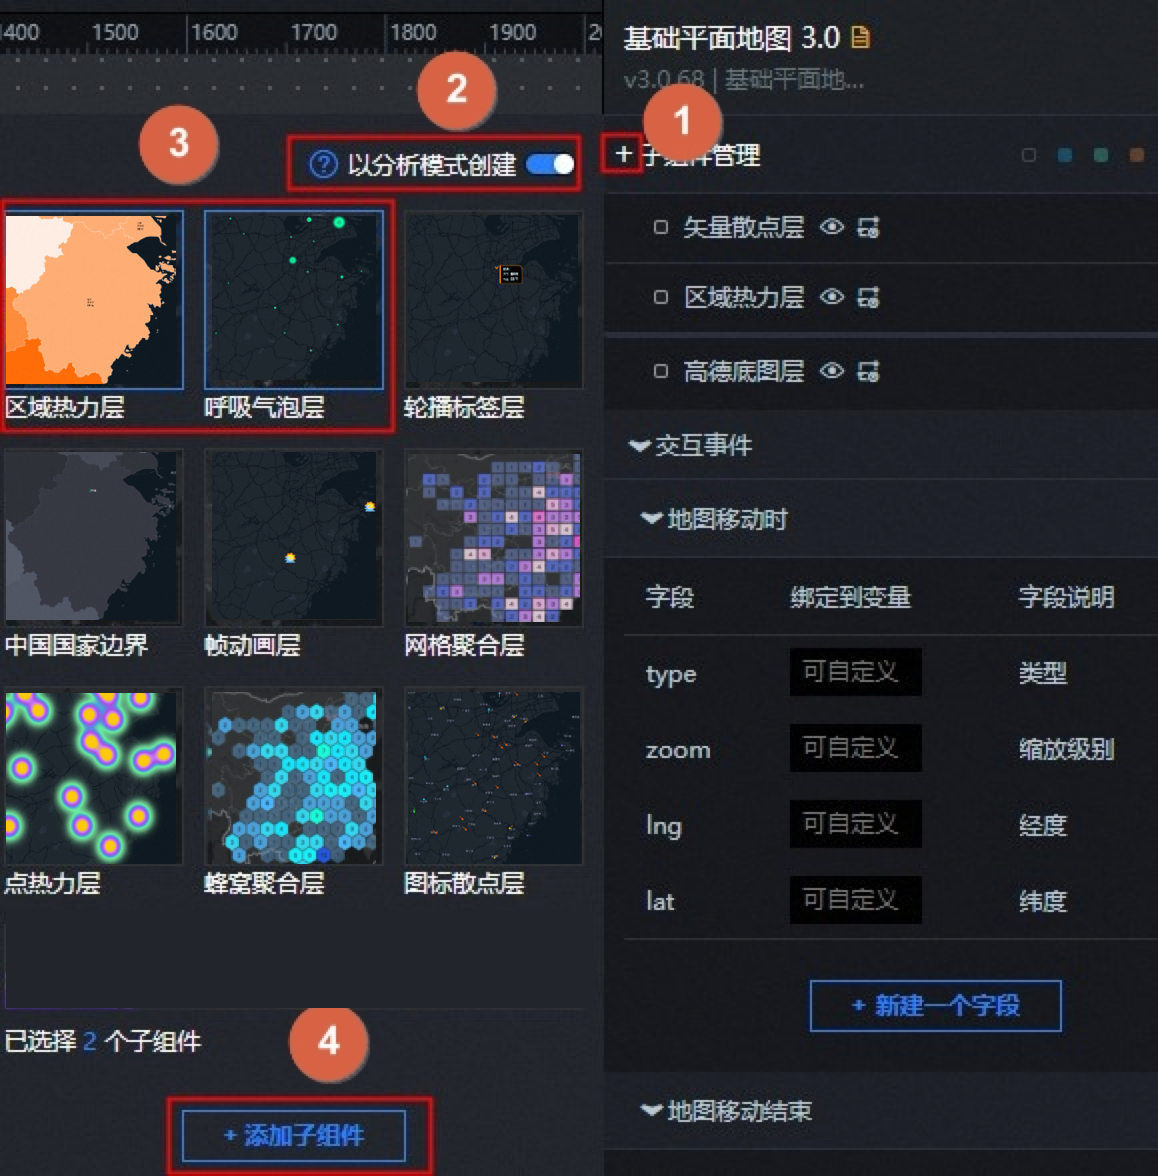
Figure 8. Click a sub-widget to enter the analysis mode panel
Switch to analysis mode from the context menu
Currently, only a few widgets support switching to BI analysis mode from the context menu. These include some v5.x regular widgets, widgets from the BI Analysis module, and the Basic Flat Map 3.0 widget that contains sub-widgets that support analysis mode.
For a v5.x chart widget that supports analysis mode, right-click the widget to open the context menu. Click Switch to Analysis Mode.
When you switch a Basic Flat Map 3.0 widget that contains multiple sub-widgets to analysis mode from the context menu, the Select Widgets to Switch to Analysis Mode dialog box appears. In the dialog box, check one or more sub-widgets to switch to analysis mode. After you make your selections, click OK to complete the switch.
To exit analysis mode for a widget, right-click the widget and select Exit Analysis Mode.
Switch to analysis mode from the widget data panel
Currently, only a few widgets support switching to analysis mode from the upper-right corner of the data panel. These include some v5.x regular widgets, BI analysis widgets, and sub-widgets that support analysis mode within the Basic Flat Map 3.0 widget.
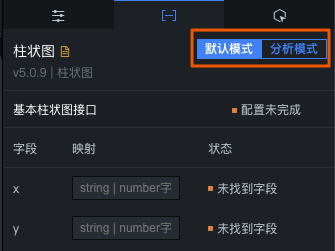
On the data panel of a widget that supports analysis mode, you can switch between two modes in the upper-right corner: Default Mode and Analysis Mode.
Default Mode: Configure the widget's data using the standard data configuration method. For more information, see Configure Asset Data.
Analysis Mode: This mode uses the data-centric flow with automated style configuration and exploratory view construction. For more information, see Introduction to the BI analysis mode data panel.
When a widget on the canvas is switched to analysis mode for the first time, an analyzer is also created. For more information about the features of the analyzer, see BI analyzer interaction guide.