This topic describes the limitations of BI analysis mode, operations that change its behavior, and default automatic configurations.
Limitations for widgets in BI analysis mode
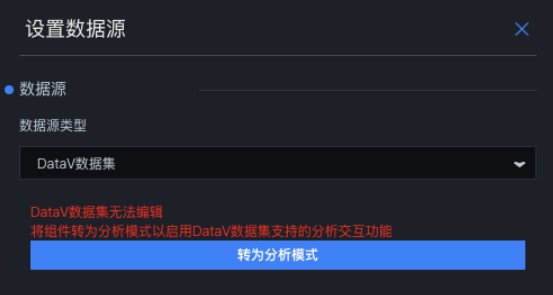
- Widgets can only use DataV datasets as data sources.
- Data filters cannot be added or used.
- If a widget has multiple data interfaces, only its primary data interface can be configured.
Operational changes in analysis mode
- Restricted operations
Operation Description Layer movement An analyzer can contain only one widget. Dragging another widget into the analyzer fails and causes an error. An analysis mode widget cannot be dragged by itself. If you try, a prompt asks if you want to move the analyzer along with the widget. Copy and favorite An analysis widget cannot be copied or favorited by itself. The editor prompts you to ask if you want to copy or favorite the analyzer along with the widget. Export to blueprint Analysis mode widgets cannot be exported to a blueprint. However, an analyzer can be exported to a blueprint. For more information, see Analyzer blueprint editor interaction configuration. Convert to block Analysis mode widgets and analyzers cannot be converted to blocks. Groups or form groups that contain analysis mode widgets also cannot be converted to blocks. - Operations with changed behavior
Operation Description Delete a component When you delete an analysis mode widget, the analyzer is also deleted. Add or delete sub-widgets When you create an analysis mode sub-widget on a map that is not in analysis mode, a prompt asks if you want to switch to analysis mode and add an analyzer. When the last analysis mode sub-widget is deleted from a map in analysis mode, a prompt asks if you want to exit analysis mode and delete the analyzer.
Automatic system configurations for BI analysis widgets
When you configure widget interactions, the system automatically adjusts some settings to reduce manual steps and improve your workflow. The following operations can be configured automatically:
- Automatically enable the mapping for the corresponding visual channel, such as color, size, and shape, when you add a field.
- Automatically disable the mapping for the corresponding visual channel and revert to a static field when you delete a field.
- Automatically select an aggregation method when you add a field.
- Automatically select a geographic role, such as longitude, latitude, or adcode.
Data compatibility for legacy analysis widgets
Legacy analysis widgets that are already on the canvas and have configured data can continue to display that data. However, you cannot modify the data. To modify the data, you must convert the widget to analysis mode. The original field configuration is preserved.
You can find information about legacy analysis widgets on the
tab.
Recommended widgets and sub-widgets for analysis mode
The following widgets and sub-widgets can be created in analysis mode:
- BI analysis widgets:
- Bubble chart
- Column chart
- Bar chart
- Percentage column chart
- Range column chart
- Waterfall chart
- Gauge
- Jade Ring Chart
- Percentage bar chart
- Pie chart
- Classification: Rose
- Radar chart
Note For more information about BI analysis widgets, see BI analysis widgets. - Basic Flat Map 3.0:
- Vector scatter layer
- Icon scatter layer
- Choropleth layer (supports only provincial administrative regions)
- Animated bubbles layer
- Carousel label layer
- China national border
- Custom area drill-down layer
- Flying routes layer
- Points heatmap layer
- Isosurface layer
- Grid aggregation layer
- Hexagon aggregation layer
- Trajectory layer
- Symbol aggregation layer
Note The list of widgets that support BI analysis mode is continuously updated. More widgets will be supported in the future.
该文章对您有帮助吗?