Configure the data source for a widget
Updated at:
In DataV, you can configure a data source for an asset on the Configure Data Source page, where you specify the data source type and script, apply data filters, and preview data response results.
Configure a data source
Log on to the DataV console.
- On the My Visualizations page, click Edit above the project that you created.
- In Canvas Editor, click an asset in the Layer column or on the canvas. Important Before searching for asset configurations, make sure that the corresponding assets have been added to your visualization application project. Otherwise, you need to add the assets first. For more information, see Asset management (Enterprise Edition).
- On the right of the canvas editor, click the Data icon.
- On the Data tab, click Set.
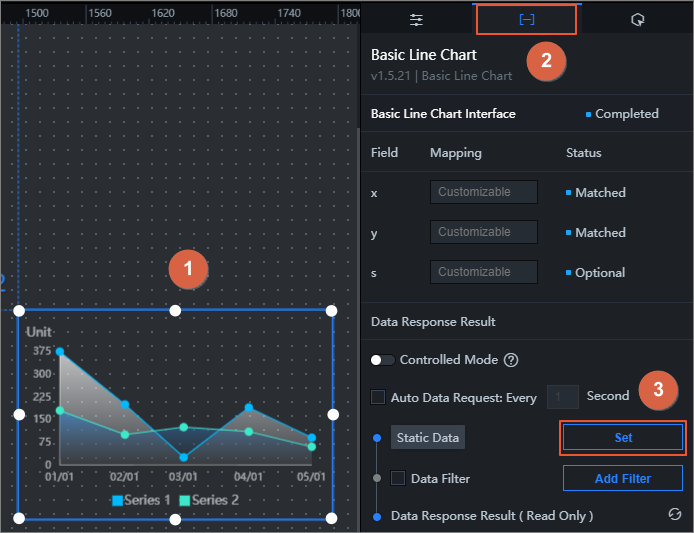
- In the Set Data Source pane, modify the data source type and script, configure a data filter, and preview the data response.
Modify the data source type and script
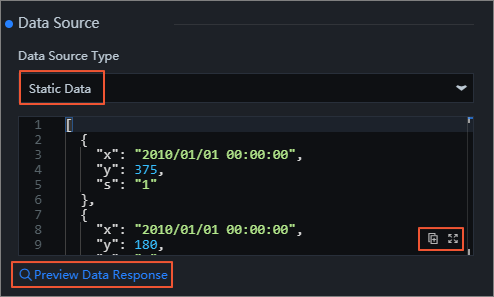
- In the Set Data Source pane, select a data source type from the Data Source Type list.
For more information about the supported data source types and configurations, see Manage data sources.Note If you use an API data source, you can configure cross-origin access and obtain cookies of user clients. For more information, see How to configure cross-domain data and How to use cookies to isolate data in visualization applications.
- In the editing box, modify the data source script.
In the lower-right corner of the editing box, click the
 icon to edit the data source script in full screen. Click the
  icon to copy the data source script.
 - After you configure the script, click Preview Data Response to preview the response result.
Configure a data filter
Use data filters to convert data structures, filter data, and perform simple calculations.
- In the Set Data Source pane, select Data Filter to enable the data filter function.
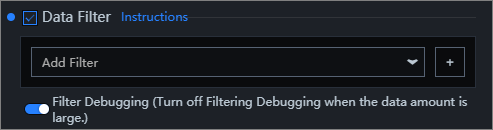
- Click the plus sign (+) on the right to add a data filter.
- In the filter code editor, enter the filter code of the current asset data.
- Click Test to view the filter result.
For more information about data filters, see Data filters.
View fields in the data response result
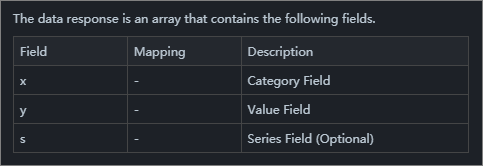
DataV assets typically return data response results in list form. The list shows the fields, mappings, and field descriptions of the asset. 
View the data response result
In the Set Data Source pane, view the data response result in the Data Response Result section.
Data Response Result displays the data that the asset uses in real time. When the data source changes, the latest data is shown. If the response is delayed, click the  icon on the right to refresh.
In the lower-right corner of the data editing box, click the icon to view the data response result in full screen. Click the icon to copy the data response result.
icon to view the data response result in full screen. Click the icon to copy the data response result. 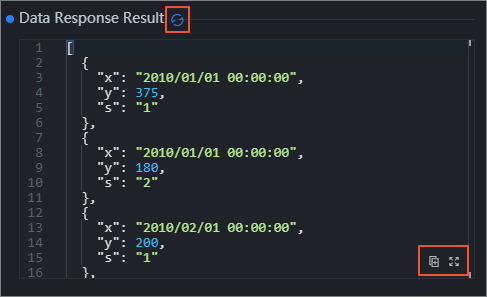
Is this page helpful?