This tutorial describes the basic concepts of the DataV analysis mode. This mode lets you analyze data in a flexible, no-code, and automated way. It supports data drill-down and filter interaction analysis.
Prerequisites
Before you learn about the widget analysis mode, you need to understand DataV 6.0 datasets. For more information, see Introduction to DataV 6.0 datasets.
Enter the widget analysis mode
Method one: Create from the Assets panel
Log on to the DataV console.
On the My Visualizations page, click the Edit button for the visualization application project that you created.
In the canvas editor, click the BI Analysis module. Drag a widget to the canvas to create an analysis widget. This action opens the widget analysis mode.
Method two: Convert using the context menu
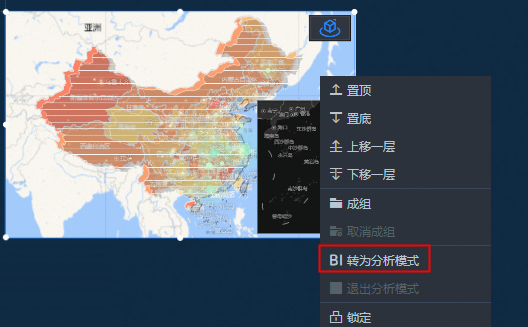
Right-click a widget that supports analysis mode, or a map with child widgets that support analysis mode. From the context menu, click Switch to Analysis Mode to convert the widget.
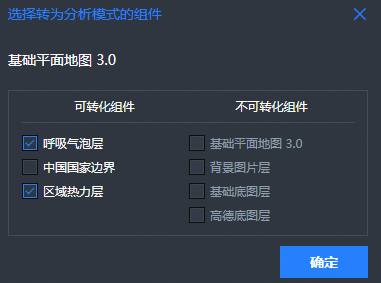
If a map widget has multiple child widgets, you are prompted to select which widgets to convert when you switch to analysis mode.
Method three: Switch from the Data panel
In the upper-right corner of the Data panel for a widget that supports analysis mode, click the icon to switch to Analysis Mode.
Configure widget analysis interactions
Interaction one: Data drill-down
Event |
Description |
Drill down |
A feature that lets you drill down into a dataset for detailed display. |
Drill-down configuration |
On the Data panel, click the drill-down icon to the right of a field. Then, click Hierarchical Drill-down.
Note
The field for which you enable drill-down must not be aggregated. You can add multiple fields and drag them to adjust the drill-down dimensions. |
Drill-down preview |
On the preview and published pages of your visualization application, click to view the drill-down interaction. The breadcrumb menu in the upper-left corner displays the drill-down path. Click the breadcrumb menu to return to a specific drill-down level. |
Drill-down behavior configuration |
On the Interaction page in the analyzer's right-side panel, configure analysis interactions. These include enabling filter interactions such as Trigger Filter Interaction with Other Widgets or Receive Filter Interaction from Other Widgets. |
Interaction two: Data filtering
With filter interaction, analysis mode widgets can interact with each other. You can filter data by clicking to select items.
A widget interacts with other widgets on the same canvas. The interaction is bi-directional. You can disable some interactions in the filter interaction configuration.
Prerequisites for filtering:
The relevant configuration items are enabled.
The same dataset is used.
After you enable filter interaction, making a selection in one widget filters the results displayed in related widgets.
Analysis mode notes
How it works with blueprints
Note that in the blueprint editor, analysis mode widgets cannot be exported to a blueprint, but an analyzer can.
If an analyzer contains more than one analysis mode widget (such as multiple child widgets in Basic Plain Map 3.0), you must also specify the ID of the target widget.
Restricted operations
Layer movement: An analyzer can contain only one widget. Dragging other widgets into the analyzer causes an error. When you move the widget, the analyzer moves with it.
Copying and adding to favorites: You cannot copy or add an analysis widget to favorites. The editor prompts you to confirm whether you want to copy or add the entire analyzer.
Exporting to blueprint: Analysis mode widgets cannot be exported to a blueprint, but their analyzer can.
Converting to a block: Analysis mode widgets and analyzers cannot be converted to blocks. Groups or form groups that contain analysis mode widgets also cannot be converted to blocks.
Operations that cause changes
Deleting a widget: When you delete an analysis mode widget, its analyzer is also deleted.
Adding and deleting child widgets: When you create an analysis mode child widget within a non-analysis mode map widget, you are prompted to switch to analysis mode and add an analyzer. When the last analysis mode child widget in an analysis mode map is deleted, you are prompted to exit analysis mode and delete the analyzer.
Automated configuration notes
After you add a field, the mapping for the corresponding visual channel (such as color or size) is automatically enabled.
After you delete a field, the mapping for the corresponding visual channel is automatically disabled, reverting to the static field.
The aggregation method for the field is automatically selected.
The geographic role (longitude, latitude, adcode) is automatically selected.
Compatibility with original analysis widgets
Content configured in an original analysis widget can be displayed but not modified. To modify the content, you must switch to analysis mode. The original field configuration is retained when you switch.
Demo
The video tutorial uses company sales order data as an example. It shows how to configure filter interaction and drill-down for two analysis widgets. It also shows how to use a blueprint to trigger drill-down and selection actions.
Log on to the DataV console.
On the My Visualizations page, click the Edit button for the visualization application project that you created to open the canvas editor.
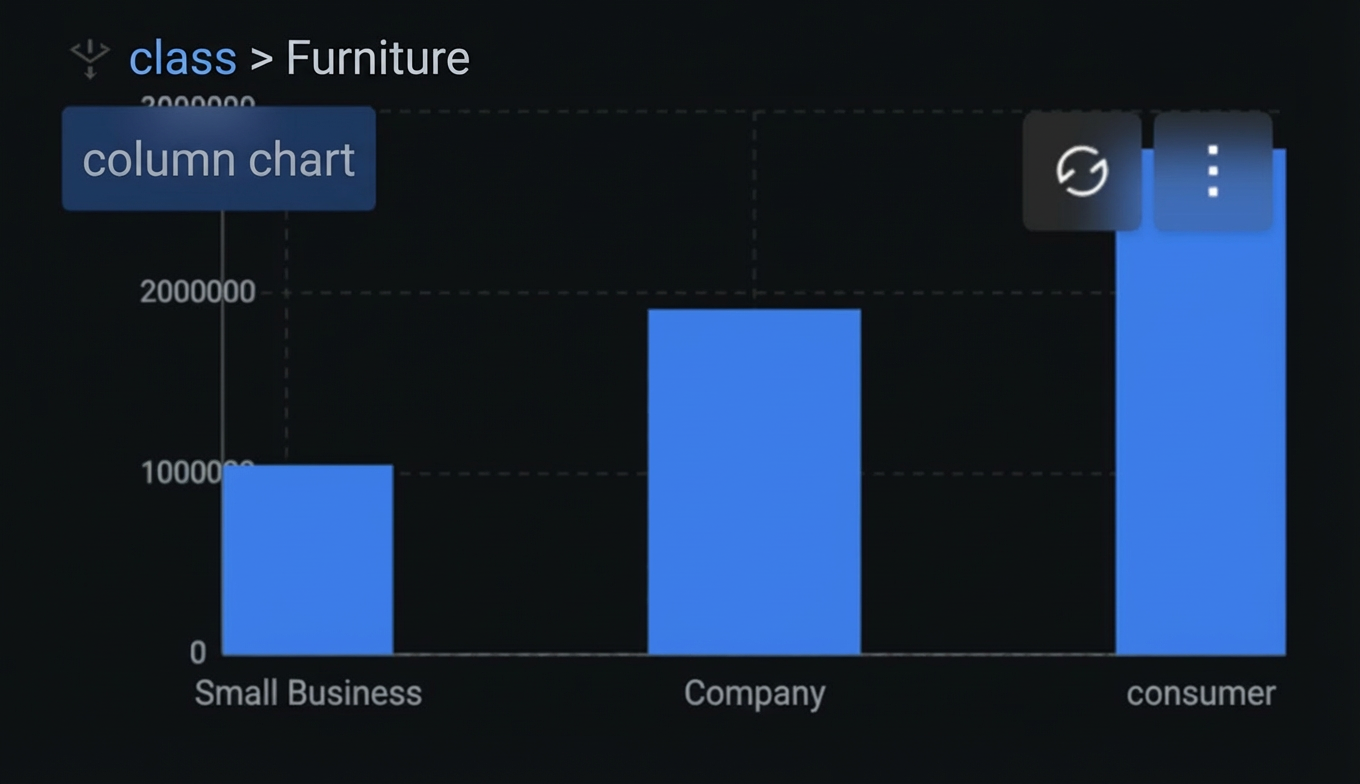
Click the BI Analysis module. Drag a Column Chart widget to the canvas editor and configure a dataset for it. For more information about how to configure a dataset, see Introduction to DataV 6.0 datasets.
In the Chart Configuration module, configure the chart by dragging and dropping fields. Set the
xfield to Category, theyaxis to Price, andColor Mappingto Price. Set the corresponding colors. SetSplitto Date. In addition, set the drill-down field for Category to Sub-category.On the preview page of the visualization application, you can see the result of your settings. The breadcrumb menu is in the upper-left corner.
In the canvas editor, add a Bar Chart widget. In the analytical data panel, select the same dataset used by the Column Chart widget. In the chart configuration module, set the
xaxis to Price and theyaxis to Category. Set the drill-down fields to Order Status and Sub-category. SetColor Mappingto Price andSplitto Date.Click the Interaction tab of the widget. Set Trigger Method to Click. Switch to the Configuration panel. In the Graphic settings, set Mapping Type to Nominal Category.
On the preview page of the visualization application, view the filter interaction effect. When you select digital products in the Column Chart widget on the left, the Bar Chart widget on the right filters and displays the details of the digital products in sync. When you drill down to child levels, such as "paid" and "pending payment", in the Bar Chart widget, the Column Chart widget on the left also filters the corresponding content in sync.
NoteTo prioritize drilling down, select Drill-down Priority mode. To prioritize filtering without drilling down, select Selection Priority mode.
You can also set whether to trigger or receive filter interactions from other widgets in the filter interaction module.
Select the analyzer, then right-click and select Export to Blueprint Editor. The video tutorial uses a Tab List widget to trigger Drill Down and Backoff Drill-down actions. This configuration triggers a drill-down when a condition is met and a backoff when the condition is not met.
For the drill-down handling method, see the following code:
return {
  "id": "",
  "items": [
    {
      "x": "Digital Products"
    }
  ]
};
For the backoff drill-down handling method, see the following code:
return {
  "depth": 0,
  "forceClear": false
};
Connect the widgets and nodes as shown in the following figure:
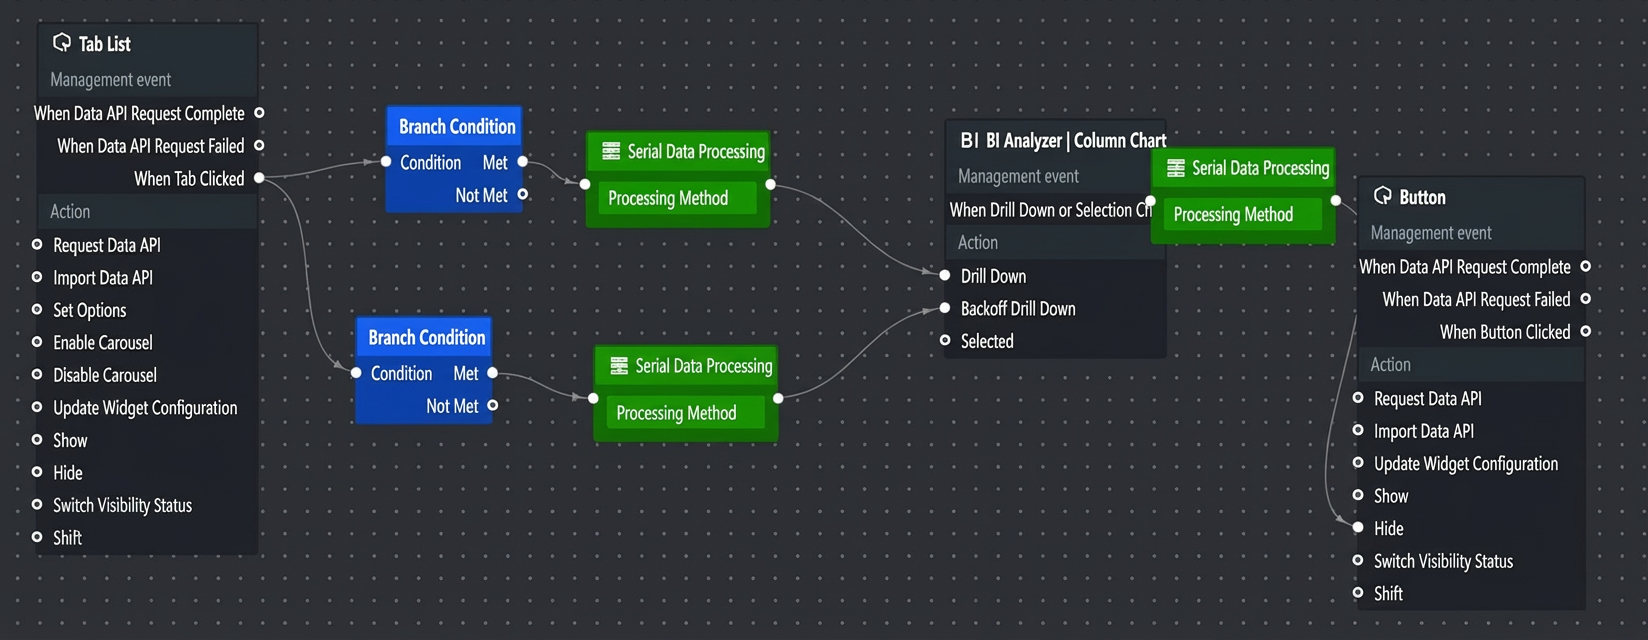
Click the Normal Preview icon in the upper-right corner of the blueprint editor to preview the results. The Tab2 button on the page is configured to trigger the drill-down. Clicking it causes the Column Chart widget to drill down to the corresponding digital products. The Tab3 button is configured to trigger the backoff drill-down, which exits the drill-down mode.
In the blueprint editor canvas, use the following code to hide a button when a drill-down or selection changes. You can also set up blueprint connections and record blueprint logs to monitor the execution process.
return {
  "animationType": "fade",
  "animationDuration": 1000,
  "animationEasing": "linear"
};
Video link
DataV Classroom video tutorial: A Taste of Analysis Mode.