Realize the Dynamic Style
Use the Tab List component to dynamically change the style of a ticker board component based on user interaction.
Procedure
Log on to the DataV console.
-
Select a visualization application and click Edit to open the Canvas Editor.
-
Add a tab list widget and a ticker board widget to the canvas.
-
In the left-side navigation pane, click the Tab List widget. On the Data tab, click Configure Data Source in the Static Data Source section and change the data content to two entries.
-
In the Configure panel, change the Title to
Change Color by Value. -
In the Layer panel, select all widgets, right-click, and choose Export to Blueprint Editor.
-
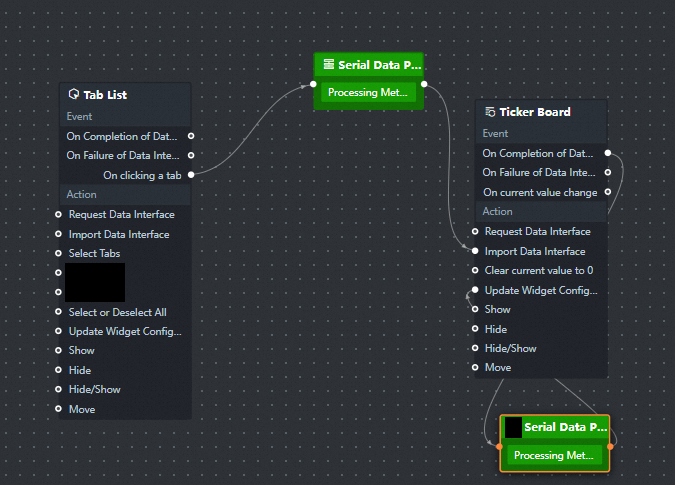
Connect the components and rename the processing method of the Serial Data Processing node.
-
Configure the processing method of the Serial Data Processing node as follows:
-
Update the flip value
return [{value: data.id == 1 ? 30 : 50}]; -
Configure digit colors
-
Return to the Canvas Editor page. Click the Tickerboard widget. In the right-side configuration panel, click Copy Configuration to Clipboard.
-
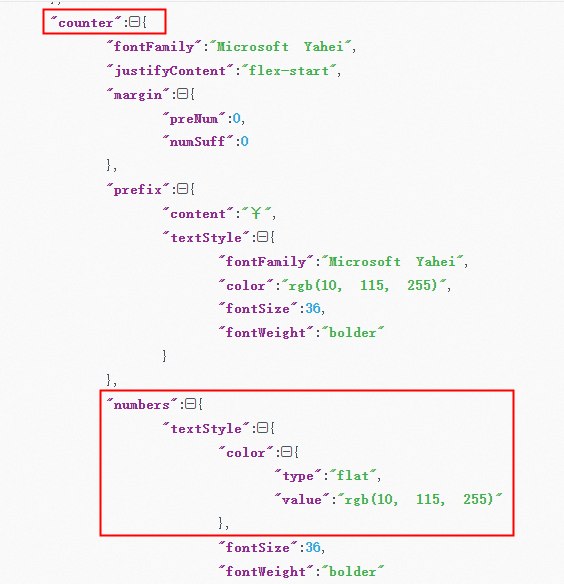
Paste the copied content into a code editor, examine the data hierarchy, and locate the configuration field you want to update.
-
Write the configuration script based on the data structure shown in the preceding figure.
return data[0].value - 40 >= 0 ? {
  "counter": {
    "numbers": {
      "textStyle": {
        "color": {
          "type":"flat",
          "value":"red"// The color of the data to be modified.
        }
      }
    }
  }
} : {
    "counter": {
      "numbers": {
        "textStyle": {
          "color": {
          "type":"flat",
          "value":"rgb(10,115,255)"// The initial color
        }

        }
      }
    }
  }
-
-
-
Click the
 icon in the upper-right corner to preview the result.