Comparison pie chart
This topic describes the styles and configuration panel of the Comparison Pie Chart.
Chart style
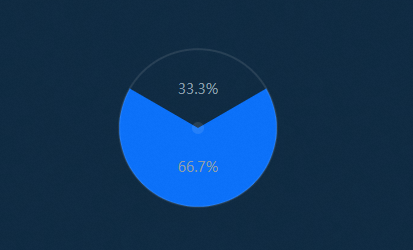
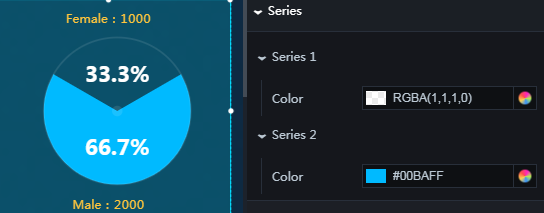
The Comparison Pie Chart, unlike a basic pie chart, displays both actual and percentage values. It is designed for comparing two data metrics and supports only two data series.
Configuration panel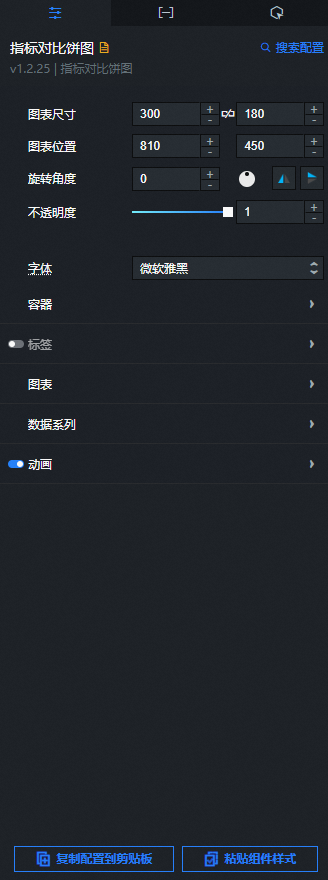
- Search for Configurations: In the right-side panel of Canvas Editor, click the Settings tab, and click Search for Configurations in the upper-right corner. Enter the required configuration item in the search box, and click the search icon to quickly locate the configuration item. Fuzzy match is supported. For more information, see Search for Configurations.
- Size: indicates the size of a widget, including its pixel width and height. You can click the
 icon to proportionally adjust the width and height of a widget. After you click this icon again, you can adjust the width and height as needed.
 - Position: the position of a widget, which is indicated by pixel X and Y coordinates. X-coordinate indicates the pixel distance between the upper-left corner of the widget and the left border of the canvas. Y-coordinate indicates the pixel distance between the upper-left corner of the widget and the upper border of the canvas.
- Rotation Angle: the angle of a rotation that uses the center point of a widget as the rotation point. The unit is degrees (°). You can use one of the following methods to control the rotation angle of a widget:
- Directly enter the degrees in the Rotation Angle spin box or click the plus sign (+) or minus sign (-) to increase or decrease the value in the Rotation Angle spin box.
- Drag the black dot in the
 icon.
icon. - Click the
 icon to horizontally flip a widget.
 - Click the
 icon to vertically flip a widget.
- Opacity: the opacity of a widget. Valid values: 0 and 1. If this parameter is set to 0, the widget is hidden. If this parameter is set to 1, the widget is completely displayed. Default value: 1.
Font: The font for all text in the component. The default is Microsoft YaHei.
Container
Padding: The distance in pixels (px) between the pie chart and the component's left, top, and bottom borders. If this value is too large, the pie chart may extend beyond the component area.
Label: The style of the pie chart's labels. Click the
icon to show or hide the labels.Parameter
Description
Color
The color of the top and bottom labels. For more information, see Color Picker.
Font size
The font size of the labels. The value must be between 12 and 100.
Font weight
The font weight of the labels.
Chart
Parameter
Description
Radius
The radius of the pie chart.
Color
The color of the percentage values in the pie chart.
Decoration color
The color of the pie chart's outer border and center point.
Background color
The background color of the pie chart.
Font size
The font size of the text within the pie chart. The value must be between 12 and 100.
Font weight
The font weight of the text within the pie chart.
Margin
Sets the space around the pie chart. The top and bottom margins define the distance to the labels, while the left and right margins define the distance to the component's edges.
Top margin: The distance between the pie chart and the top label.
Bottom margin: The distance between the pie chart and the bottom label.
Left margin: The distance between the pie chart and the left side of the component.
Right margin: The distance between the pie chart and the right side of the component.
Start angle offset
The starting angle offset for the pie chart's slices. The value must be between 0 and 360.
Data series: Configures the pie chart's two data series. You cannot add or delete series.
Series
Series 1
Color: The color of the sector for this series in the pie chart.
Series 2
Color: The color of the sector for this series in the pie chart.
Animation: Configures the animation settings for the pie chart. You can click the
icon to enable or disable animations.Initial animation duration: The duration of the initial rendering animation, in milliseconds (ms).
Easing: The easing effect for the animation. You can select from a variety of common easing effects.
Update animation duration: The duration of the animation when data is updated, in milliseconds (ms).
 icon to vertically flip a widget.
 icon to show or hide the labels.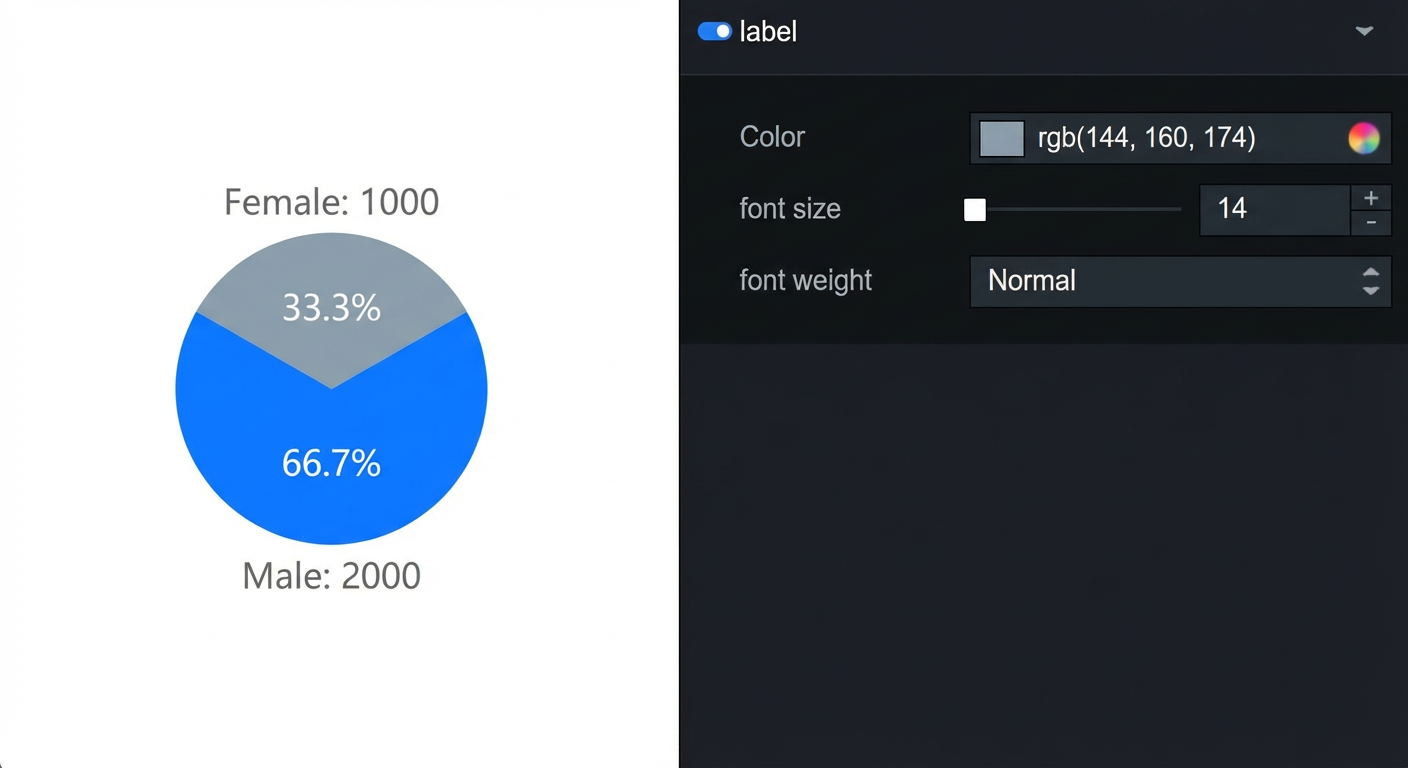
 icon to enable or disable animations.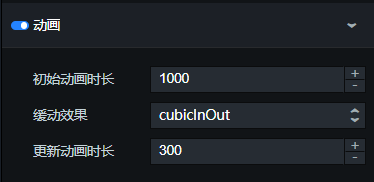
Data panel
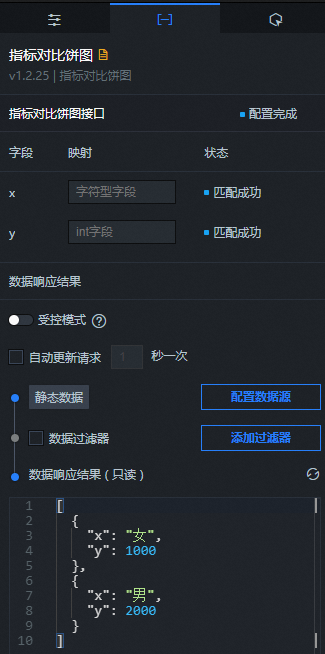
Fields
Field | Description |
x | The category of the series label. |
y | The value of the series label. |
The percentage shown for each sector is its y-value's proportion of the total of all y-values. The system calculates and displays this automatically.
Parameter | Description |
Controlled mode | When enabled, the component does not request data on initialization. Instead, data requests are triggered by a callback ID or a Blueprint Editor action. When disabled, the component can use automatic updates to request data. This option is disabled by default. |
Automatic update | Enables automatic data polling at a specified interval. If disabled, you must trigger data updates manually by refreshing the page or by using a Blueprint Editor action or callback ID. |
Data source | Click Configure Data Source. In the Set Data Source panel, you can modify the data source type and data query code, preview the data source response, and view the data response. For more information, see Configure Asset Data. |
Data filter | Data filters provide data structure transformation, filtering, and some simple calculation functions. Click Add Filter to configure a data filter script in the Set Data Source panel. For more information, see Filter Usage Instructions. |
Data response | Displays the response from the data request. When the data source changes, you can click the |
 icon on the right to view the latest data response in real time.
Interaction panel
This component has no interaction events.
Blueprint editor interaction configuration
- In Canvas Editor, right-click a widget in the Layer panel and select Add to Blueprint Editor.
- Click the icon in the upper-left corner of the page.
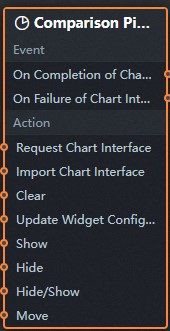
On the Blueprint Editor configuration page, click the Comparison Pie Chart component in the imported nodes panel. The component's configuration parameters appear on the canvas, as shown in the following figure.
Events
Event
Description
On API request success
Triggered after a successful API data request, once the response passes through a data filter. The event outputs the processed data in JSON format. For a data sample, see the Data Response area on the Data panel.
On API request failure
Triggered when a data API request fails (for example, due to a network issue or an API error). The event outputs the error information. For a data sample, see the Data Response area on the Data panel.
Actions
Action
Description
Request data
Triggers a new data request from the server, using data from upstream nodes as parameters. For example, if the API data source is configured as
https://api.testand the data passed to the Request Data action is{ id: '1'}, the final request URL will behttps://api.test?id=1.Import data
Updates the component with data that is already in the required format, without making a new server request. For a data sample, see the Data Response area on the Data panel.
Clear component
Clears the component's data. No parameters are required.
Update component configuration
Dynamically updates the style configuration of the component. To do this, navigate to the component's Configuration panel and click Copy Configuration to Clipboard to copy the configuration data. Then, modify the required style fields in a data processing node within the Blueprint Editor.
Show
Shows the component. The following is a data sample.
return{
  "animationType": "",
  "animationDuration": 1000,
  "animationEasing": "linear"
}
Hide
Hides the component. The following is a data sample.
return{
  "animationType": "",
  "animationDuration": 1000,
  "animationEasing": "linear"
}
Toggle visibility
Toggles the visibility of the component. The following is a data sample.
return {
  "animationIn": {
    "animationType": "",
    "animationDuration": 1000,
    "animationEasing": "linear"
  },
  "animationOut": {
    "animationType": "",
    "animationDuration": 1000,
    "animationEasing": "linear"
  }
}
Move
Moves the component to a specified position. The following is a data sample.
    return{
      // Position type. Absolute positioning: to. Relative positioning: by. Default: to.
        "positionType": "to",
      // Target position. x-coordinate, y-coordinate.
      "attr": {
        "x": 0,
        "y": 0
      },
      // Animation settings.
      "animation": {
        "enable": false,
        // Animation duration.
        "animationDuration": 1000,
        // Animation curve. Valid values: linear|easeInOutQuad|easeInOutExpo.
        "animationEasing": "linear"
      }
    }
 icon in the upper-left corner of the page.