Performance monitoring best practices
Learn how to build an integrated performance monitoring platform and implement end-to-end distributed tracing on Alibaba Cloud.
Build an integrated performance monitoring platform
As enterprise services grow in scale and complexity, comprehensive performance monitoring becomes critical for business continuity. An integrated monitoring solution combines multiple tools and technologies into a unified platform for more efficient oversight.
-
Improve monitoring efficiency: Traditional monitoring requires separate tools for network, server, and database metrics, each with its own configuration. Data scattered across systems reduces efficiency. An integrated solution consolidates these tools into a single platform, reducing operational overhead and providing a complete view of system performance.
-
Improve monitoring accuracy: Traditional monitoring tracks only basic metrics such as CPU and memory utilization. An integrated solution extends coverage to network traffic, disk I/O, database response times, and more, enabling earlier detection and resolution of issues.
-
Improve troubleshooting efficiency: Traditional troubleshooting requires O&M engineers to manually correlate monitoring data across systems to find root causes. An integrated solution automates this analysis, helping engineers locate failures faster.
-
Improve monitoring visualization: A unified visual interface displays all performance data in one place, making it easier to spot anomalies. Built-in alerting notifies staff when problems occur, improving response times.
An integrated performance monitoring platform improves efficiency, accuracy, troubleshooting speed, and visualization, helping enterprises maintain stable and reliable business systems.
Steps to build an integrated performance monitoring platform
Building an integrated performance monitoring platform typically involves the following steps:
-
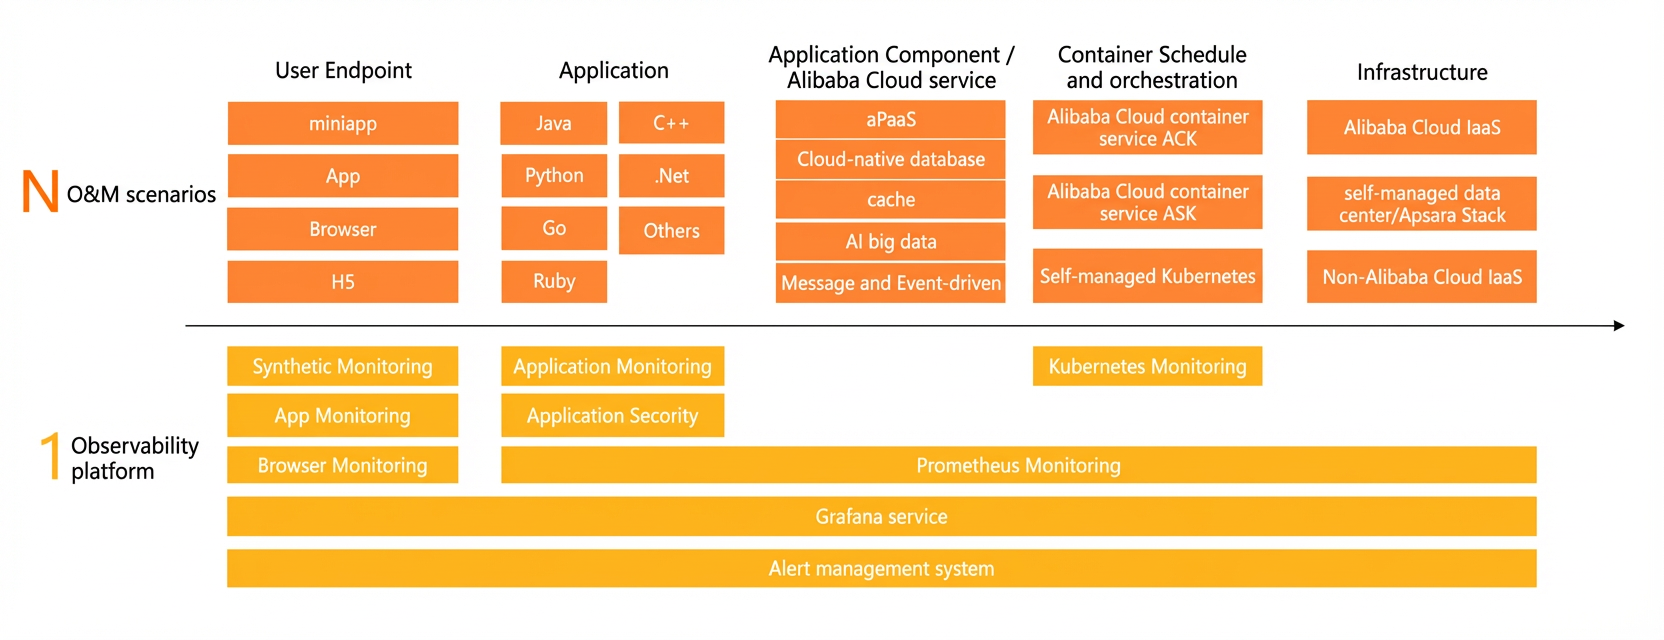
Define monitoring requirements: Clarify what to monitor, which metrics to track, and at what frequency. These requirements drive tool selection and configuration. Common metrics include request duration, cache hit ratio, FullGC count, database connections, and CPU utilization, covering the full stack from end-user terminals, gateways, and microservice applications to databases, containers, and physical machines.
-
Select monitoring tools: Choose tools based on your requirements. Common options include Zabbix, Nagios, and Grafana, which cover server, network, database, and application metrics.
-
Configure monitoring tools: Add monitored objects, set metrics and frequency, and define alerting rules for abnormal behavior.
-
Integrate monitoring tools: Combine tools into a unified platform using integration solutions such as Prometheus and Grafana to consolidate data from different sources into a single view.
-
Visualize data: Use visualization tools such as Grafana to display monitoring data in charts and dashboards for faster analysis and decision-making.
-
Automate O&M: Integrate automated O&M tools such as Ansible or SaltStack to trigger troubleshooting and optimization actions based on monitoring data.
Building such a platform from scratch requires significant R&D and operational investment. The Alibaba Cloud observability team has distilled years of experience into best practices that are stable, reliable, scalable, and compliant with open standards. The fourth-generation observability product, built with Application Real-Time Monitoring Service (ARMS), is application-centric. It links user experience with underlying infrastructure and cloud services, providing a one-stop solution for business continuity, architectural stability, and growth.
Implement end-to-end tracing
The value of tracing lies in correlation. End users, backend applications, and cloud components such as databases and message queues form the topology of a trace. The broader this topology, the greater its value. End-to-end tracing records the complete path and status of a user request across all related IT systems.
End-to-end tracing delivers three core values: cross-system issue diagnosis, dependency mapping, and custom tag pass-through.
-
End-to-end issue diagnosis: When a VIP customer's order fails or a beta user's request times out, the root cause often lies in backend applications or cloud components. End-to-end tracing is the preferred approach for diagnosing these cross-system issues.
-
Dependency mapping between systems: When launching, decommissioning, or migrating services, system dependencies are too complex to map manually. Trace-based topology discovery makes these decisions more agile and reliable.
-
Pass-through of custom tags: Scenarios such as end-to-end stress testing, user-level grayscale releases, order tracing, and traffic isolation rely on custom tags propagated through the trace. If a tag is lost or a chain breaks, unpredictable failures can result.
Challenges of end-to-end tracing
The value of end-to-end tracing scales with its coverage — and so do the challenges. All components, from frontend to cloud, from Java to Go, and from public clouds to on-premises data centers, must follow the same tracing standards. The three major challenges are unifying multi-language protocol stacks, coordinating across frontend, backend, and cloud endpoints, and fusing data across clouds.
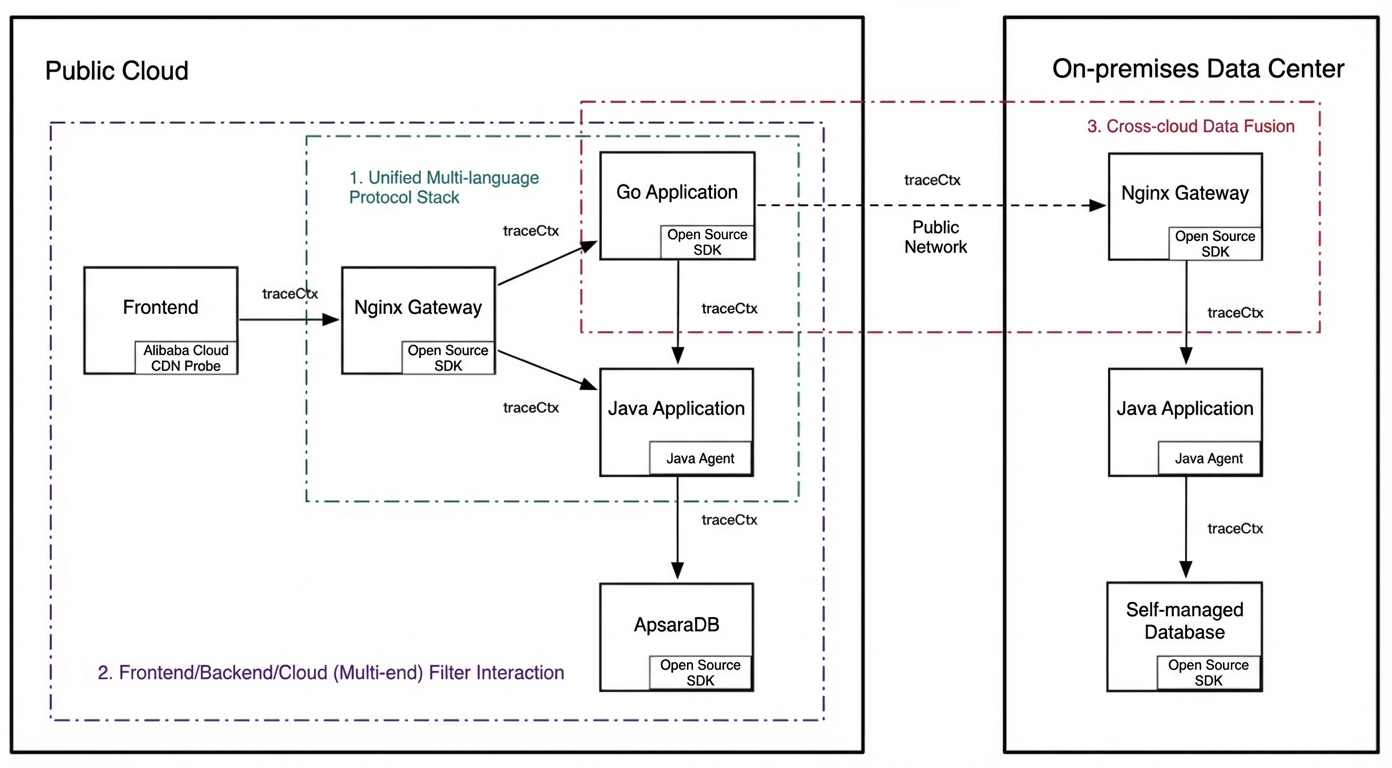
Unified multi-language protocol stacks
Multi-language architectures are increasingly common in cloud-native environments, leveraging each language's strengths for optimal performance. However, varying maturity levels across languages prevent fully consistent tracing capabilities. The mainstream approach is to unify the remote call protocol format first, then let each language implement call interception and context pass-through internally to preserve basic trace integrity.
Basic tracing alone cannot resolve most production issues. A robust tracing product must provide advanced diagnostics such as code-level analysis, memory profiling, thread pool analysis, and lossless statistics. Leveraging each language's diagnostic interfaces to maximize multi-language capabilities is key to the ongoing evolution of tracing.
-
Standardize pass-through protocols: All applications in a trace must follow the same protocol standard to ensure complete context propagation without broken chains. Mainstream protocols include W3C, Jaeger, B3, and SkyWalking.
-
Maximize the capabilities of multi-language products: Beyond basic call chains, tracing now includes application monitoring, method stack tracing, and performance profiling. Language maturity creates capability gaps — for example, Java agents leverage JVMTI for advanced edge-side diagnostics. A strong tracing solution maximizes each language's strengths rather than targeting uniform mediocrity.
Cross-endpoint coordination
Open source tracing implementations focus primarily on backend applications. Effective instrumentation for end-user terminals and cloud components such as ApsaraDB remains limited, because these components depend on vendor support for open standards.
As a result, slow frontend pages are difficult to trace back to specific backend services. Cloud component anomalies cannot be directly correlated with application-level issues, especially when multiple applications share the same database instance.
Cloud service providers must support open source tracing standards, instrument core methods, and enable protocol pass-through and data backflow. For example, Browser Monitoring in Application Real-Time Monitoring Service supports Jaeger protocol pass-through and method stack tracing.
Because different systems belong to different business units, unifying the protocol stack across an entire trace is not always feasible. The tracing system must support connecting heterogeneous protocol stacks.
Connecting heterogeneous protocol stacks requires two capabilities:
-
Protocol stack transformation and dynamic configuration: For example, a frontend passes the Jaeger protocol, but a downstream system uses Zipkin B3. The intermediate Node.js application can receive Jaeger and forward B3, preserving end-to-end tag integrity.
-
Server-side data format transformation: Reported data in different formats can be converted to a unified storage format, or compatibility can be handled at query time. Unified storage has lower maintenance costs; query-side compatibility is more flexible but costlier to maintain.
Cross-cloud data fusion
Many enterprises adopt multicloud deployments for stability or data security. Network isolation and infrastructure differences across environments create significant challenges for O&M teams.
Cross-cloud communication relies on the public network. Two approaches — cross-cloud reporting and cross-cloud querying — help maintain trace integrity. Both aim to unify multicloud data views for faster problem analysis.
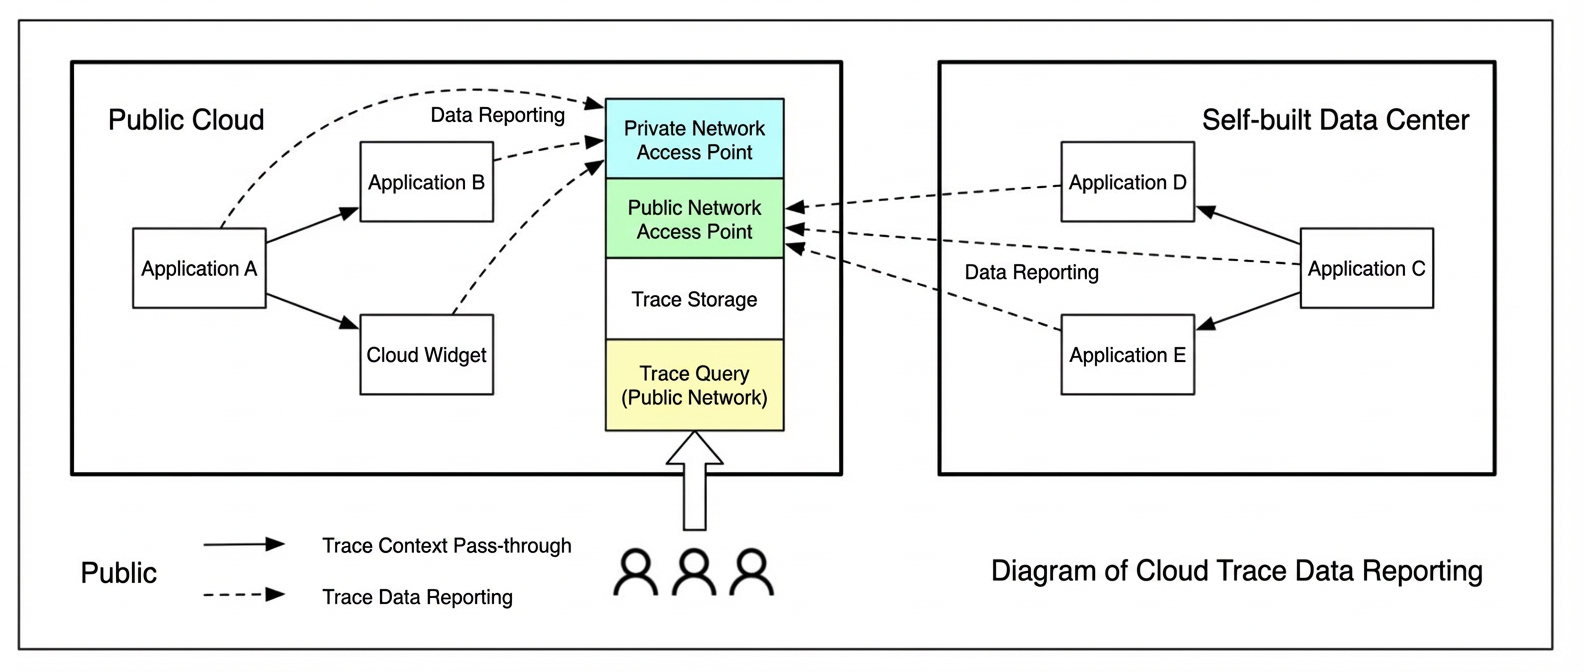
Cross-cloud reporting
Cross-cloud reporting is straightforward to implement and widely adopted. For example, Application Real-Time Monitoring Service uses cross-cloud reporting for multicloud data fusion.
Cross-cloud reporting offers low deployment costs and simplified server-side maintenance, but consumes public bandwidth and introduces data transfer stability concerns. It suits primary-secondary architectures where most nodes run in one cloud and other environments handle minimal traffic — for example, customer-facing workloads on Alibaba Cloud with internal applications in an on-premises data center.
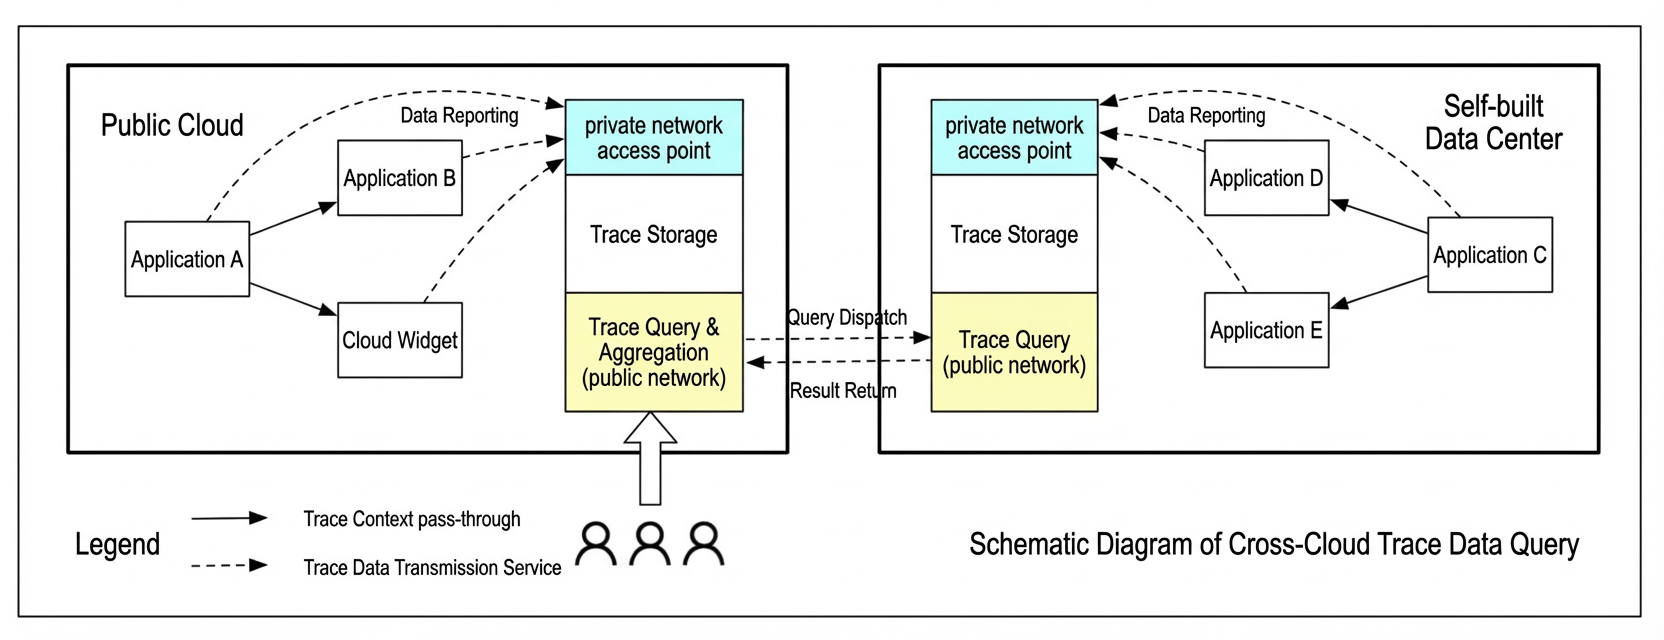
Cross-cloud querying
With cross-cloud querying, raw trace data stays in its local cloud network. Queries are distributed to each location and results are aggregated, reducing public network transmission costs.
Query traffic is typically less than 0.01% of raw data volume, saving significant bandwidth. However, this approach requires multiple data processing terminals and does not support complex calculations such as quantiles or global TopN. It suits multi-primary architectures with simple trace stitching and basic statistics (max, min, avg).
Two implementation modes exist: a centralized terminal within the cloud network connected via leased line, which handles multiple users simultaneously (lower maintenance, better elasticity), or a per-user terminal within each VPC (better data isolation).
Other methods
In addition to the two solutions above, a mixed mode or a pass-through only mode can be used in practice.
Mixed mode reports statistical data (small volume, high accuracy) over the public network for centralized processing, while retrieving trace data (large volume, low query frequency) through cross-cloud querying.
In pass-through only mode, each cloud environment ensures complete trace context propagation but implements storage and querying independently. This mode has the lowest implementation cost — each cloud follows the same protocol, and correlation is done manually using TraceId or application name. It suits rapid integration of existing systems.
Best practices for end-to-end tracing on Alibaba Cloud
In an Alibaba Cloud environment, you can use Managed Service for OpenTelemetry to quickly build an end-to-end tracing system from scratch that spans the frontend, gateway, server-side, containers, and cloud components.
-
Header pass-through format: Use a unified pass-through protocol for the entire trace, such as W3C TraceContext, B3, or Jaeger.
-
Frontend connection: Use low-code connection types such as CDN (script injection) or NPM. These support scenarios such as Web/H5 and miniapps.
-
Backend connection:
-
For Java applications, using the ARMS Agent is recommended. It provides non-intrusive instrumentation without code modification and supports advanced features such as edge diagnostics, lossless statistics, and precise sampling. You can use the OpenTelemetry SDK for active instrumentation of custom methods.
-
For non-Java applications, you can connect to Managed Service for OpenTelemetry and report data to the corresponding endpoint. This enables trace pass-through and display among multi-language applications.
-
End-to-end tracing is a starting point. Associating traces with metrics, logs, events, and profiling data further improves diagnosis and business analysis.
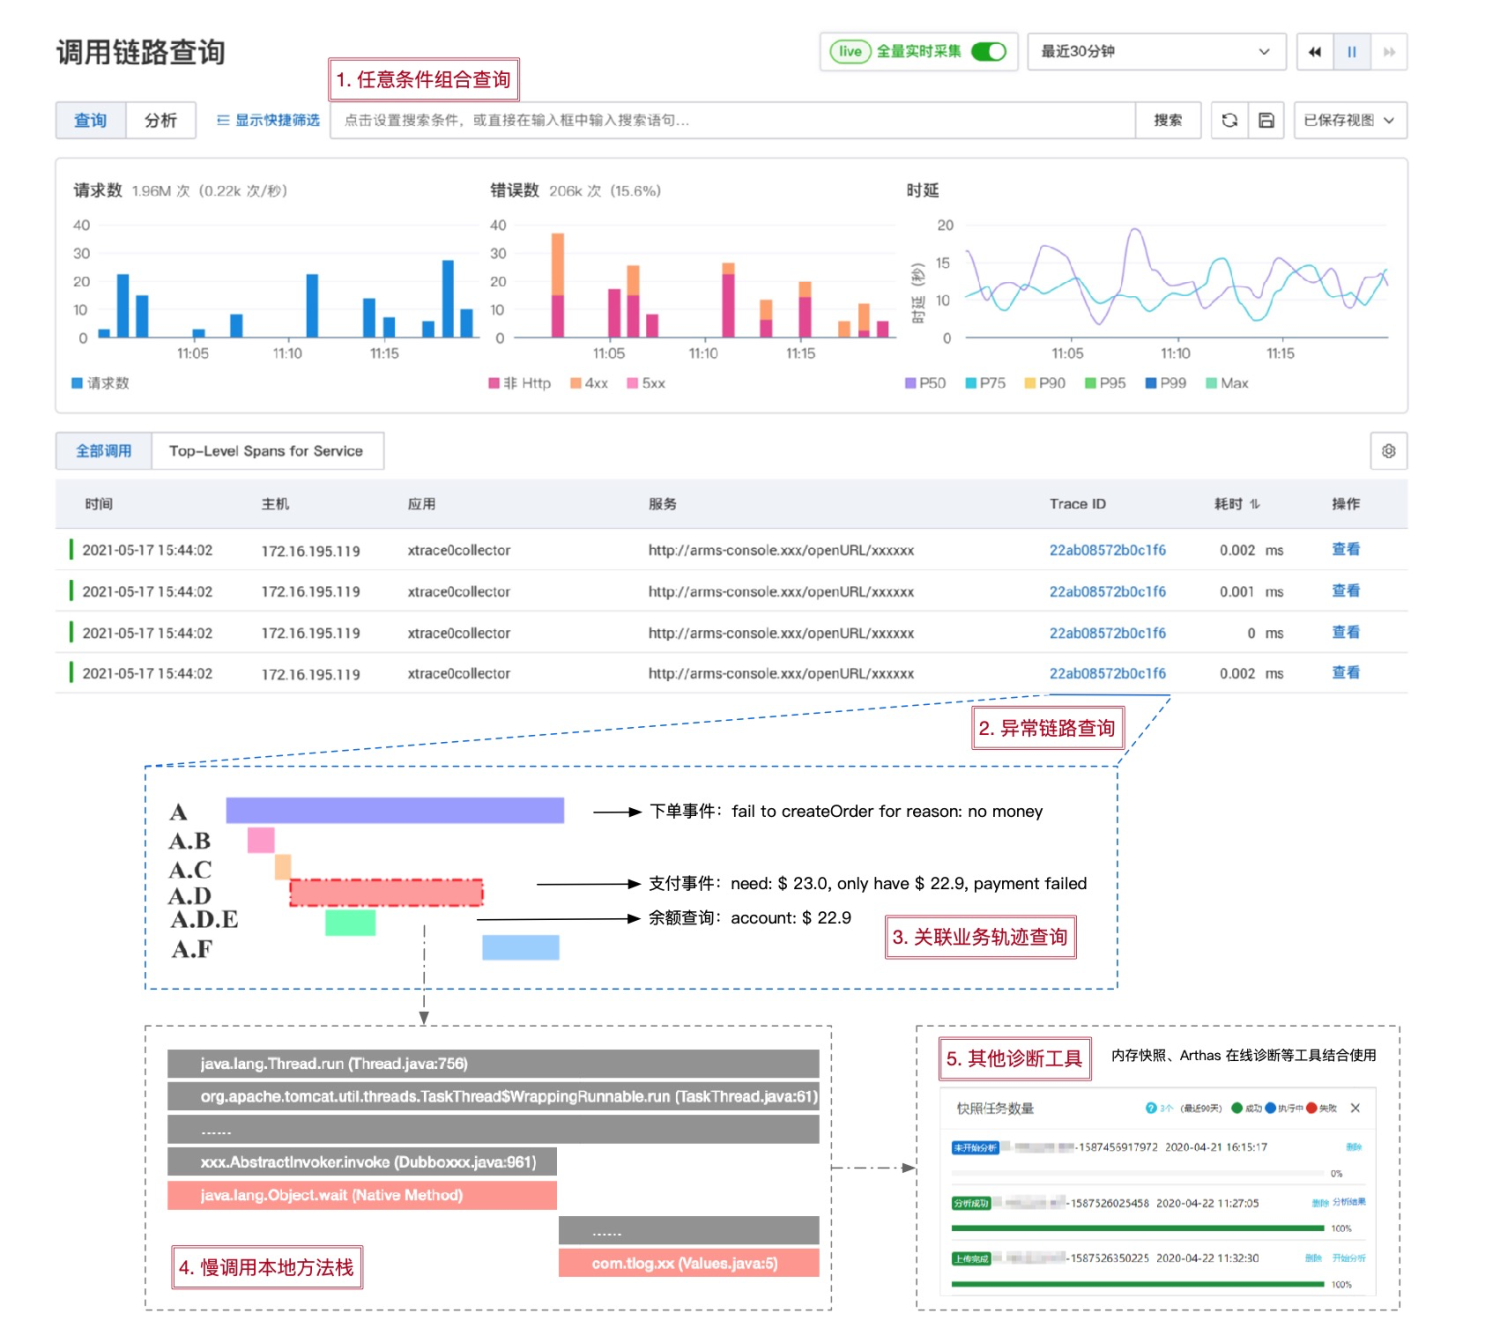
A typical trace filtering and diagnosis workflow on Alibaba Cloud:
-
Filter call traces by TraceId, application name, API name, duration, status code, or custom tags.
-
Select a trace from the results to view its details.
-
Analyze the trace by correlating the call path, method stack, and associated data such as SQL statements and service logs.
-
If needed, perform deeper analysis using memory snapshots or Arthas online diagnostics.