A lag occurs when the main thread fails to execute a method within a specified time threshold: 2.25 seconds for Android and 2 seconds for iOS. When a lag occurs, the client uploads lag information in real time. The console displays this information after a delay of several seconds to minutes.
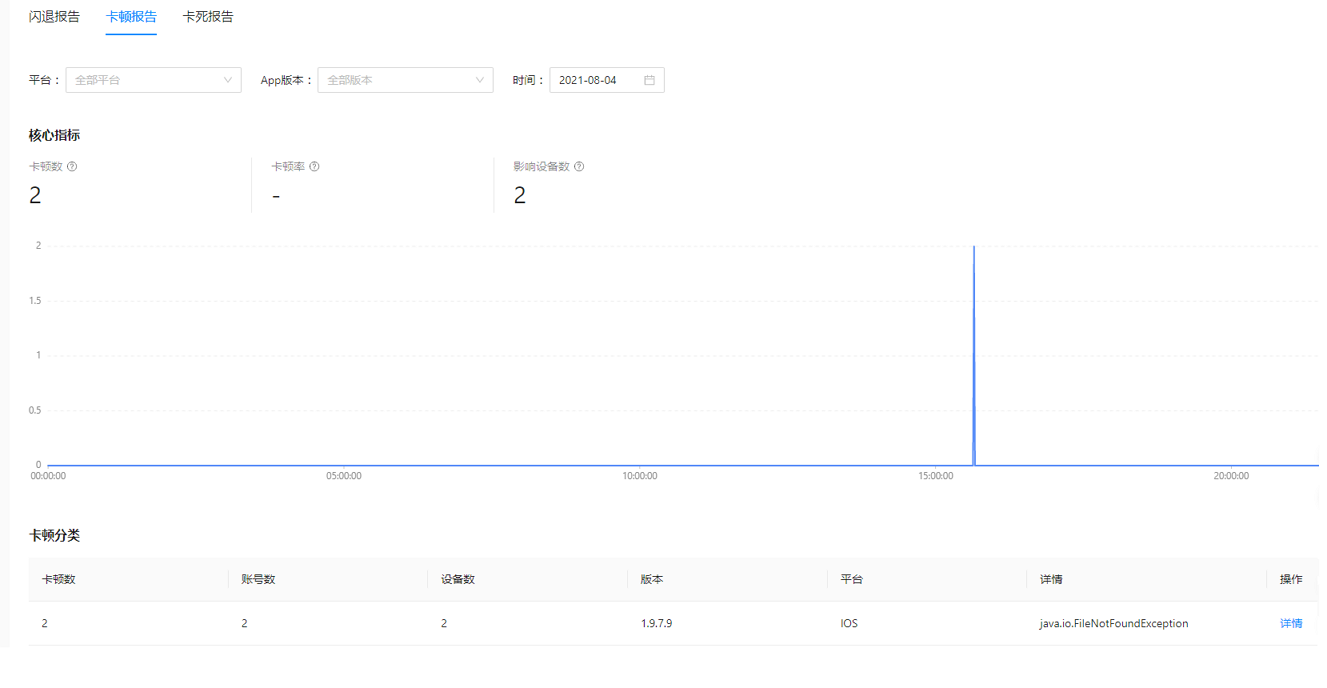
The lag report shows key metrics, including the lag count, lag rate, and the number of affected devices. You can also view detailed information for each lag category.
To view the lag report, follow these steps:
Log on to the mPaaS console. In the left-side navigation pane, choose Performance Monitoring > Crash Analysis.
Click the lag report tab to view lag analysis data.
Filter the statistical data by platform, app version, and time.
 Note
NoteLag analysis is currently supported on iOS, Android, and HarmonyOS.
Core metrics
This section displays per-minute lag data and trends in a line chart. Click a metric card to view the corresponding trend data.
Lag count: The total number of lags that occurred on devices with lag monitoring enabled. The sampling rate for lag monitoring is 10%.
Lag rate: The lag count divided by the total page views (PVs) on devices with lag monitoring enabled.
Affected devices: The number of unique devices that experienced a lag during the specified time, deduplicated by device ID.
Lag categories
This section displays lag data for the selected date, categorizing logs by their cause.
Lag count: The total number of lags in a given category.
Accounts: The number of unique user IDs within the same lag category, based on the
userIDfield in the log. If theuserIDfield is not set, the default value is 1.Devices: The number of unique device IDs within the same lag category, based on the
device IDfield in the log. If thedevice IDfield is not set, the default value is 1.Version: The app version recorded in the lag log.
Details: The call stack recorded in the lag log.
The lag report details include the call stack for Android devices, but not for iOS devices.
Lag details
In the lag categories list, click the Details link in the Operation column to view details for that lag category, including information on error groups and error samples.
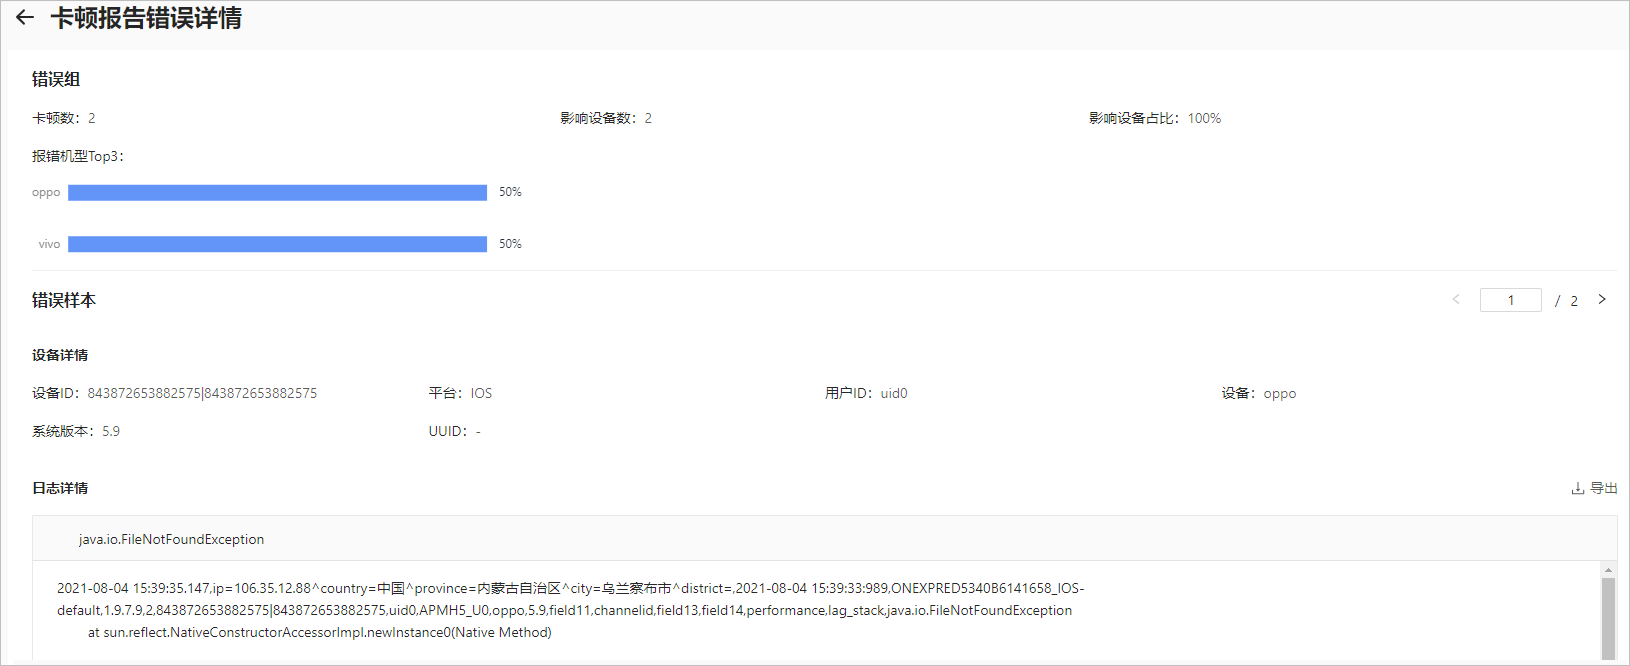
Error group:
Lag count: The total number of lags in a given category.
Affected devices: The number of devices that experienced this category of lag, deduplicated by device ID.
Proportion of affected devices: The number of devices affected by this lag category divided by the total number of devices that experienced any lag.
Top 3 models with errors: The proportion of the total lag count attributable to the three device models with the most lags.
Error sample: Displays information for the current sample, such as device details and log details. You can switch between samples by using the < and > buttons.
Device details: Displays information for the current sample, such as device ID, platform, user ID, device model, operating system version, and UUID.
Log details: Displays the lag log for the current sample and lets you export the data.
If a device ID is empty or is a hyphen ("-"), it is excluded from the total device count.