APM allows you to report data, run queries, and receive alerts based on custom monitoring events. You can define these events for your app to monitor specific performance aspects. When an event is triggered, the system reports the event information and sends a notification through DingTalk. This helps you quickly identify and resolve issues.
Log in to the mPaaS console. From the left navigation pane, navigate to data analysis > performance monitoring > monitoring and alerts. This page shows real-time data, a list of all monitoring events, and the status of triggered alerts.
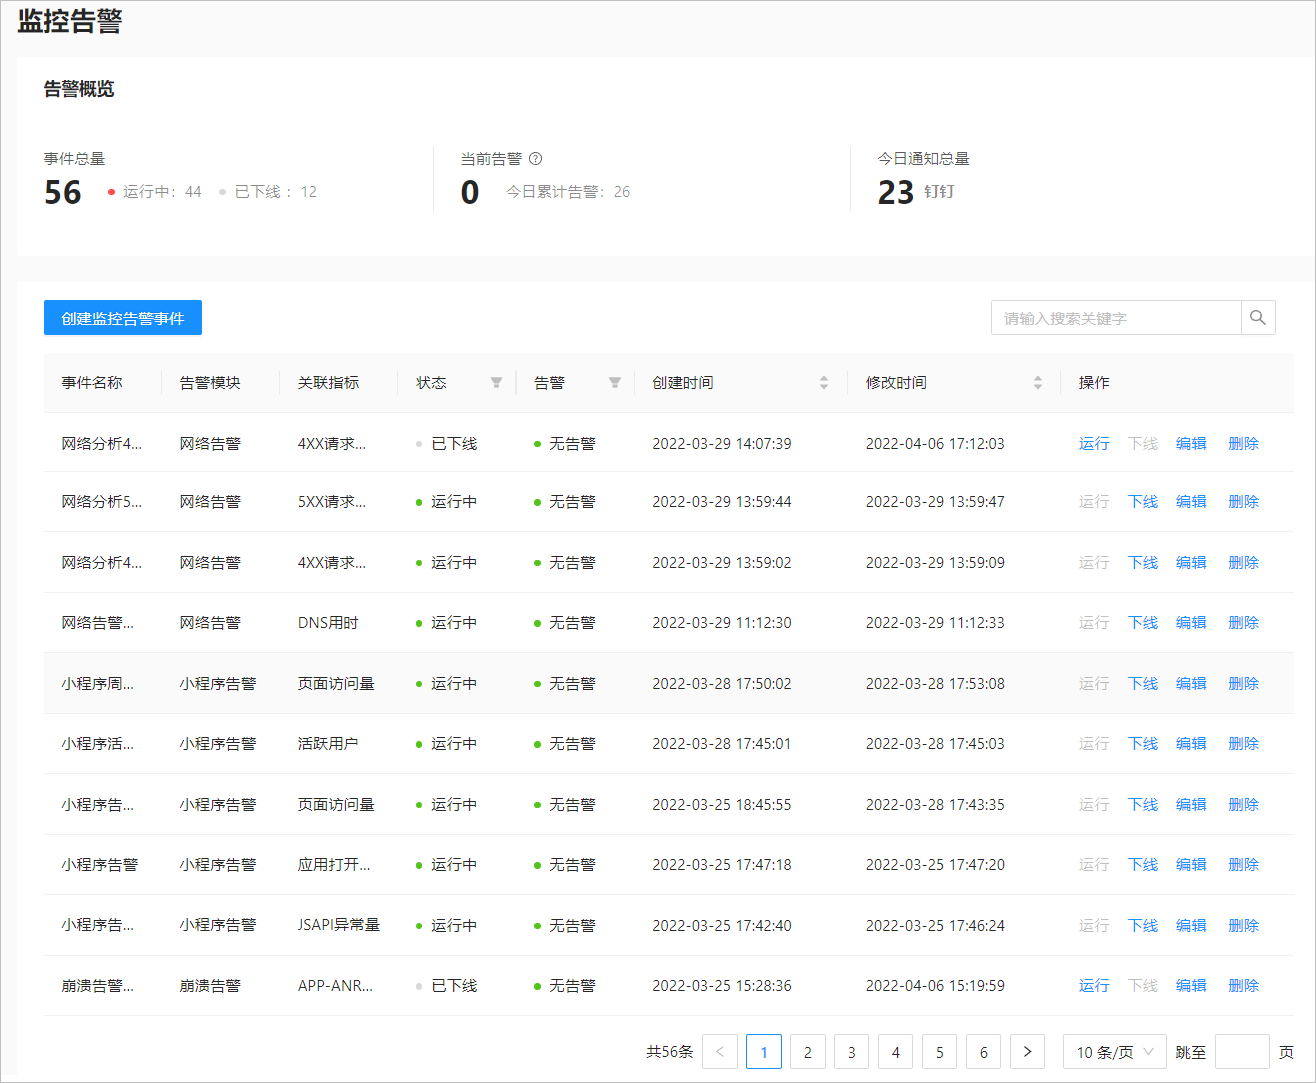
Alert overview
This section displays real-time monitoring and alerts data for your app, including:
Total events: The total number of alert-triggering events, including running and offline events.
Current alerts: The number of alerts triggered in the last 15 minutes and the total number of alerts triggered so far today.
Total notifications today: The total number of DingTalk alert notifications sent.
Monitoring and alerts event list
The Monitoring and alerts event list displays all monitoring events for the current app and their related information, including the event name, associated monitoring metric, event status, alert status, and creation time. From this list, you can take events online or offline, edit, or delete them.