This topic explains how to create a monitoring and alert event.
Follow these steps:
Log on to the mPaaS console. In the left-side navigation pane, choose data analysis > performance monitoring > monitoring and alerts.
Click Create monitoring and alert event. In the panel that opens, configure the event settings.
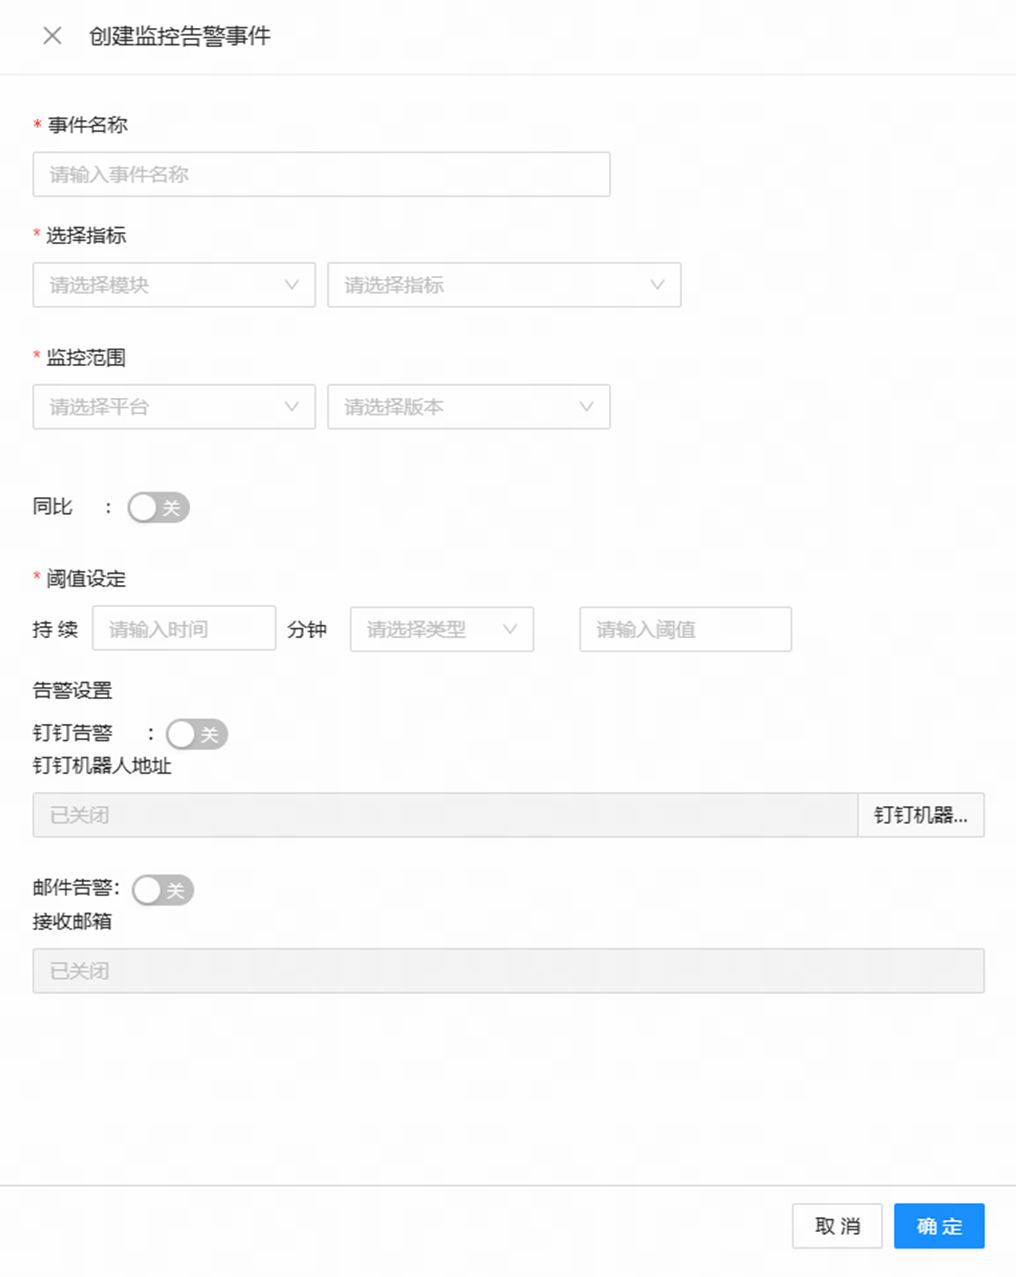
Event name: Enter a name for the monitoring and alert event. The name must be unique within the app.
Select metrics: Specify the alert module, monitoring metrics, and monitoring scope.
Alert module: Select a performance monitoring module. The following modules are supported: network alert, startup alert, page alert, crash alert, H5 page alert, service alert, and mini program alert.
Monitoring metrics: The available metrics vary depending on the selected alert module. For more information, see the following table.
Monitoring scope: Specify the scope for the monitoring and alert event. The configuration options for the monitoring scope vary by alert module and can include platform, App version, gateway type, page, and channel.
NoteMonitoring and alert events are supported on the iOS, Android, and Harmony platforms.
Alert module
Monitoring scope
Monitoring metric
Network alert
platform + App version + gateway (mPaaS gateway/customer gateway)
Total request duration, Failure rate, Total requests, DNS query duration, TCP connection duration, SSL duration, time to first byte (TTFB), Transmission duration, Average download speed
Startup alert
platform + App version
App first startup duration, App non-first startup duration
Page alert
platform + page
Page loading duration
Crash alert
platform + App version
Crash rate, stuttering rate, Startup ANR rate, ANR rate
H5 page alert
platform + App version
H5 page loading duration, H5 page slow loading ratio, H5 page JS error rate, Number of H5 page JS exception reports
Service alert
platform + App version + channel
App startups, App active users, App active accounts
Mini program alert
platform + App version + Mini program
Page views, Active users, App open exceptions, white screen rate, JS error rate, JSAPI exceptions, App package pulling exceptions - Android, App package pulling exceptions - iOS
Period-over-period: You can use period-over-period values, such as day-over-day or week-over-week, to trigger the alert. This option is disabled by default. When disabled, alerts trigger based on the real-time value.
Threshold setting: Set a threshold and duration to define the alert trigger. An alert is triggered only when the metric stays above or below the threshold for the specified duration.
For example, if the monitoring metric is "Total requests" for the mPaaS gateway and the threshold setting is Less than 10 for 3 minutes, an alert is triggered when the request count for the mPaaS gateway stays below 10 for 3 consecutive minutes.
Alert settings: Configure DingTalk and email notifications for the alert.
To get the webhook URL for your DingTalk robot, follow these steps:
Open DingTalk, go to the group where you want to add the alert robot, and click the group settings icon (
 ) in the upper-right corner.
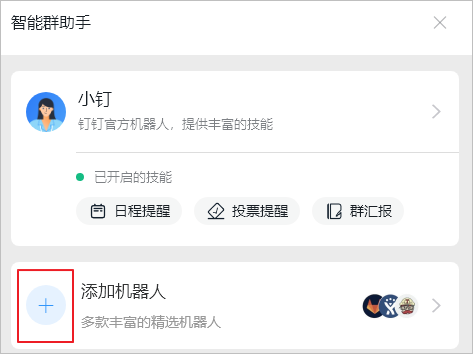
On the group settings panel, click Intelligent Group Assistant.
On the Intelligent Group Assistant page, click the + button in the Add Robot area.
In the Group Robot dialog box, click the settings icon (
 ) to the right of Add Robot. On the robot list page, select the Custom robot and click Add.
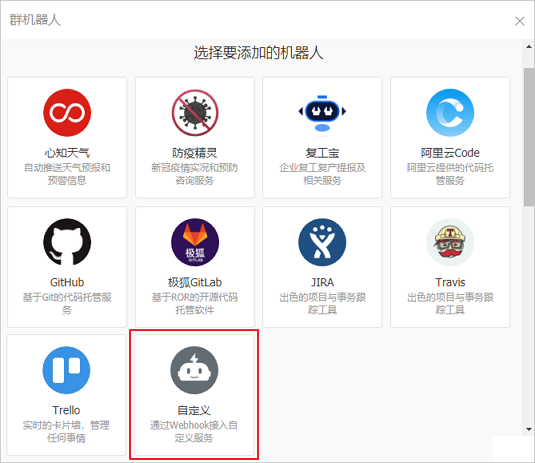
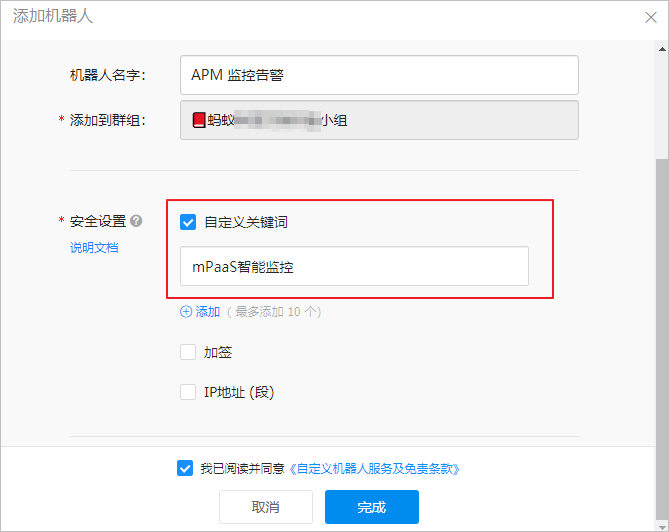
Enter a name for the robot, select the notification group, configure the required security settings, and optionally set a profile picture. Select the I have read and agree to the Custom Robot Service and Disclaimer checkbox, and then click Finish.
ImportantFor security validation, DingTalk robots only support keyword matching. You must configure the keyword: mPaaS Intelligent Monitoring.

After you complete the security settings, copy the robot's webhook URL. Use this URL to send messages to the selected DingTalk group. The format is as follows:
https://oapi.dingtalk.com/robot/send?access_token=XXXXXX
After you finish the configuration, click OK to create the event. The new event appears in the monitoring and alert event list in a disabled state. You must manually enable the event.