Cross-department data sharing with Quick BI
1. Background and requirements
In a typical enterprise, different departments have their own responsibilities. This often includes front-office sales departments, mid-office product and supply chain departments, and back-office support departments like technology and finance. All these departments handle data, which requires a way to share it securely while maintaining control. This article outlines best practices for using Quick BI to meet these requirements, based on successful customer use cases.
Common requirements for data sharing and governance include:
The technology department handles extensive report development and data retrieval, requiring collaborative editing capabilities.
Financial data is sensitive. You must control not only who can query the data, but also keep certain reports hidden from other departments (including the technology department), preventing them from discovering the reports or requesting access.
Executives need a clear, consolidated view of key data from both finance and business operations.
Data access must be restricted to ensure sales staff see only the data for their assigned customers and regions.
In addition to executives and sales staff, staff in the technology and finance departments require self-service analytics capabilities, not just access to pre-built reports.
Data permissions must be easy and quick to adjust for personnel changes, such as new hires, departures, and internal transfers.
Data analysts in the technology department need to extract data from different stages of the sales and supply chain departments each week to compile weekly reports.
2. Overall solution
These requirements can be addressed with the following solutions:
For frequent personnel changes: Use
account integrationand createrole groups based on theorganizational structure. You can then manage permissions throughuser group-based authorization.For self-service analytics, collaboration, and sensitive data isolation: Create separate
workspaces in Quick BI for different departments.For executives who need to view both business and financial data: Use one of three methods: ① Display multiple reports in a single
data portal. ② Usecard embeddingwithin a single report. ③ Create a customcard dashboard.For sales staff who need to see different scopes of data: Configure and manage
row-level securityin Quick BI.For data analysts who need to extract key metrics: Create a custom
card dashboard.
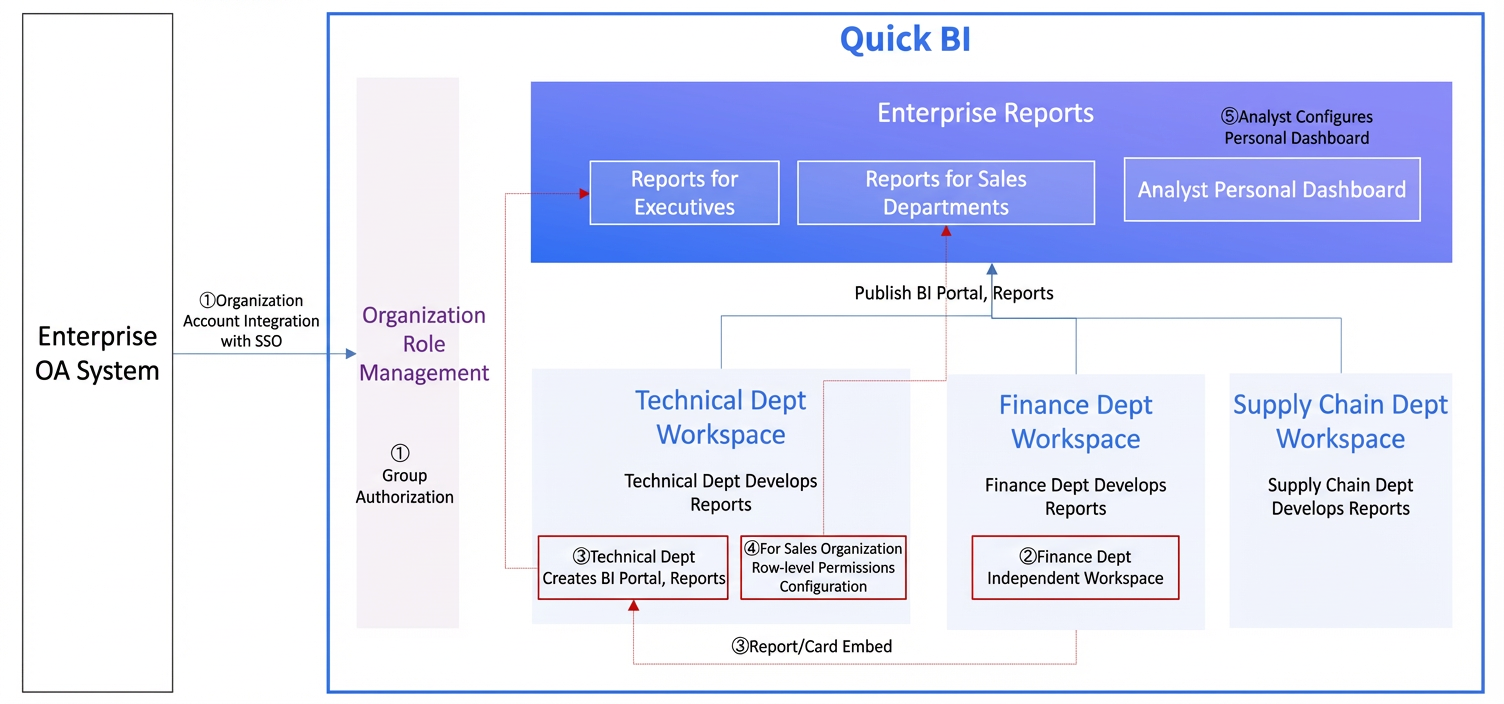
Overall architecture for secure collaboration and sharing in Quick BI
3. Detailed implementation
You can implement all these solutions quickly and easily in Quick BI. The following sections provide instructions for each part of the solution.
Set up organizational account integration, single sign-on (SSO), and role group authorization to align management with your organizational structure
For instructions and development guides on
login authentication, see the Quick BI Open Platform documentation. For more information, see Login Authentication Solution.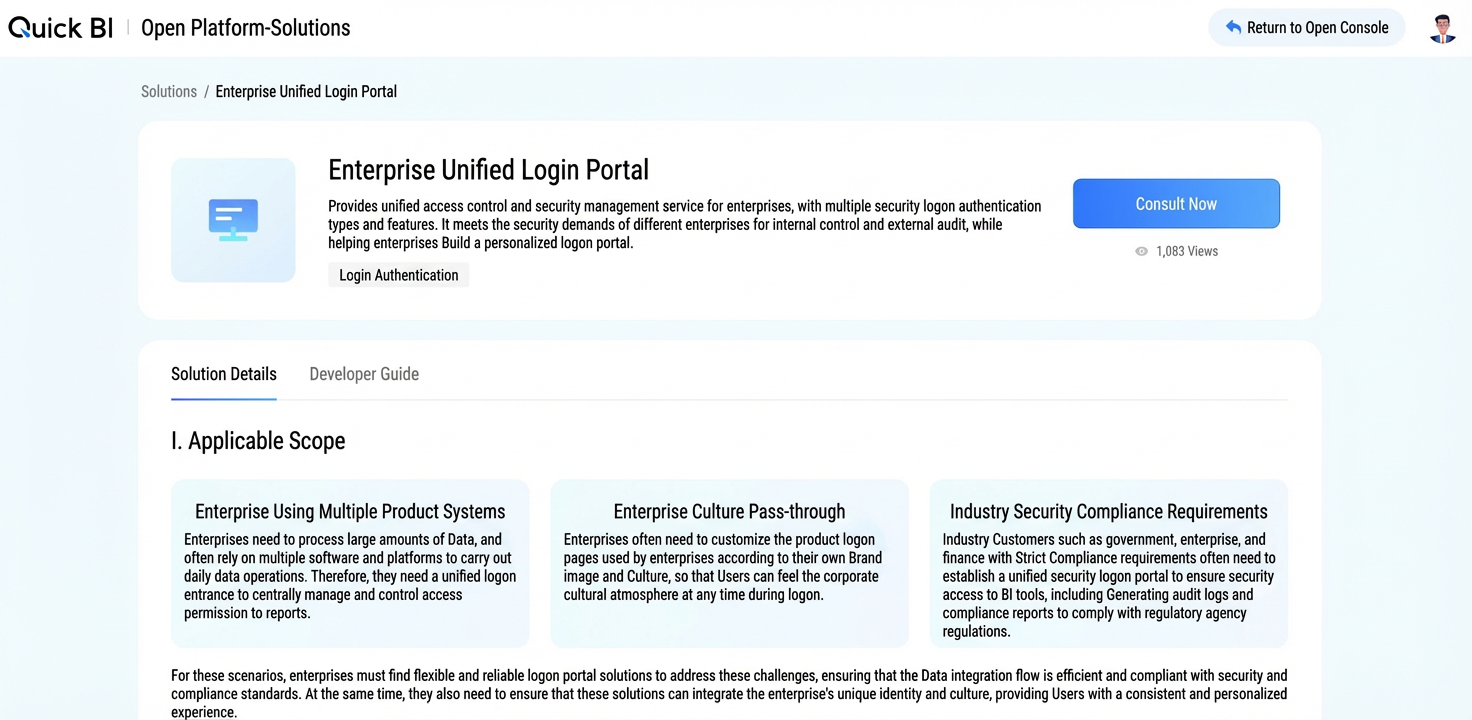 You can design
 user groups based on yourorganizational structure. For more information, see User Group.You can then grant access to resources based onuser groupmembership.Create a dedicated workspace for the finance department for isolated development, collaboration, and permission control
Create a dedicated
workspacefor the finance department. In thisworkspace, you can configure default permissions for actions like exporting or downloading reports and portals. For more information, see Create and Manage Workspace.Provide executives with integrated reports from multiple data sources
Option 1: Embed multiple reports in a portal. This approach is useful when you have a large amount of content and want to view financial and business data on separate dashboards within a single
data portal. For more information, see Data Portal.Option 2: Usecard embeddingin a single report. This creates a more compact cockpit view, allowing executives to see business and financial data on a single screen.Option 3: Create a customcard dashboard. This is ideal for assembling fragmented information from various sources into a single dashboard for daily monitoring. For more information, see Card Dashboard.Use row-level security to manage differentiated data access for multi-level organizations
Multi-level organizations, especially in sales, are often structured by product line, region, or channel. While the analytical methods and monitored metrics are the same across the organization, the scope of data that users can see differs based on their business scope or hierarchical level. For example, a sales director can view data for all regions, whereas a regional manager for East China can only see data for that specific region. You can achieve this using
row-level security. For more information, see Row-level Security.Create a custom card dashboard to access data from multiple sources
Decision support analysts often need to access and understand data from multiple business sources to serve executives. Instead of viewing data through the separate workflows of each department or recreating dashboards—which can lead to inconsistencies—they can create a custom
card dashboard. This approach meets their needs by consolidating data from various sources into a single view. For more information, see Card Dashboard.
4. Conclusion
Data collaboration, sharing, and security governance are closely tied to an organization's structure, business processes, and security policies. This article has outlined common challenges and their solutions using Quick BI. Quick BI also offers more granular capabilities to help you design a system that is both collaborative and secure. These include custom roles to control feature access, row-level security using tag-based association tables, and distinct permission configurations for roles at the organization and workspace levels. These features allow you to tailor a governance framework to your company's specific needs. Learn more about Quick BI >>
For more information or to discuss your needs, please contact us through the official Lingyang website or other channels.