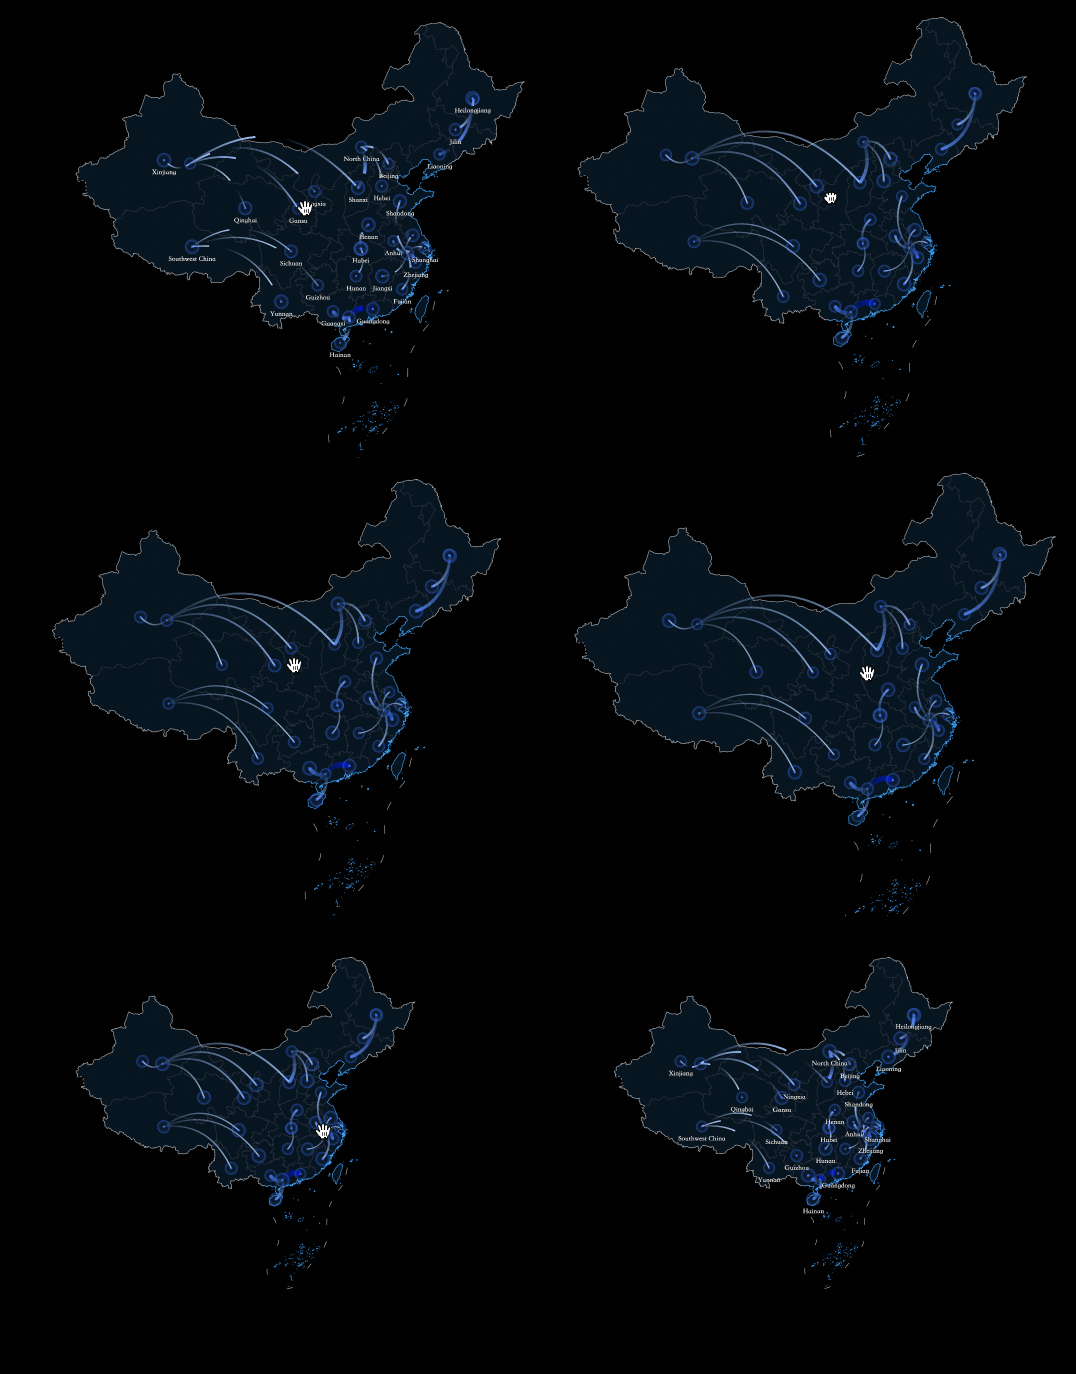
Fly Line Map
A fly line map uses a map as a background and dynamic lines to visualize data relationships between regions. You can add data to a fly line map and configure its style.
Prerequisites
A data visualization screen has been created. For more information, see Create a Data Visualization Screen.
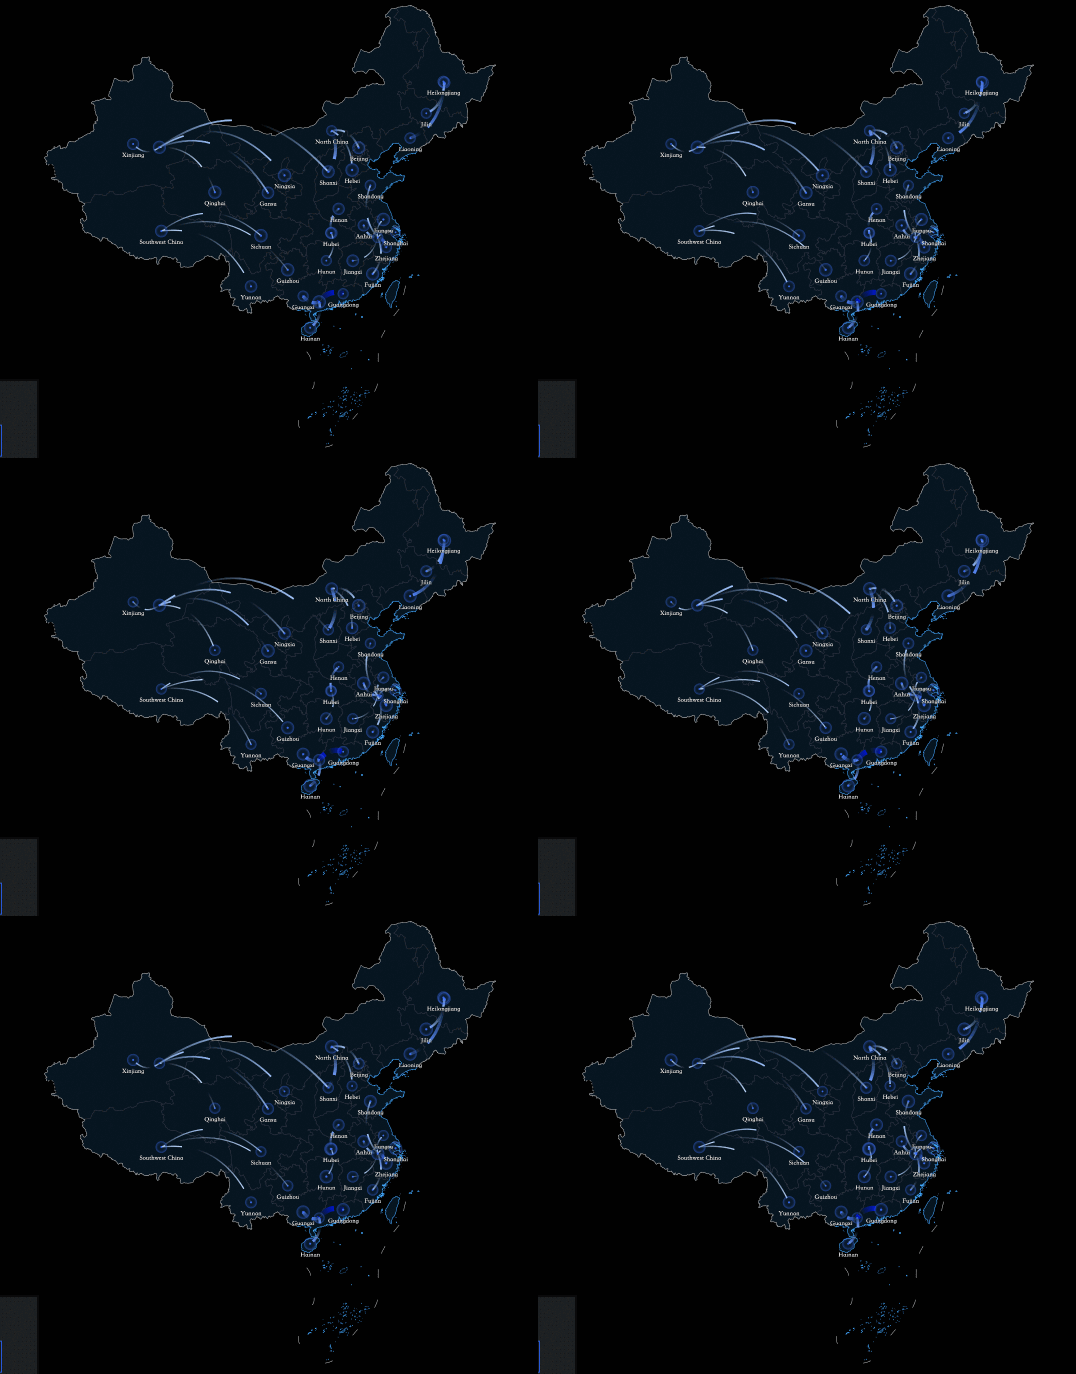
Sample image
Configure chart fields
-
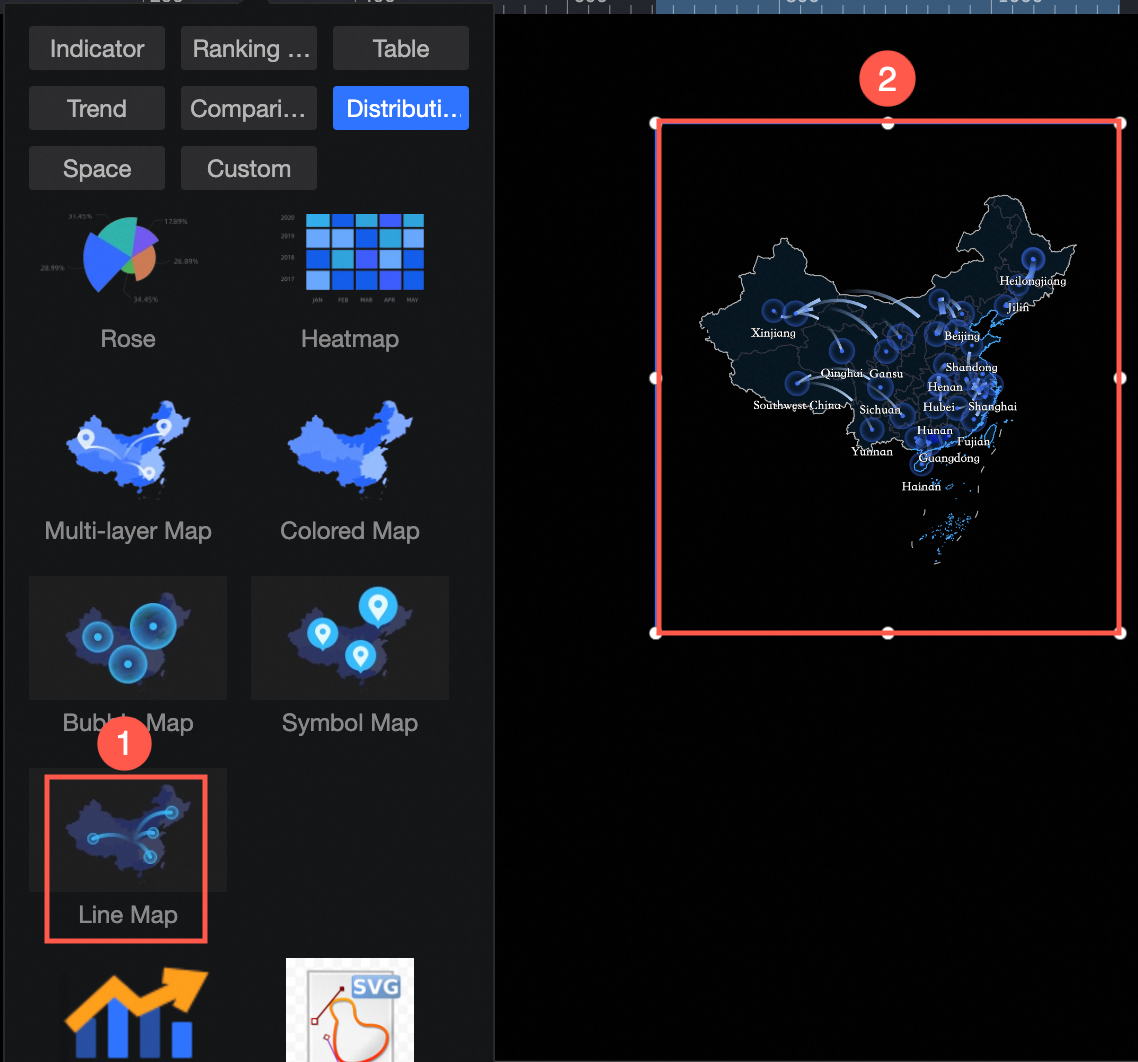
In the Charts section of the component library, find Fly line map and drag it to the canvas.
-
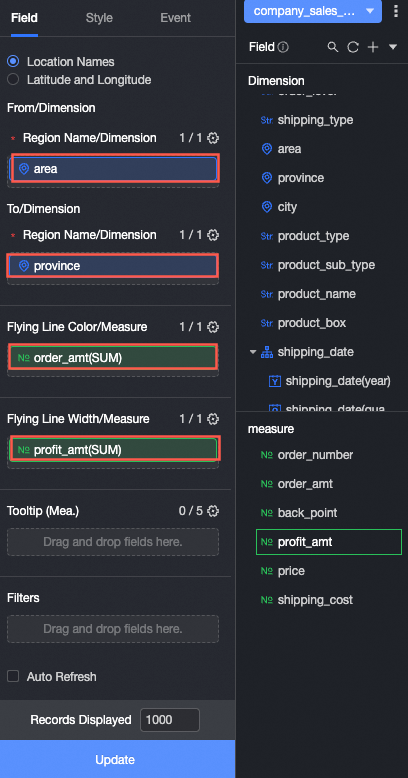
On the Field tab, select the desired dimension and measure fields.
-
You can specify geographic information using either Area Name or Latitude and Longitude.
If you select Area Name, double-click or drag Region to the Area Name/Dimension field under From/Dimension, and double-click or drag Province to the Area Name/Dimension field under To/Dimension. Double-click or drag Order amount to Fly Line Color/Measure, and double-click or drag Profit amount to Fly Line Thickness/Measure.
If you select Latitude and Longitude, double-click or drag a longitude field to Longitude/Dimension and a latitude field to Latitude/Dimension under both From/Dimension and To/Dimension. Double-click or drag Order amount to Fly Line Color/Measure, and double-click or drag Profit amount to Fly Line Thickness/Measure. The Location Label/Dimension field is optional.
-
-
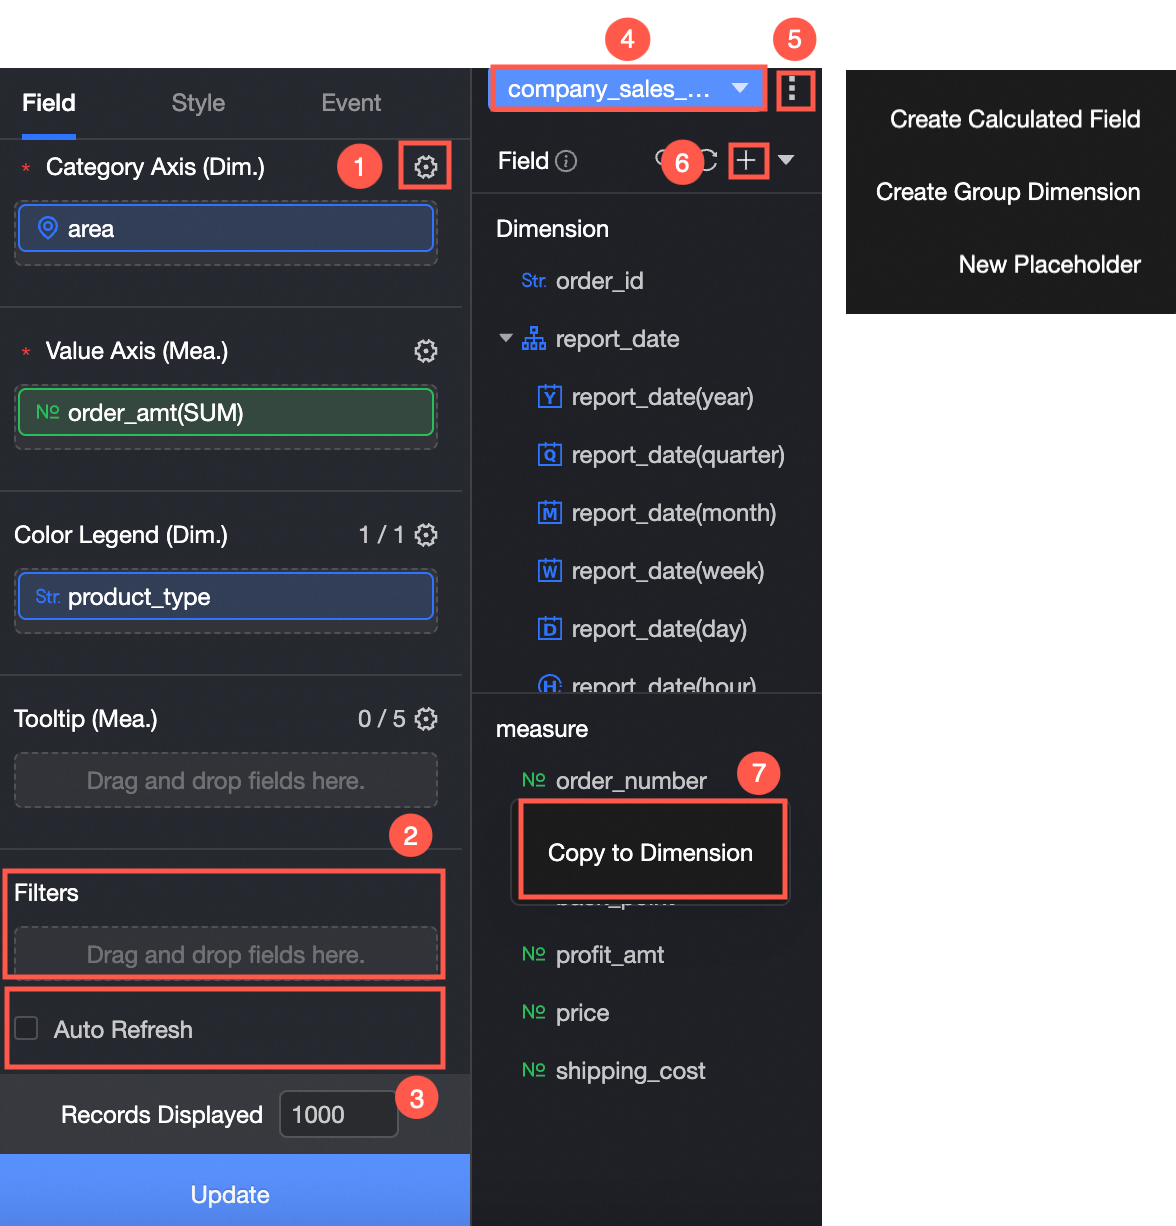
You can also perform the following data operations:
-
Configure field formats in batches (①). For more information, see Configure field styles in batches.
-
Set field filters (②). For more information, see Filter data.
-
Enable auto-refresh for data (③). For more information, see Refresh data at scheduled intervals.
-
Switch datasets (④). For more information, see Switch datasets.
-
Edit datasets (⑤). For more information, see Edit datasets.
-
Process data (⑥). For more information, see Create Calculated Field, Create a Grouped Dimension, and Create a Placeholder.
-
Copy fields (⑦). For more information, see Copy and convert to a dimension.
-
Configure chart style
The following style settings are specific to this chart. For general chart style settings, see Configure Chart Style.
-
Map Area
Configure the following settings:
-
For Display Range, you can select Automatic or Custom.
Note-
The automatic range adjusts based on the data. You can also set a custom range manually. In interactive analysis scenarios, the range is always automatic.
-
The custom display range currently supports only global continents and countries, and regions, provinces, and cities in China.

You can also adjust the map manually. If you enable Manual Adjustment, the current centroid and scaling values are automatically populated and can be modified.

-
-
In the Outline and Fill section, you can configure the background color of areas and the color of outlines.
NoteOutlines are not supported for some areas.
-
You can select Enable Drag and Enable Zoom to drag and zoom the chart in the preview.
-
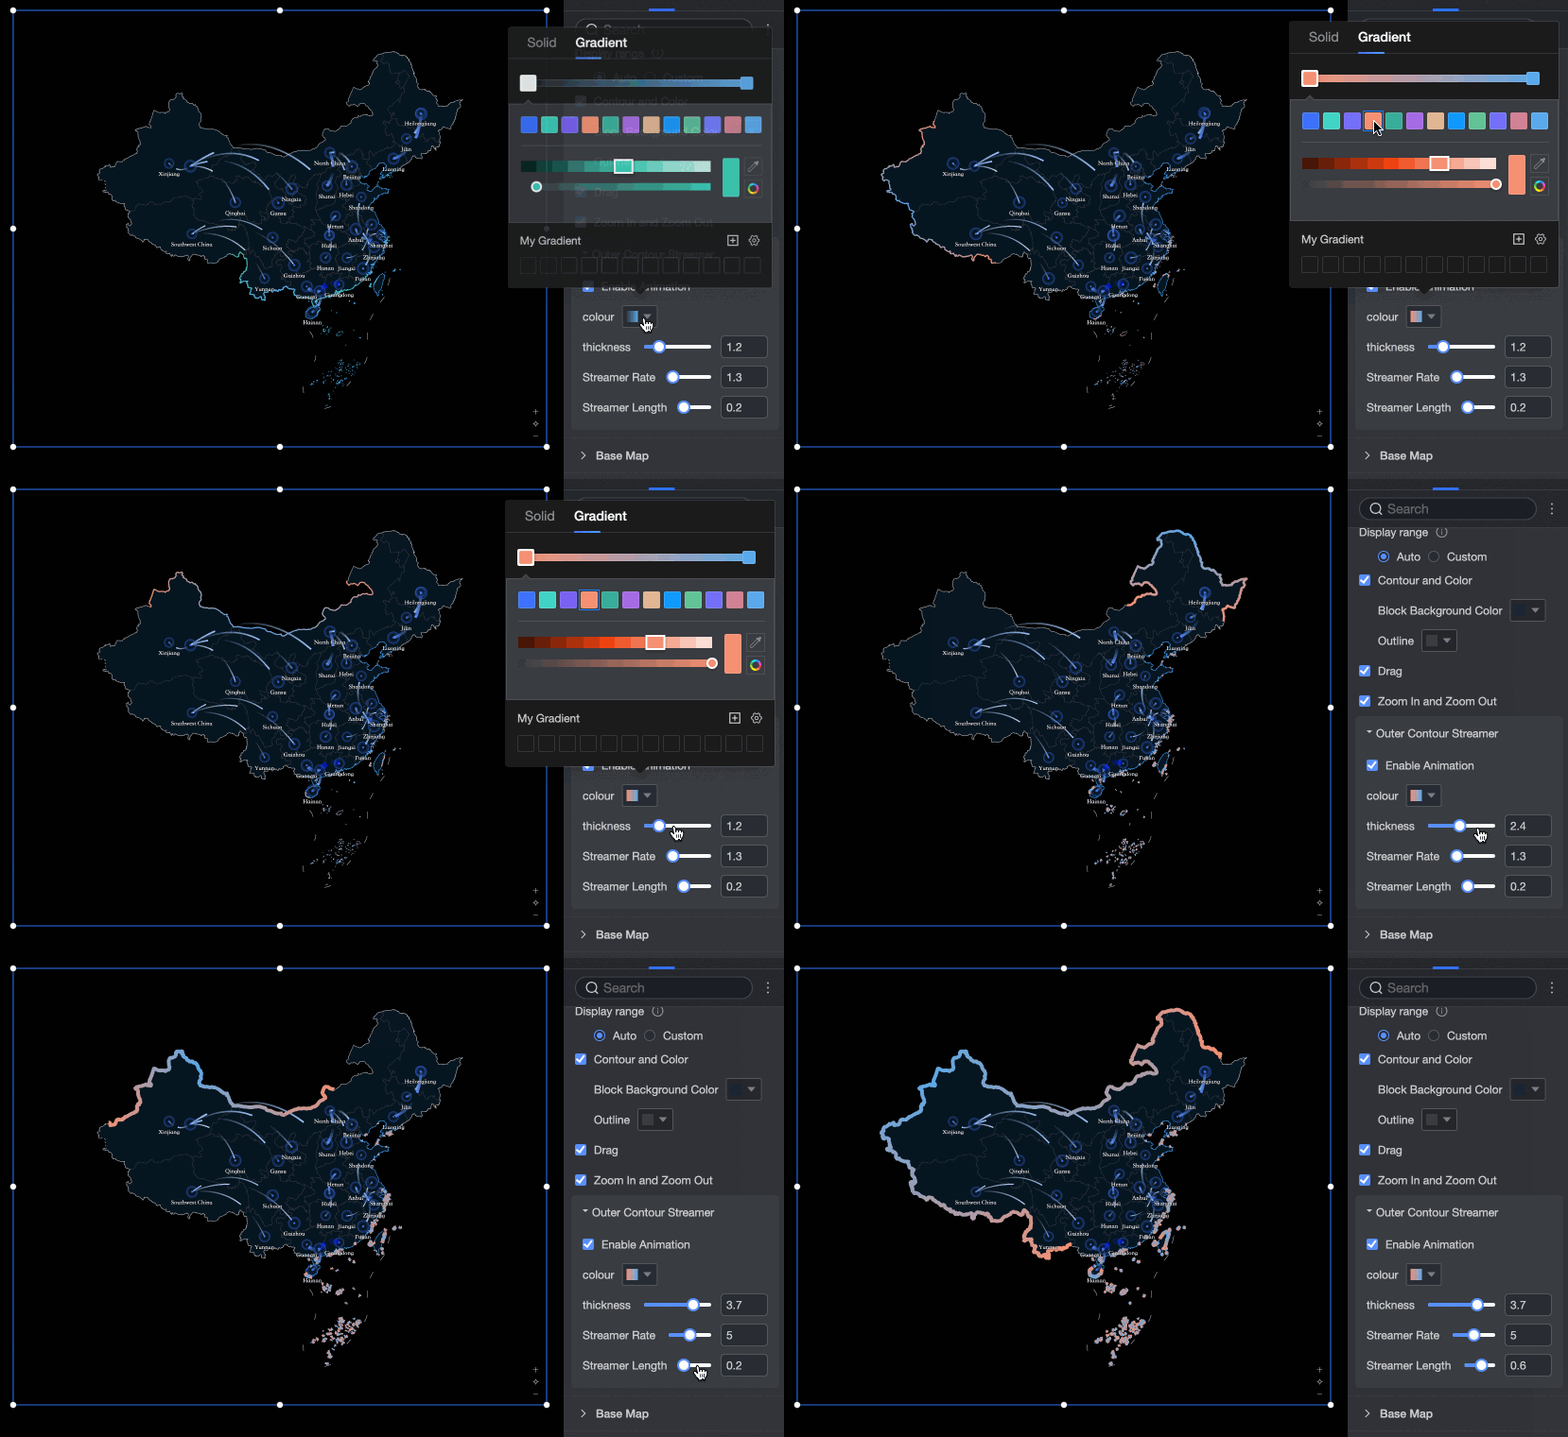
In the Outer Outline Streamer section, enable this feature to set the Streamer Color (Solid/Gradient), Thickness, Speed, and Length.
-
-
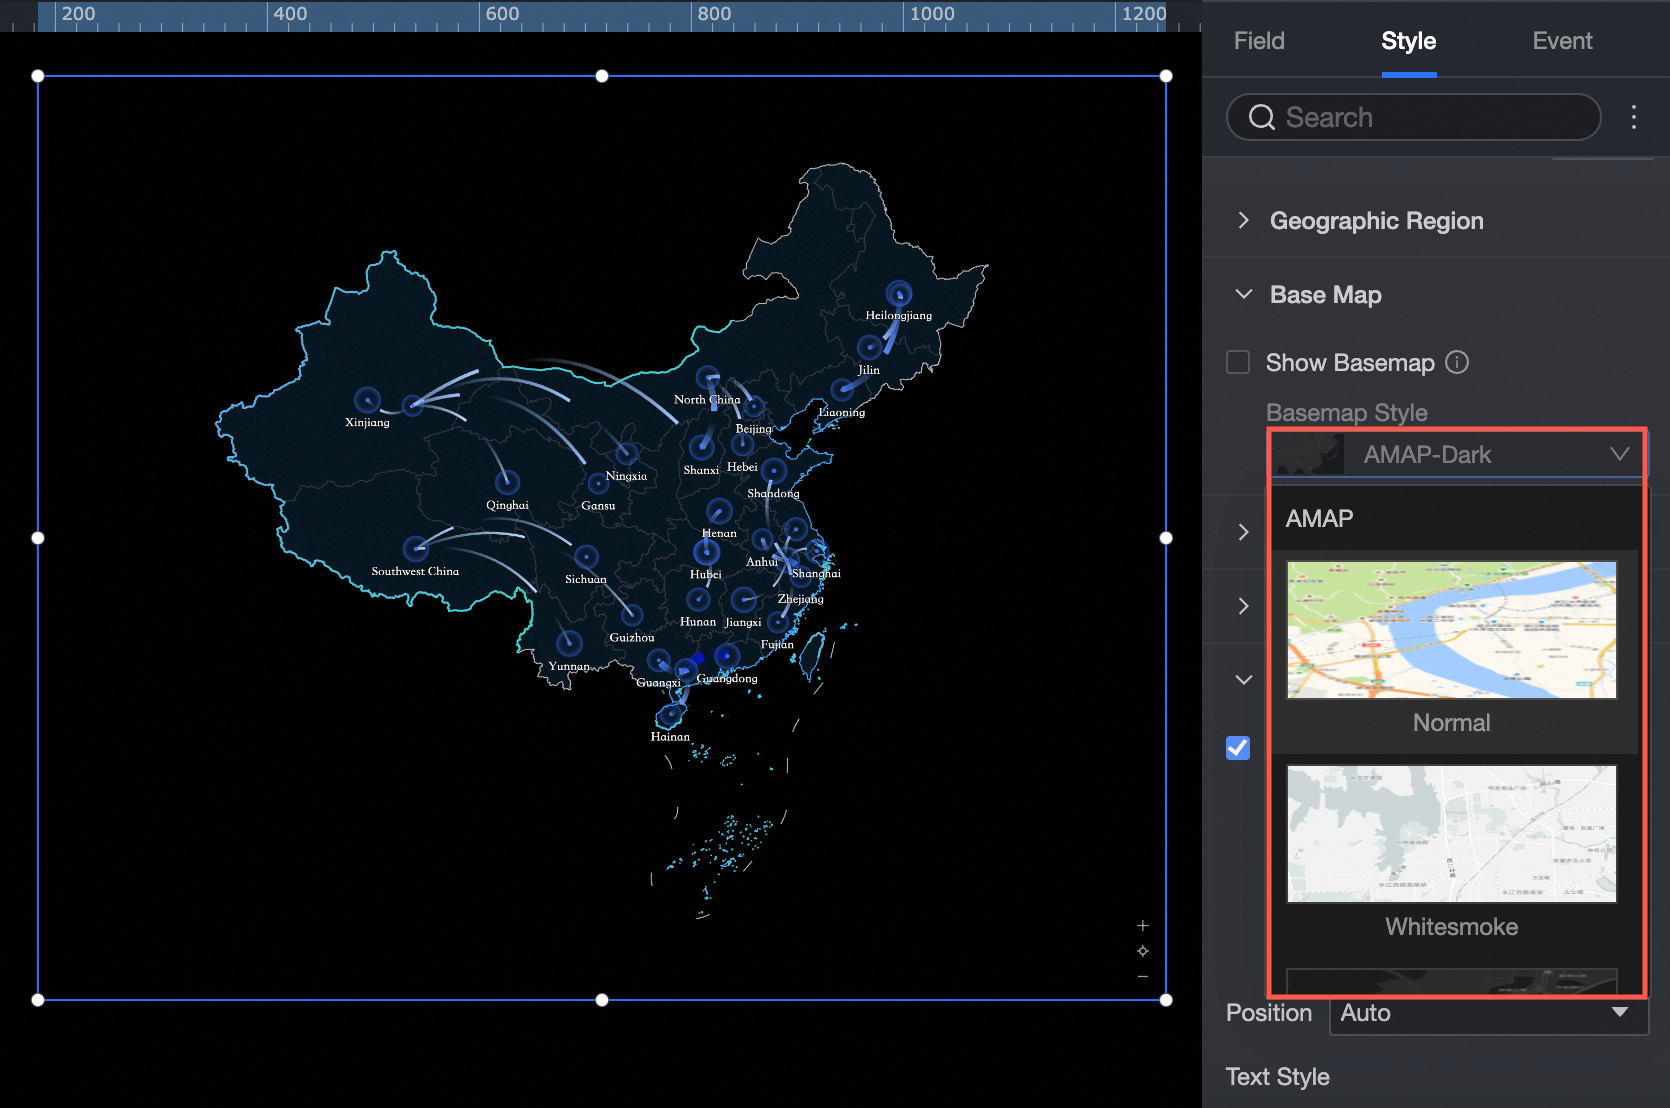
In the Show Basemap section, you can select a style for the Amap basemap.
-
Fly Lines
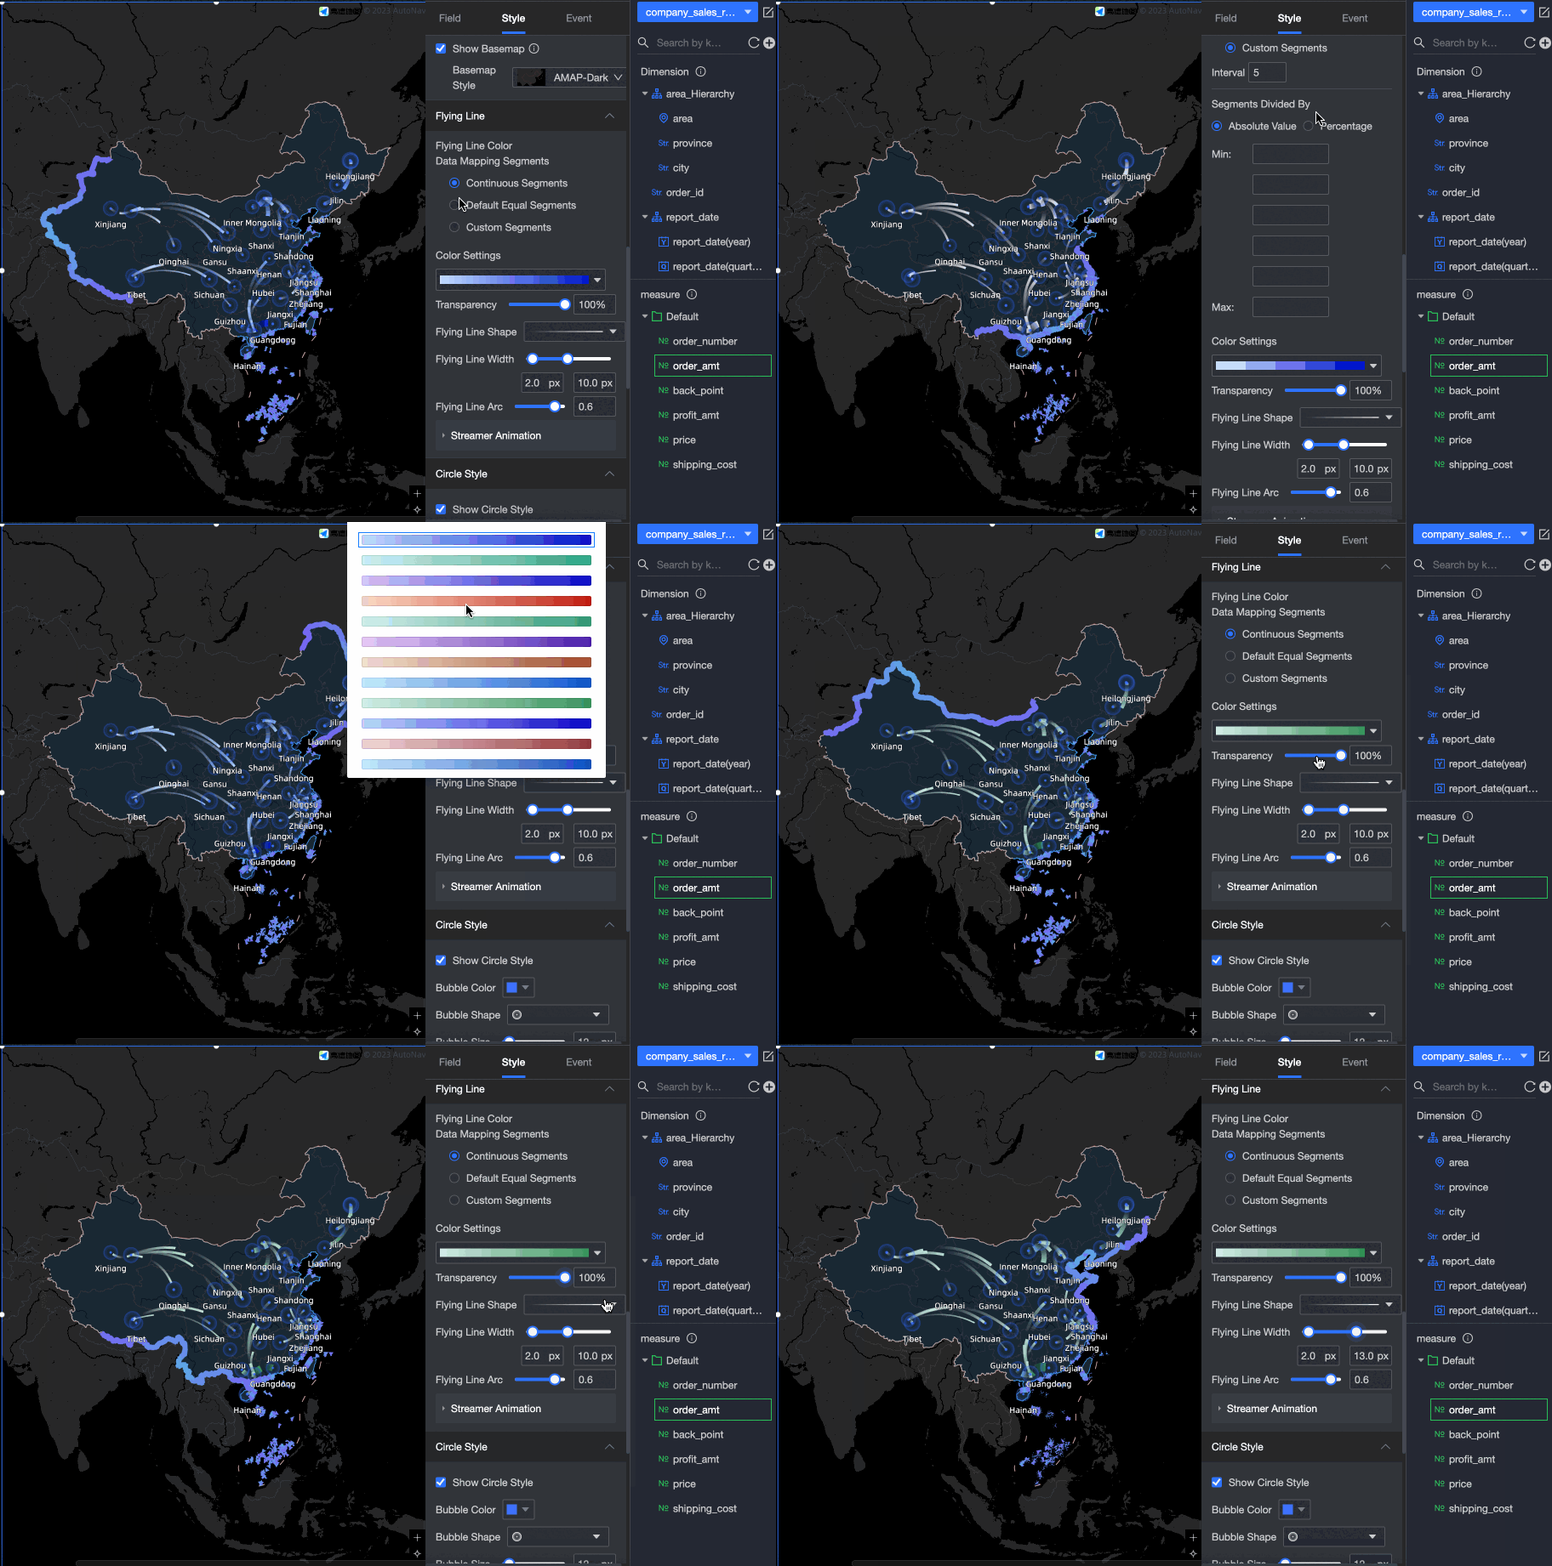
In the Fly Lines section, you can set the Data Mapping Range, Fly Line Color, Opacity, Fly Line Shape, Thickness, Curvature, and Streamer Animation.
If you enable Streamer Animation, you can set the animation Duration and Interval.
-
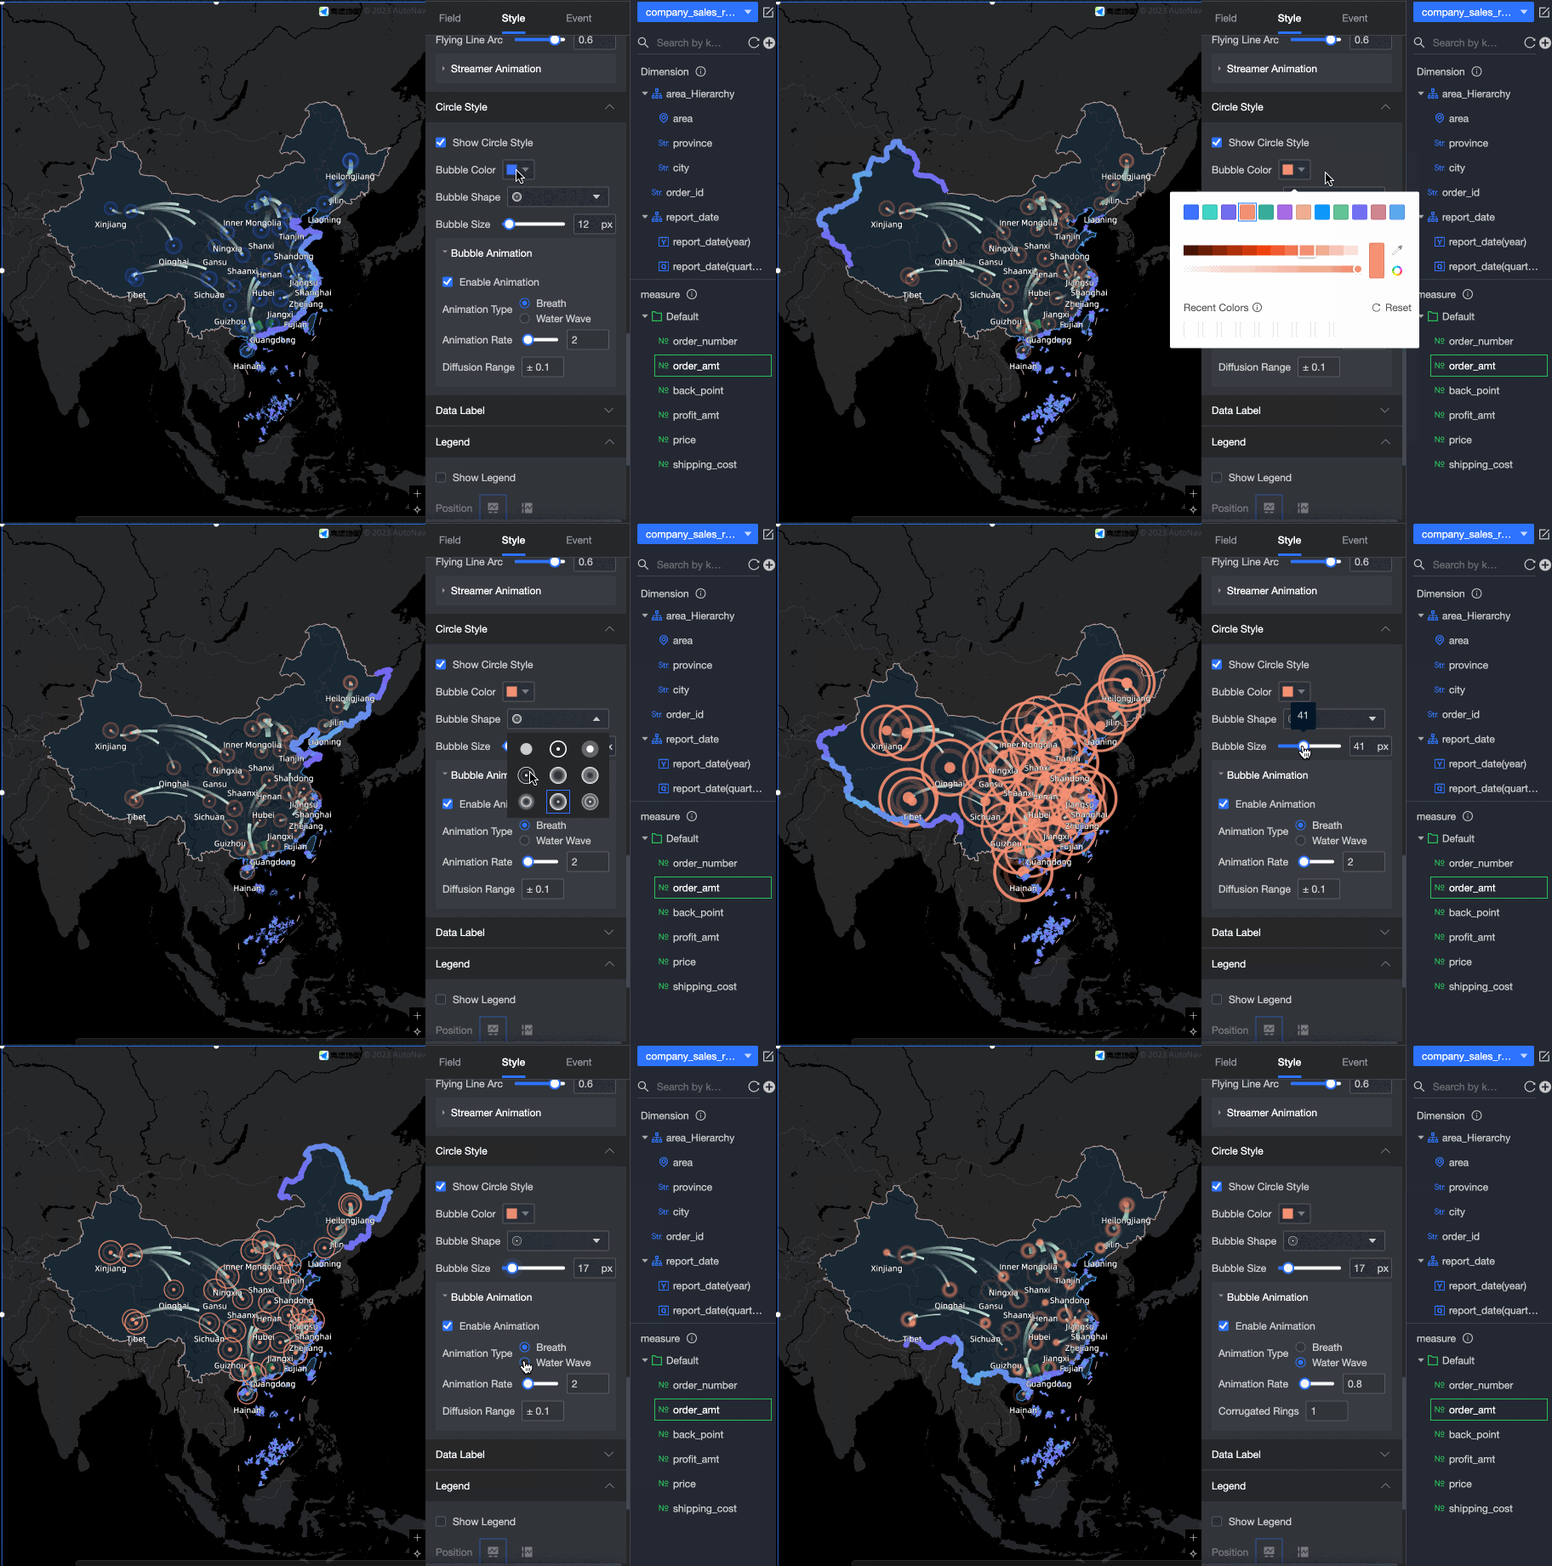
Endpoint Bubbles
If you enable Endpoint Bubbles, you can set the bubble color, shape, size, and bubble animation.
If you enable Bubble Animation, you can set the Animation Type (Breathing/Ripple), Animation Speed, Diffusion Range, and Number of Ripple Rings.
-
Data Labels
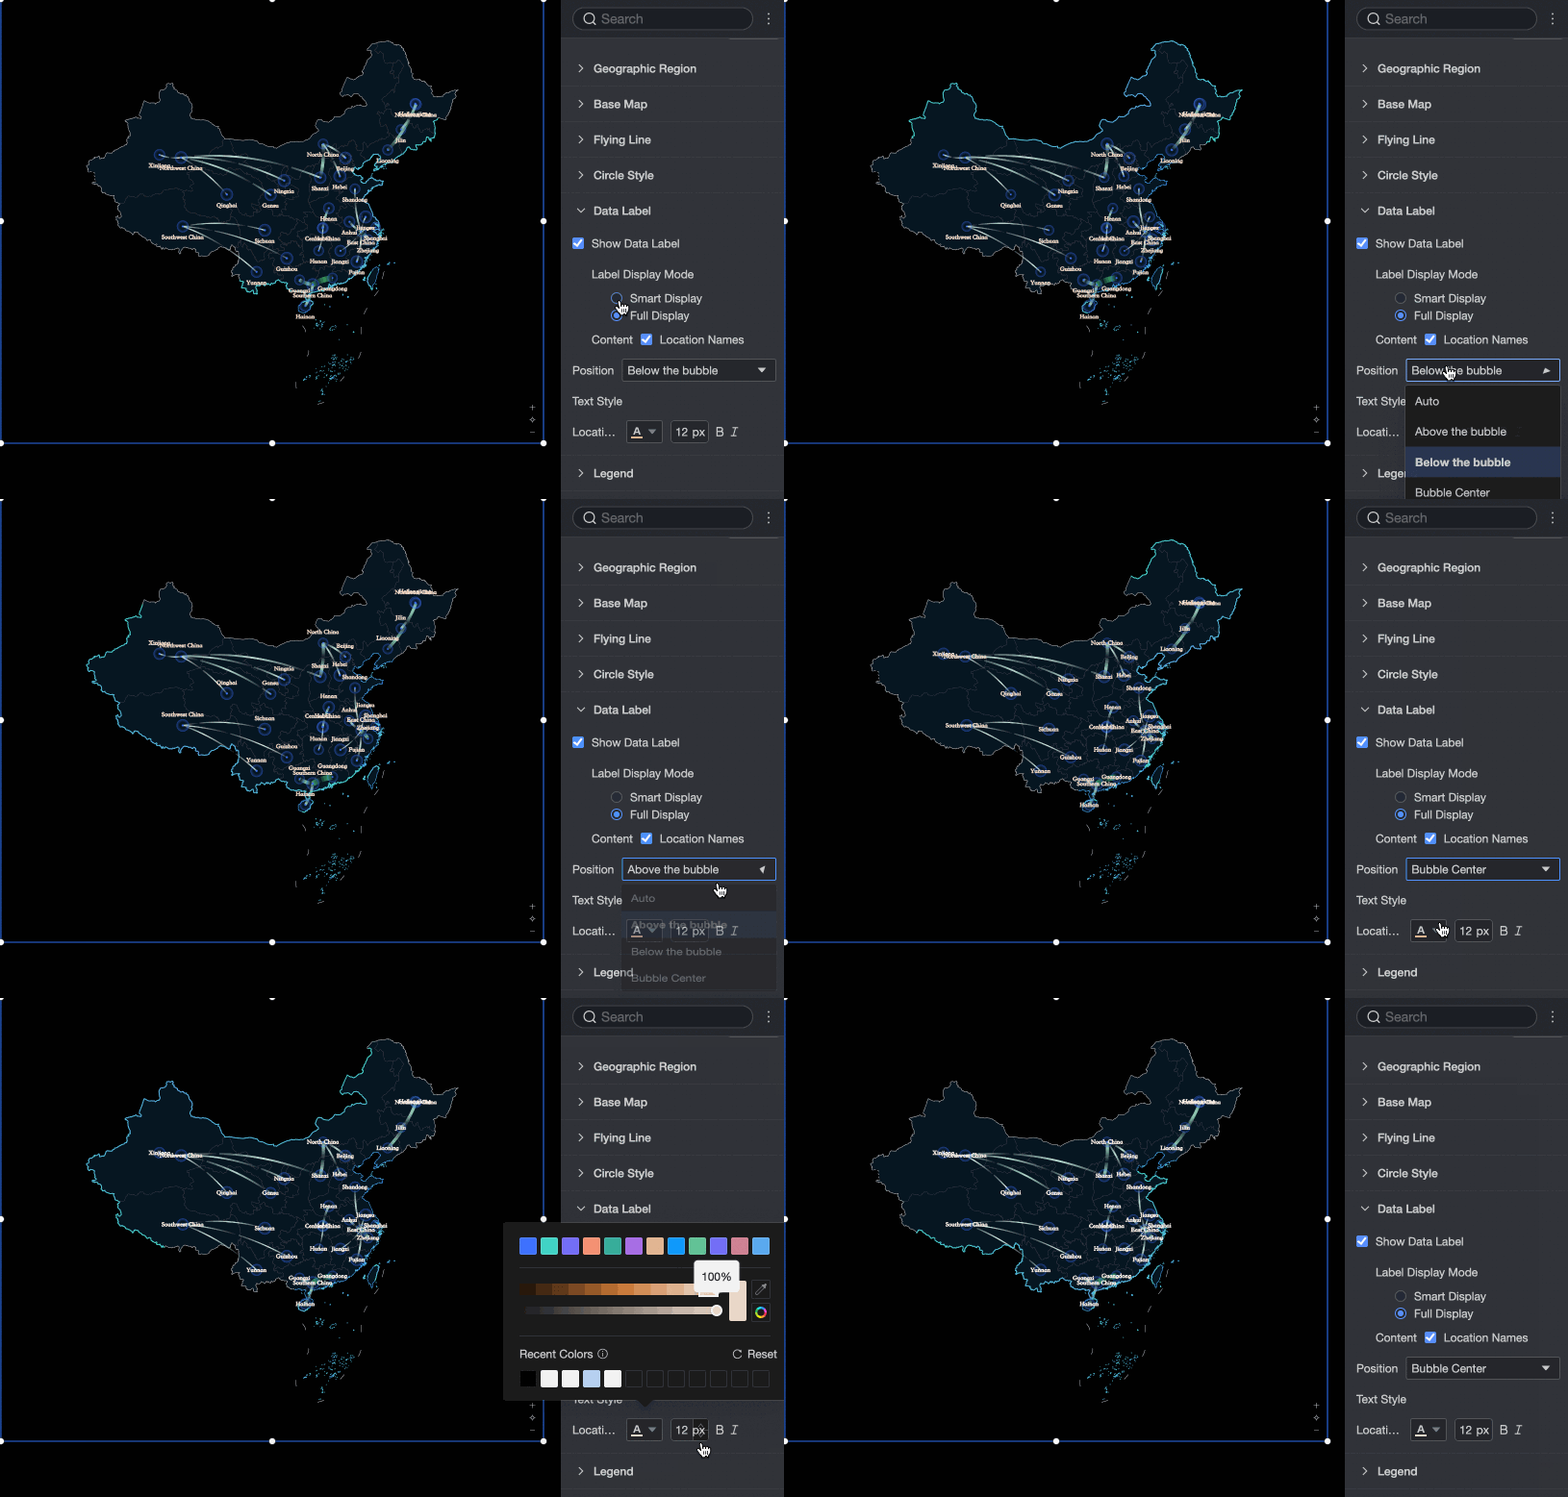
If you select Show Data Labels, you can configure the following settings:
-
Label Display Mode: You can select Smart Display or Full Display. Smart Display is best for maps with many place names.
-
Content:
If you create the map in Area Name mode, you can show the area name.
If you create the map in Latitude and Longitude mode, you can show the latitude and longitude. If you configured Location Label/Dimension, you can also show the location label.
-
Label display format: You can select Smart Display or Full Display. Smart Display works well for maps with many place names.
-
Position: The default is Auto. You can also select Above Bubble, Below Bubble, or Center of Bubble.
-
Text Style: You can configure the text style for the area name and latitude/longitude data labels.
-
-
Legend
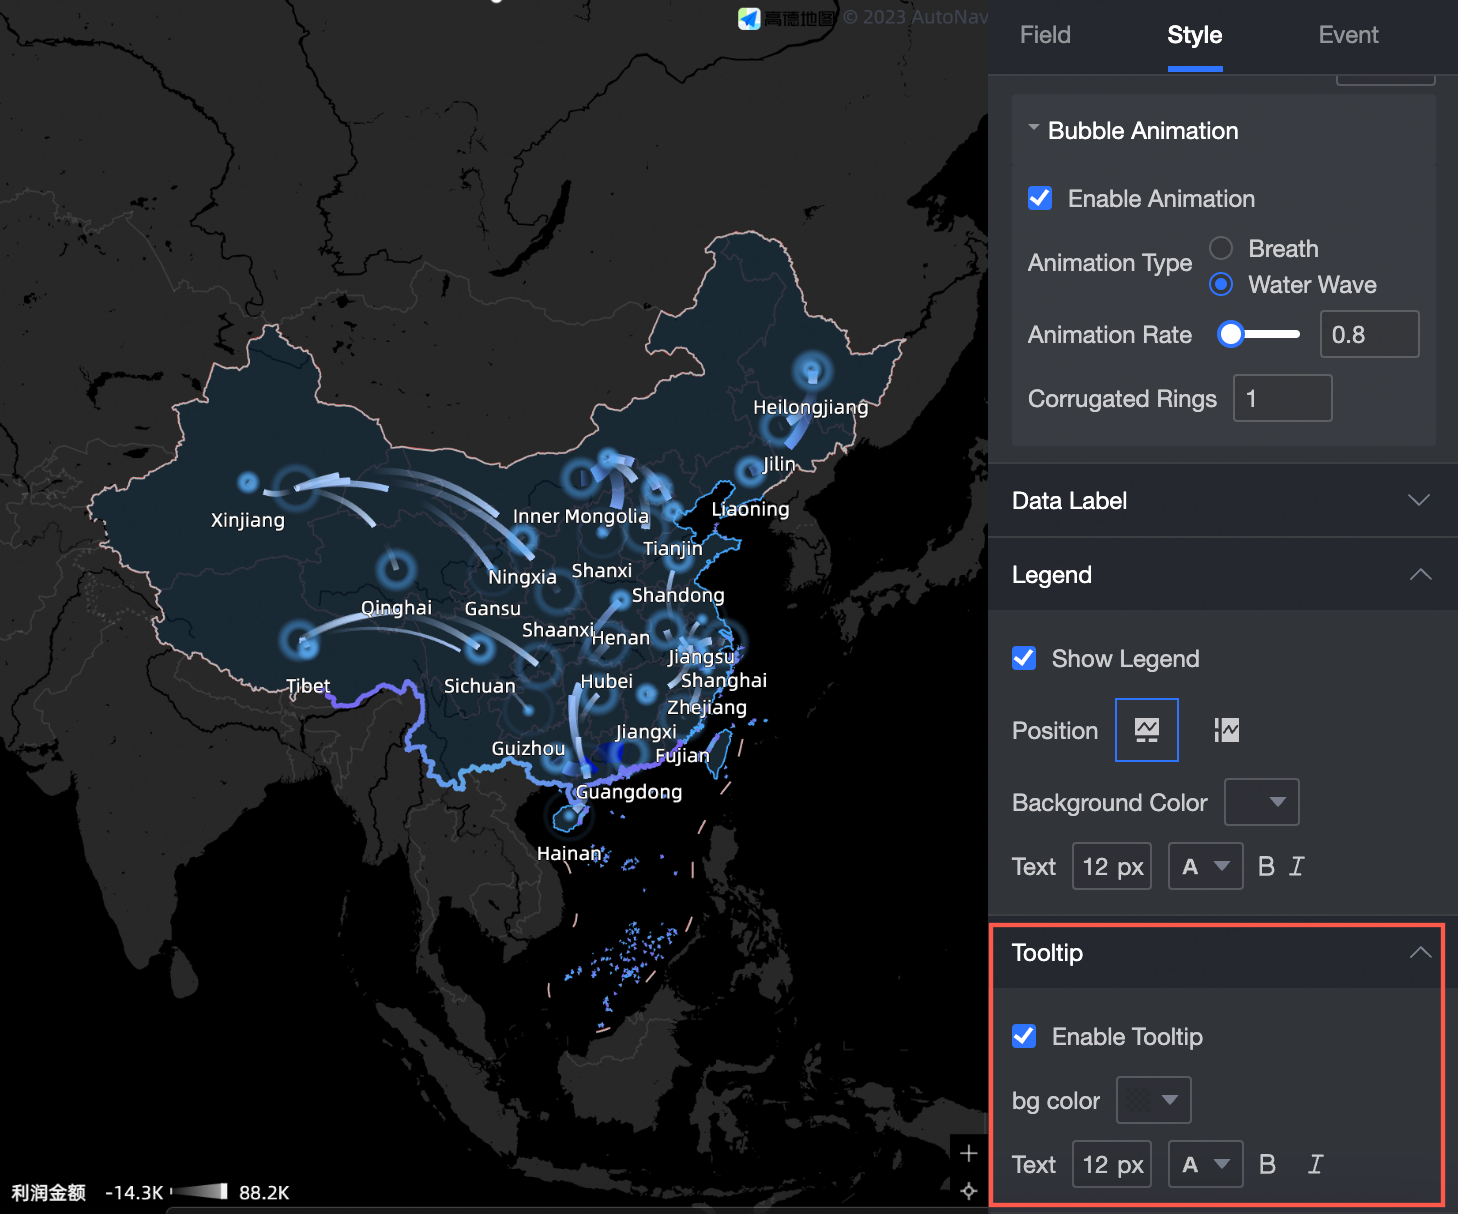
In the Legend section, you can show or hide the legend and configure its position, background color, and text style.
-
Tooltip
In the Tooltip section, you can Enable Tooltip.
When enabled, a tooltip appears when you hover over an area.
Configure chart events
Configuration Item
Name
Configuration graph
Description
Layer Event
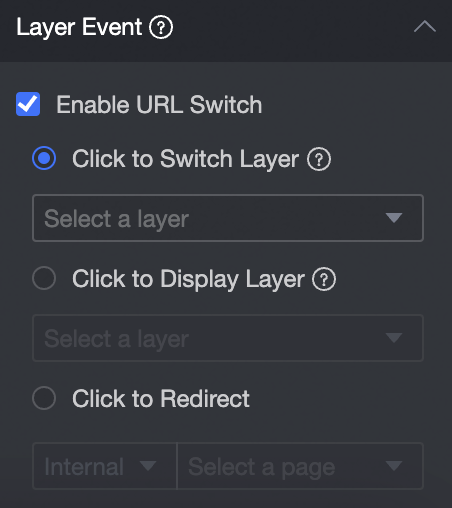
Enable Link Redirection
For layer events, you can choose one of three actions: Enable Link Redirection, Open Layer on Click, or Go to Page on Click. For more information, see Set Click Events.