The intelligent Q&A feature in a dashboard lets you quickly generate an analysis chart from a dataset using natural language and save it to the dashboard.
The public beta for the intelligent Q&A feature in dashboards has ended. This feature is no longer available for use or subscription. Starting from April 1, 2024, new customers cannot use this feature. Some customers who used the feature during the public beta period may temporarily retain access, but this access will be gradually phased out. If you have any questions, contact Quick BI customer service.
Prerequisites
Log on to the Quick BI console and go to the dashboard editing page. For more information, see Create a Dashboard.
Limitations
The intelligent Q&A feature is available only in the Professional Edition.
Procedure
On the dashboard editing page, click the
 icon in the top menu bar.
Select a dataset to analyze.
Select a dataset.
Perform intelligent analysis.
After the intelligent analysis is complete, a green
 icon appears next to the dataset.Note
Hover over the
icon to view the data synchronization time. You can also Re-analyze the dataset or Clear History.If the analysis fails, click Re-analyze.
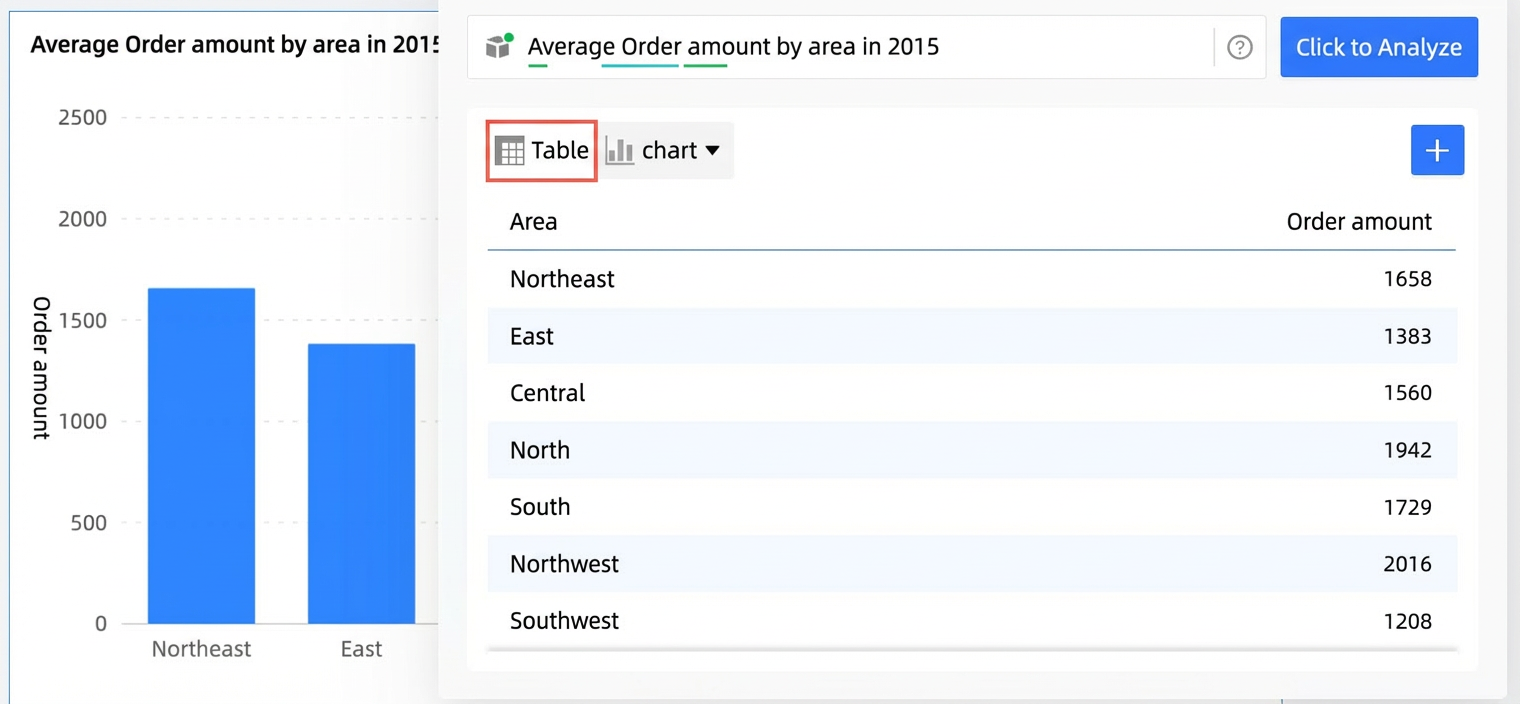
Generate an analysis chart.
Enter a search query and click Analyze.
You can also switch to a table view.
If your search query is not recognized, refer to the sample questions.
Click the ➕ icon to add the chart to the dashboard.