Marquee
You can add marquee controls to a visualization screen and configure their data source, style, and animation effects.
Prerequisites
A visualization screen is created. For more information, see Create a Data Visualization Screen.
Effect
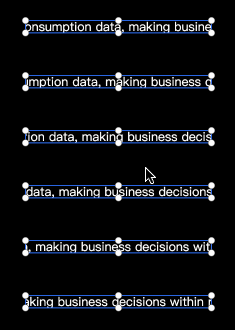
Configuration data
-
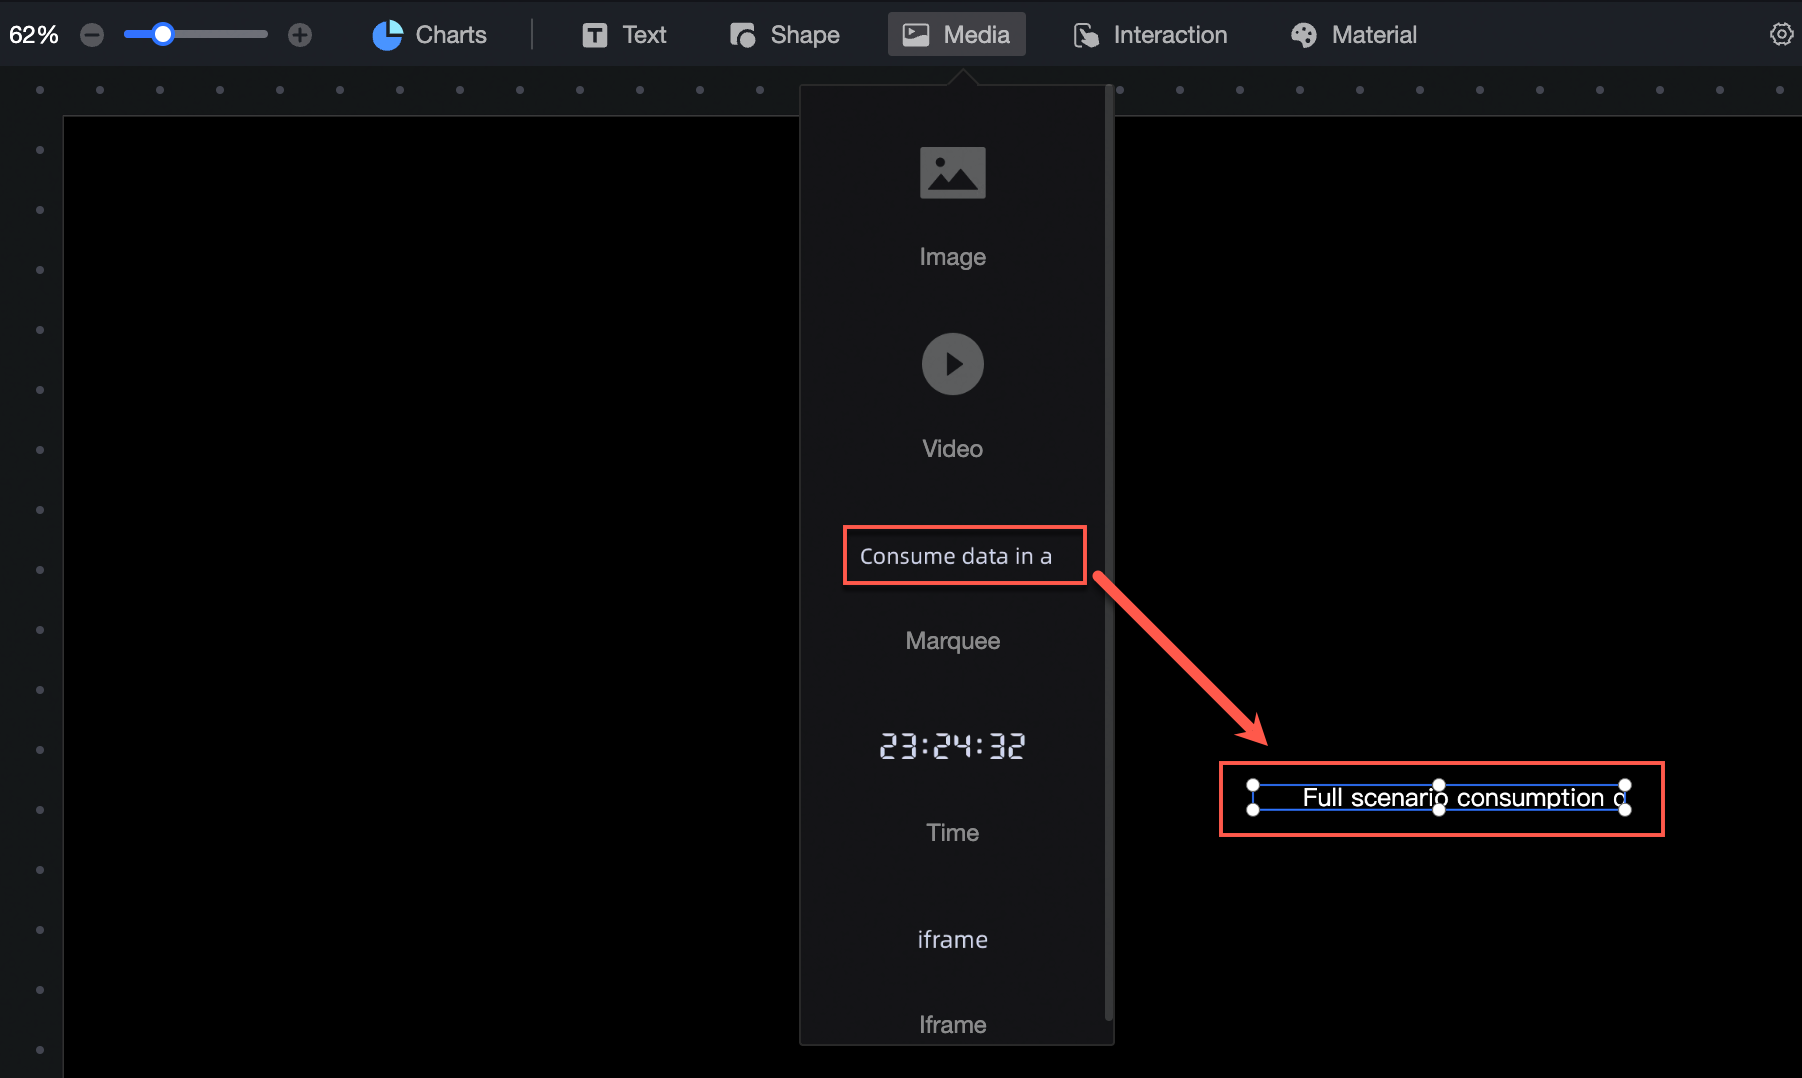
On the dashboard edit page, click Media in the top navigation bar to add marquee controls.
-
Configure fields.
-
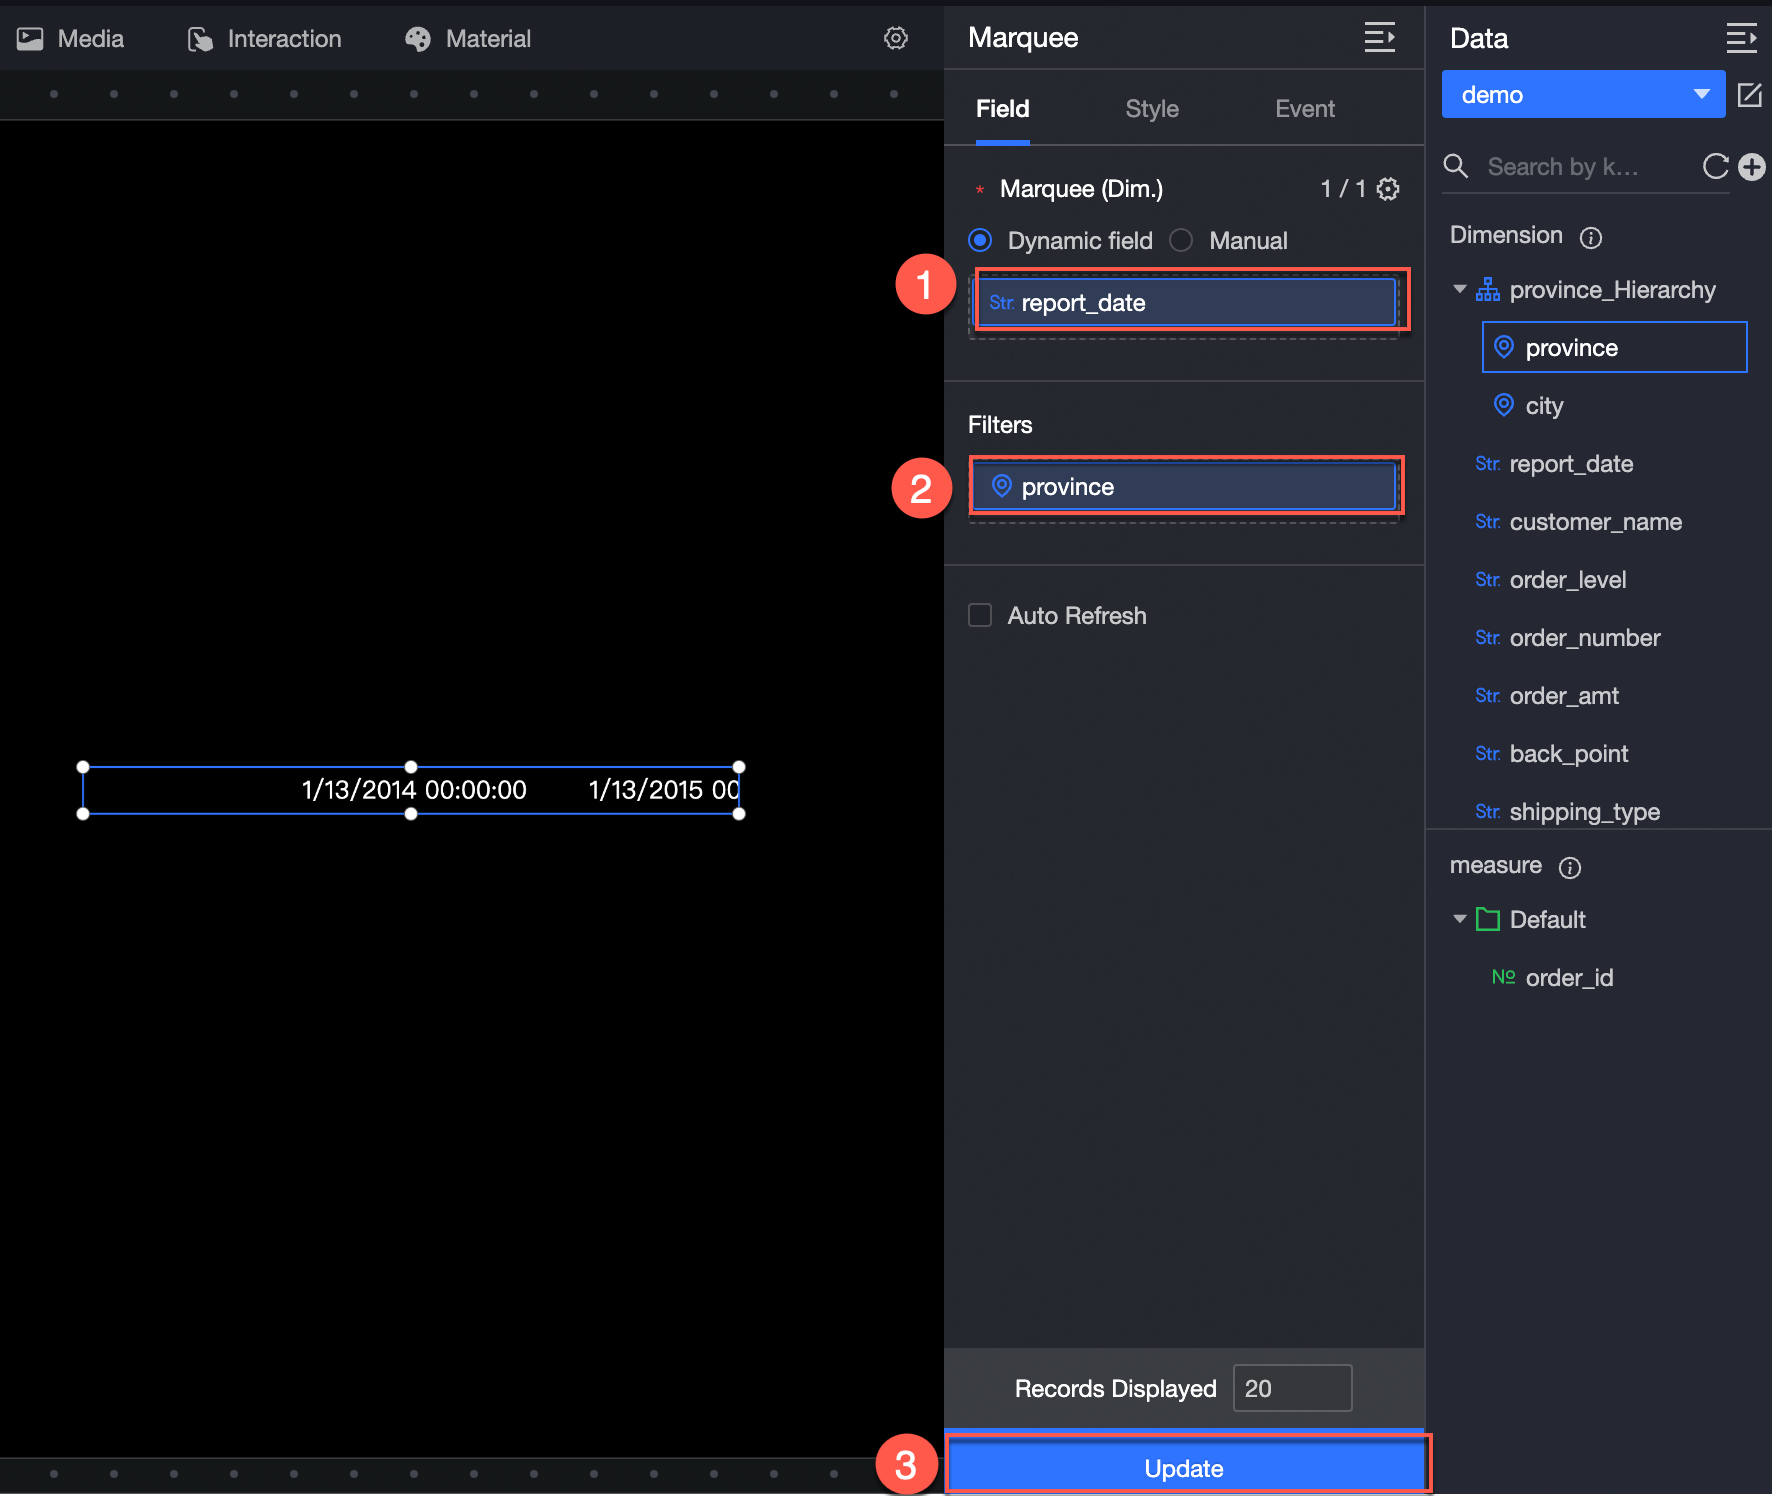
Dynamic Fields: Select Dynamic Fields and follow the instructions in the following figure to add data. The following figure shows the updated marquee.
-
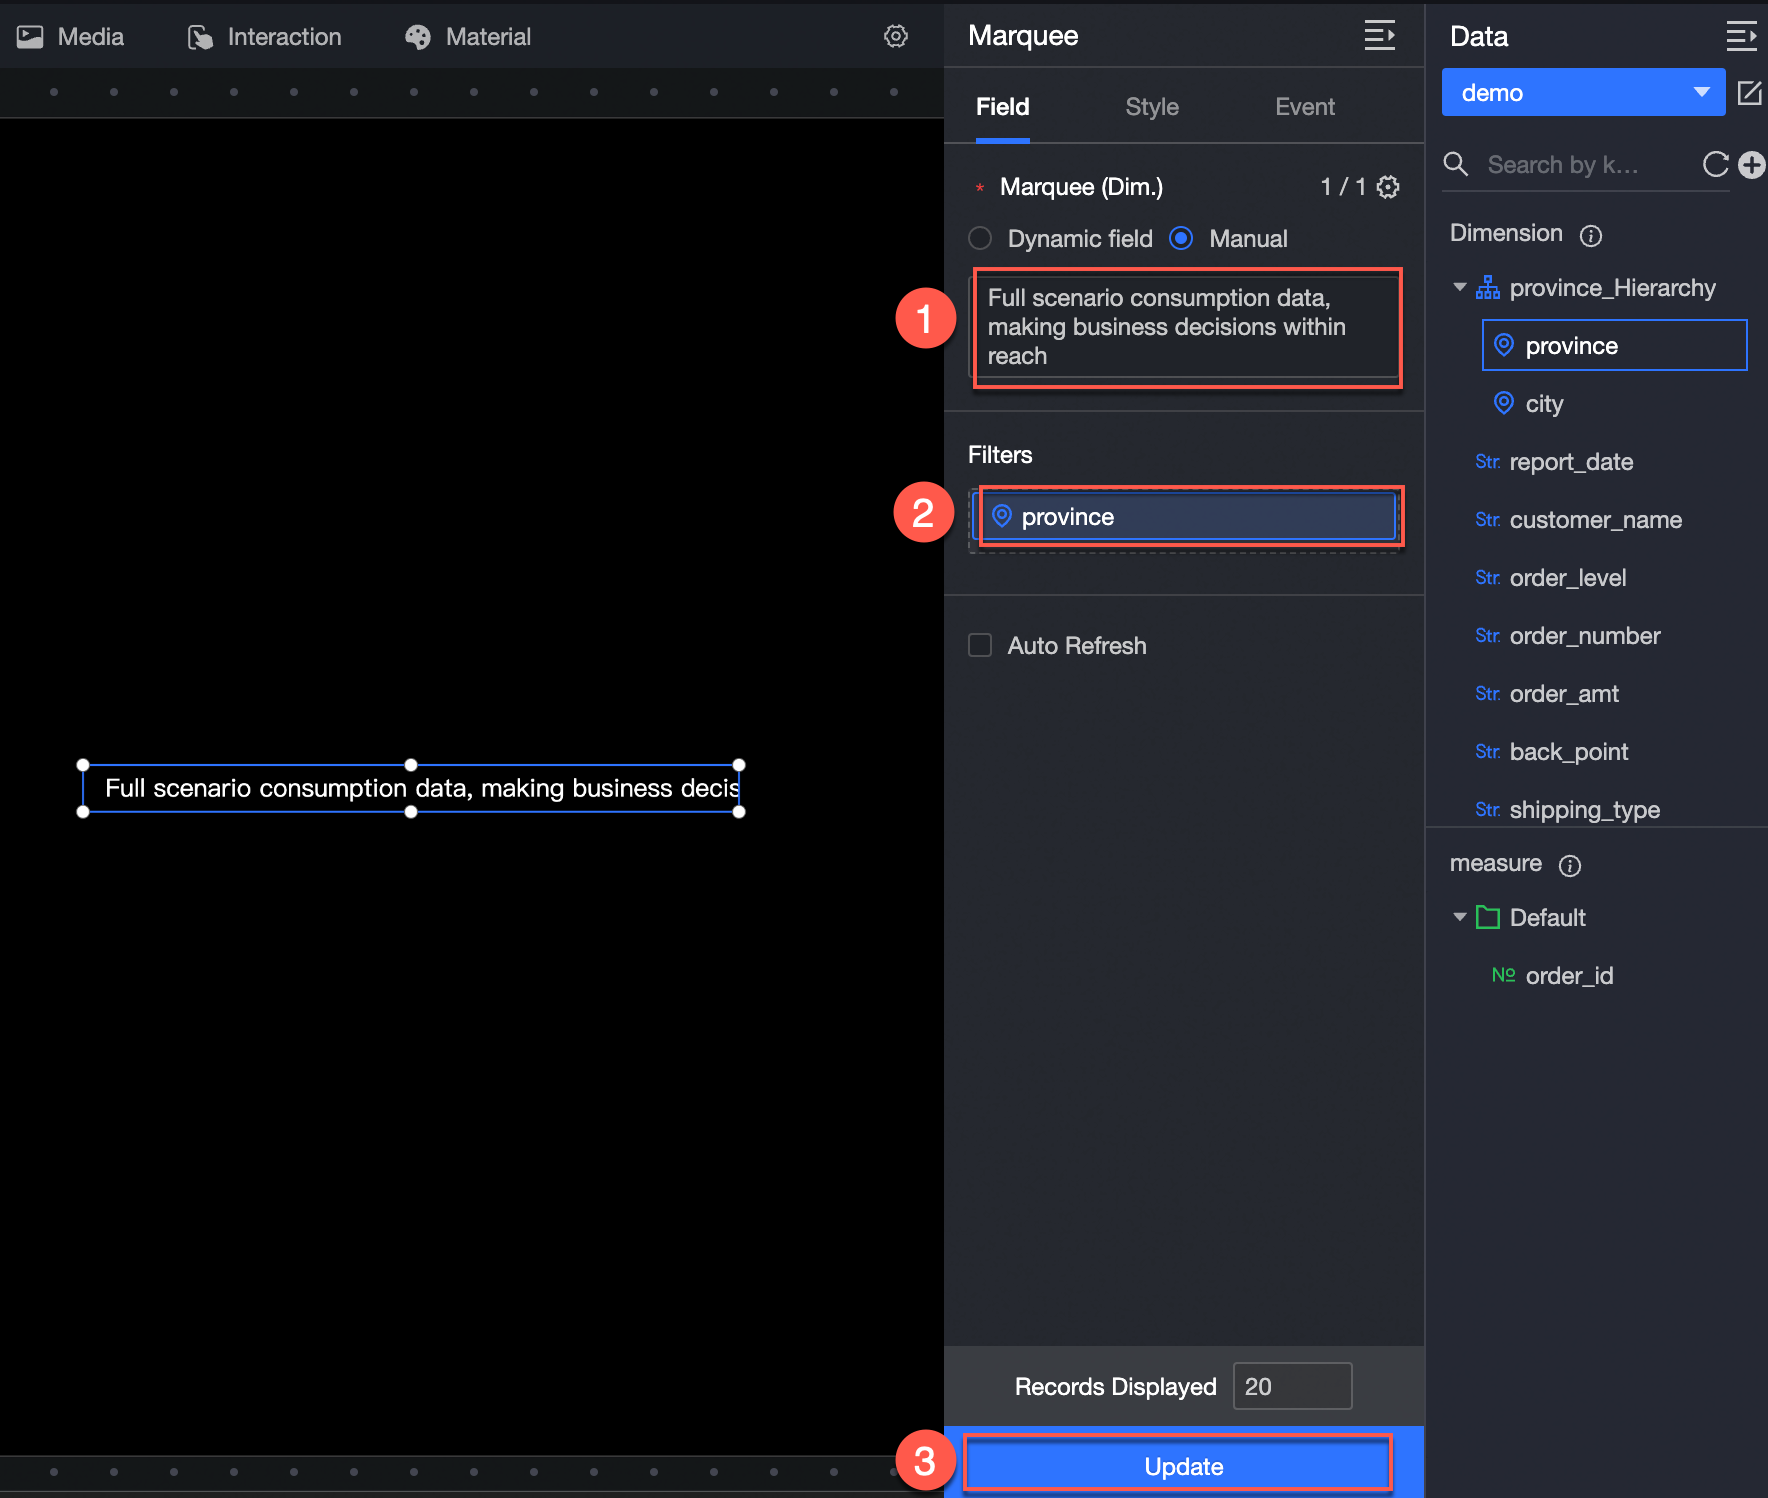
Manual Input: Select Manual Input and follow the instructions in the following figure to add data. The updated marquee is as follows.
-
The following operations are also available: 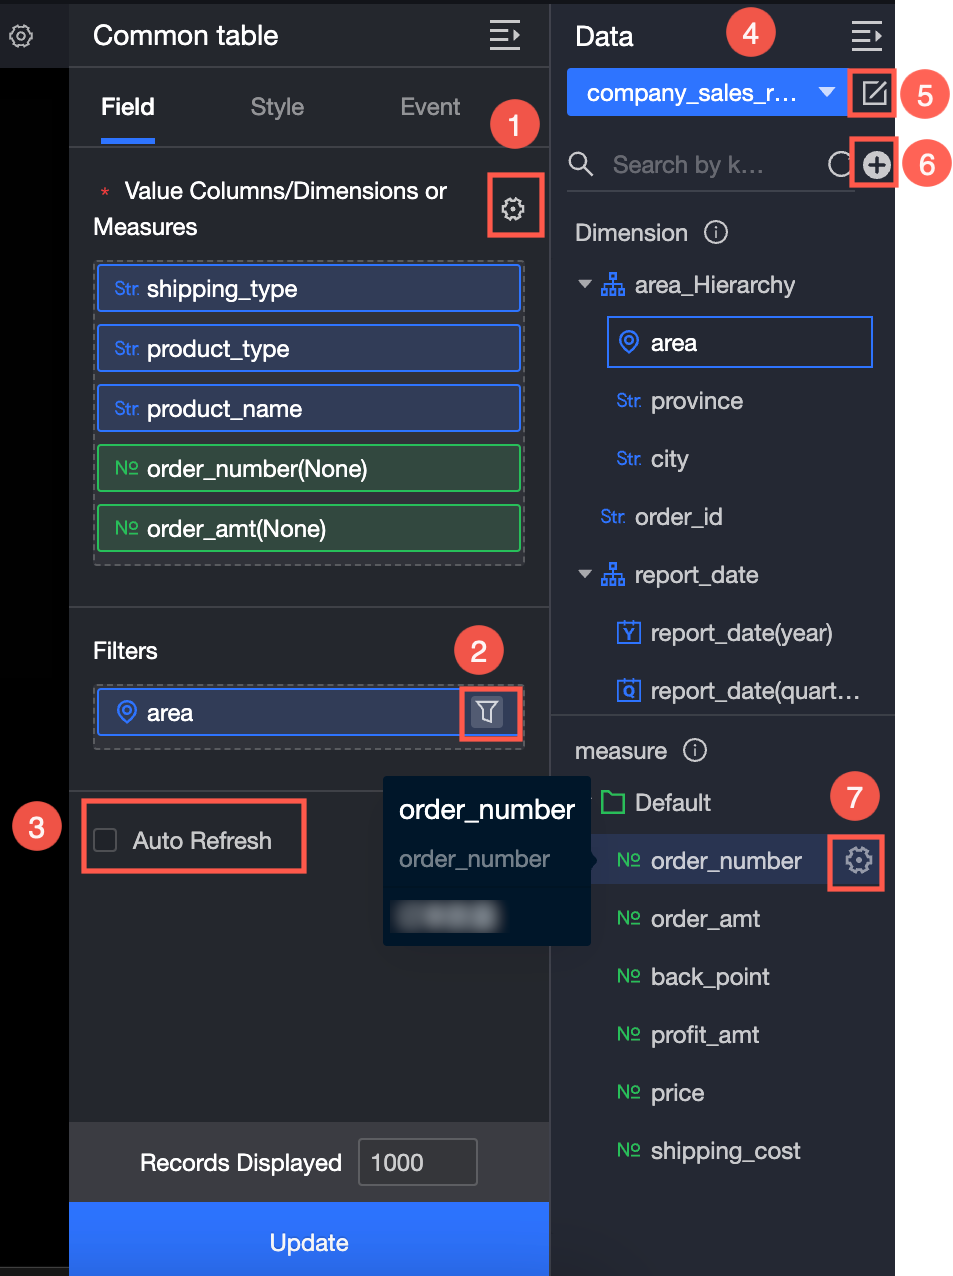
-
Configure multiple field formats. For more information, see Configure multiple field formats.
-
Configure field filtering. For more information, see Filter data.
-
Configure automatic data refresh (③). For more information, see Scheduled data refresh.
-
Switch a dataset. For more information, see Switch a dataset.
-
Edit a dataset. For more information, see Edit a dataset.
-
Create a calculated field and a grouping dimension. For more information, see Create a calculated field and Create a grouping dimension.
-
Copy fields. For more information, see Copy to Dimension.
Configure the chart style
Location and size
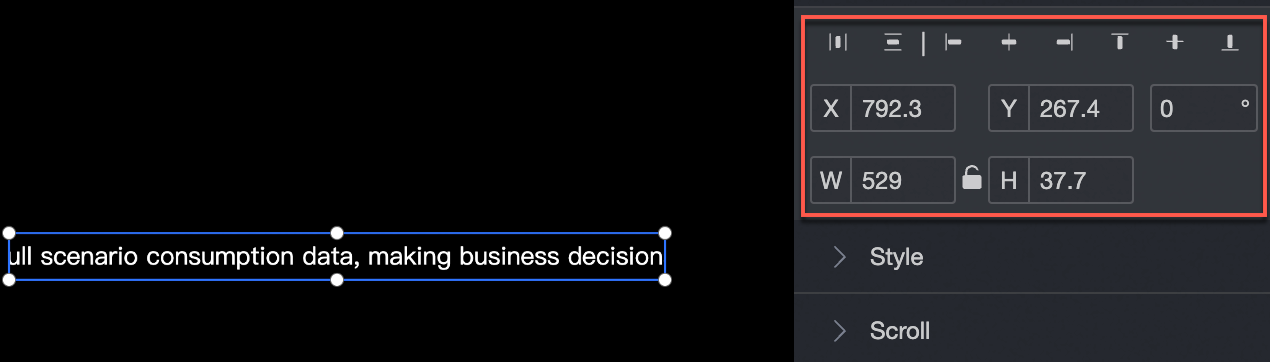
Configure the following layout properties:
-
Alignment: Set the component to left, center, or right alignment.
-
Position: Use the upper-left corner as the origin and set the X and Y values to adjust the position.
-
Rotation: Set the rotation angle.
-
Size: Set the W and H values to adjust the width and height.
-
Lock: Lock the component to prevent changes to its size and position.
Text Style
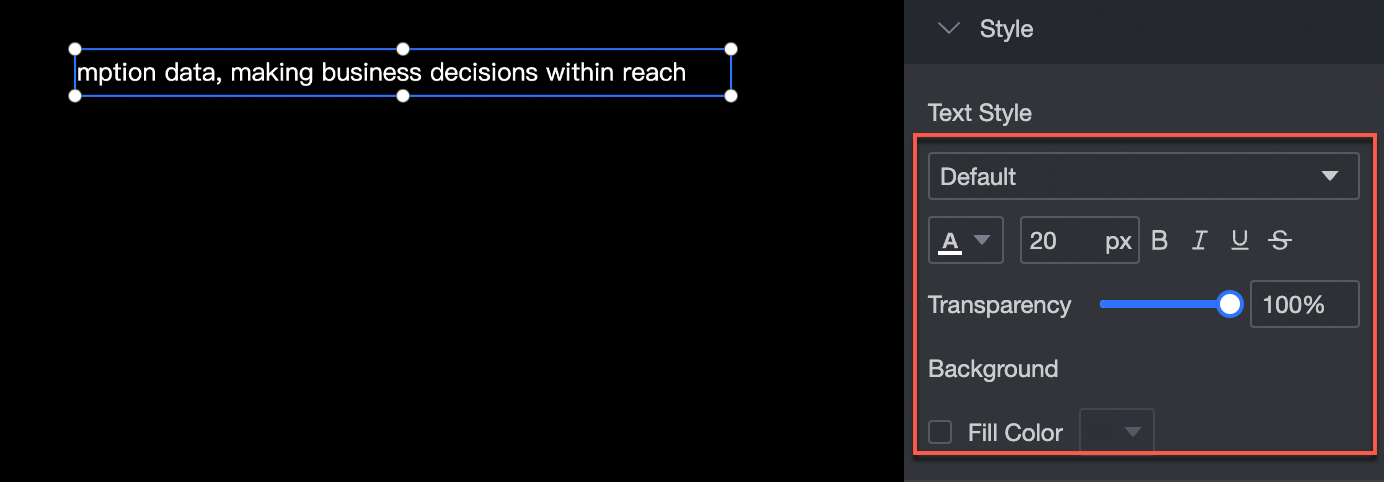
Configure the following text properties:
-
Font: Set the font style, color, size, bold, oblique, underline, and strikethrough for the marquee text.
-
Appearance: Adjust the transparency and background fill of the widget.
Animation effect
Enable or disable text scrolling and adjust the scrolling speed. 