View, move, share, make public, copy, transfer, favorite, or delete dashboards after you create them.
Prerequisites
You have a saved dashboard. Create a dashboard, Overview of visualized charts.
Go to the Dashboards page
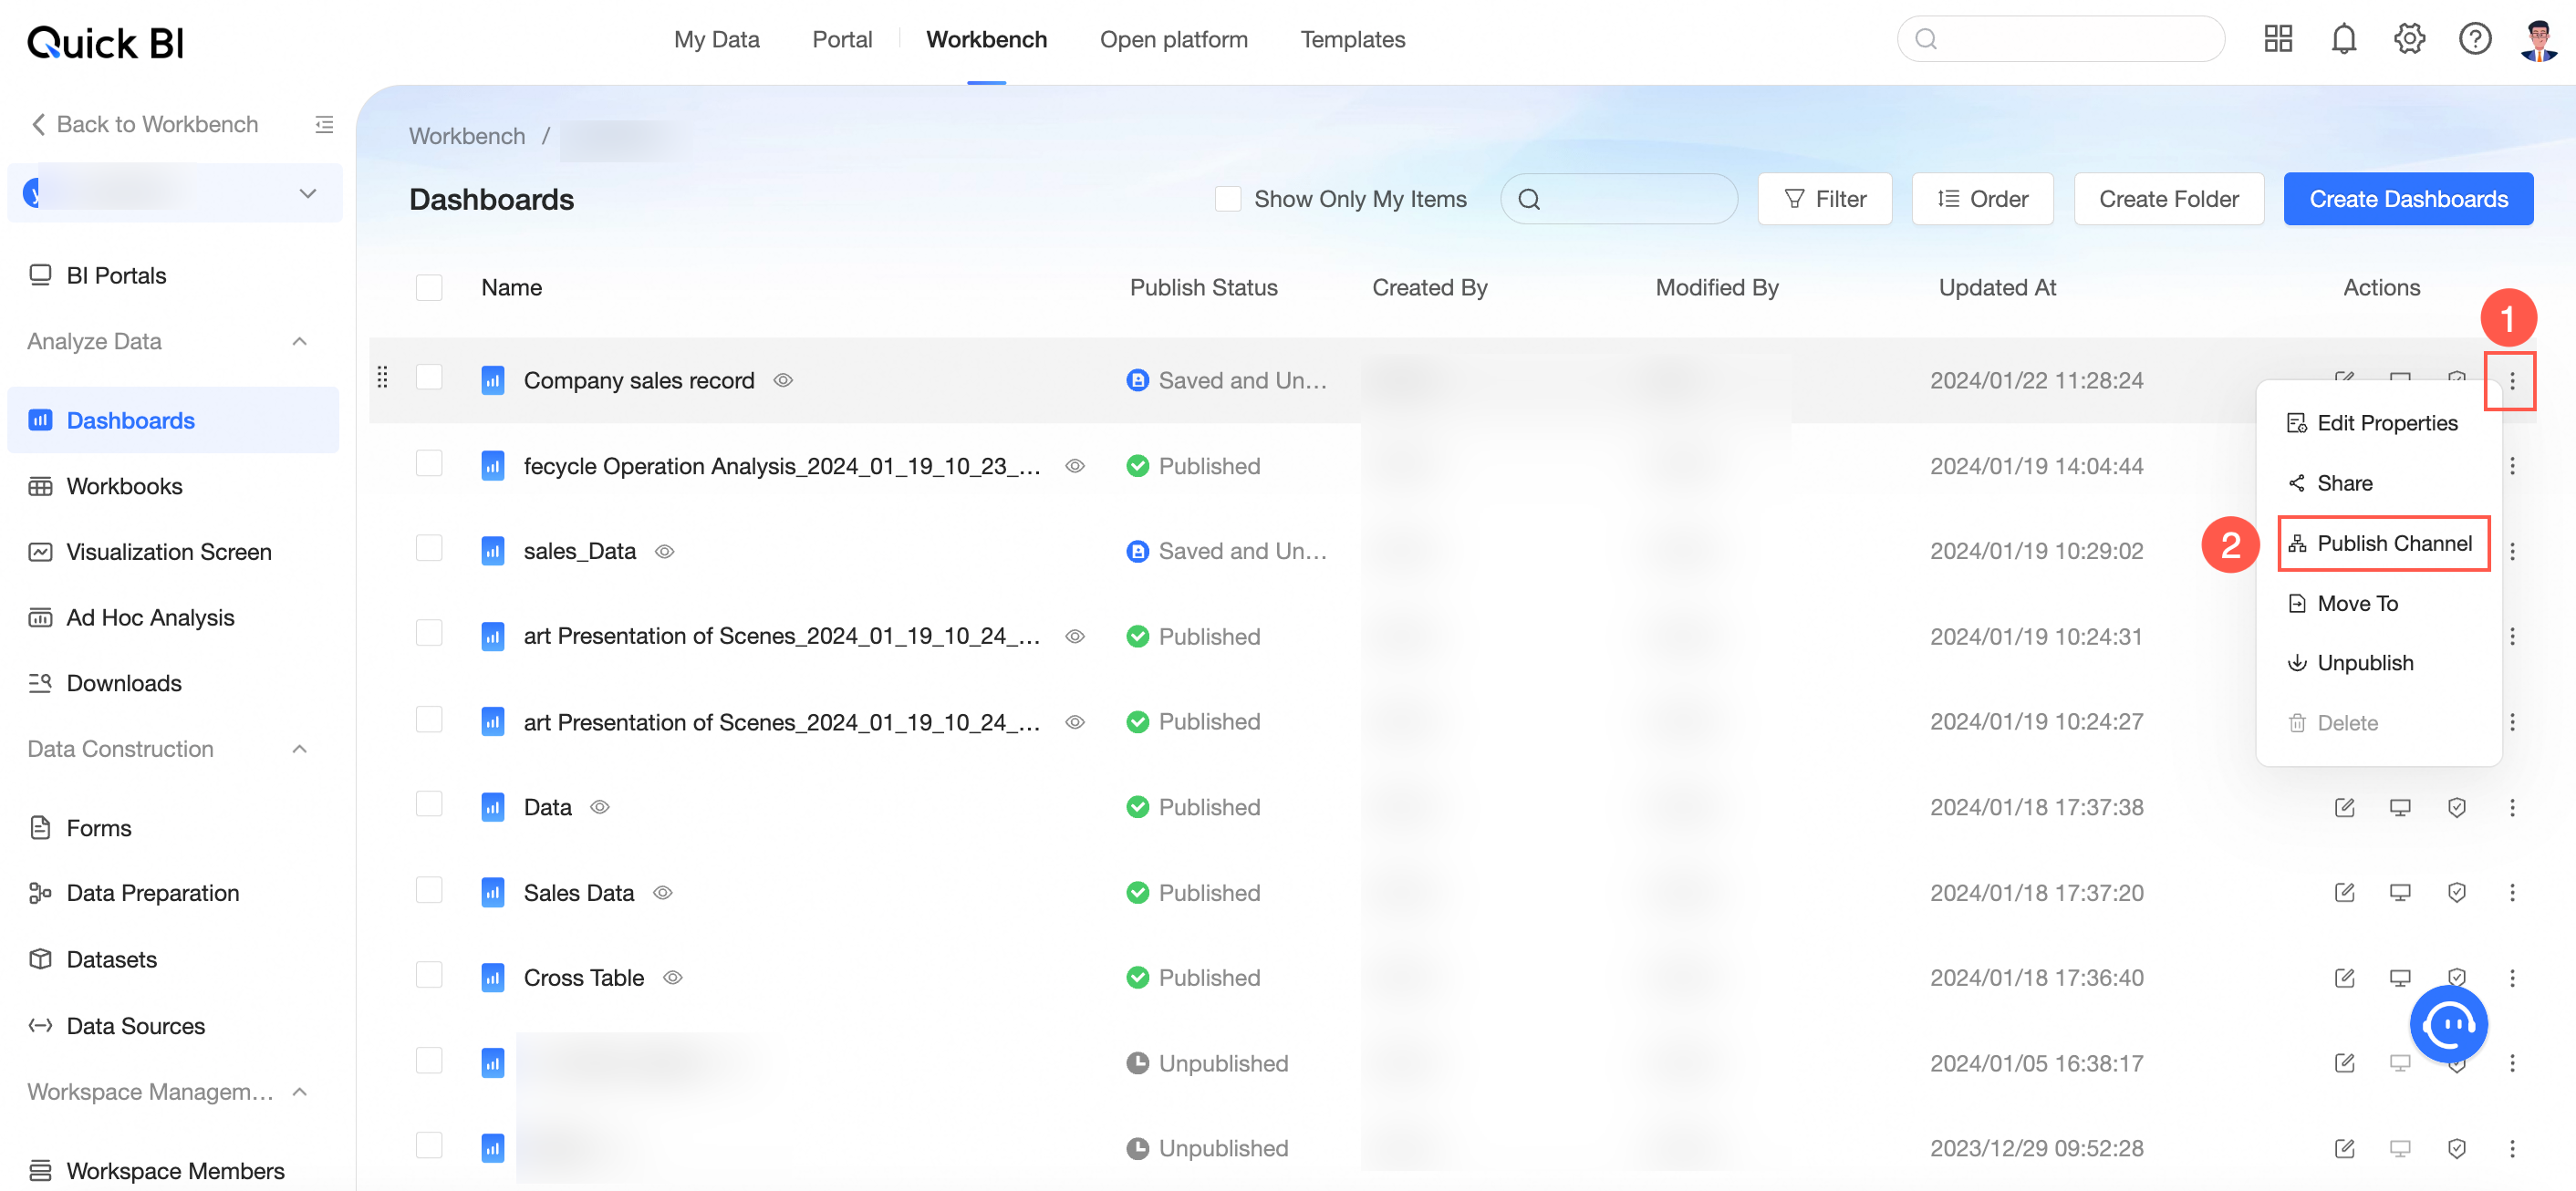
Log on to the Quick BI console. Go to the Dashboards page as shown.
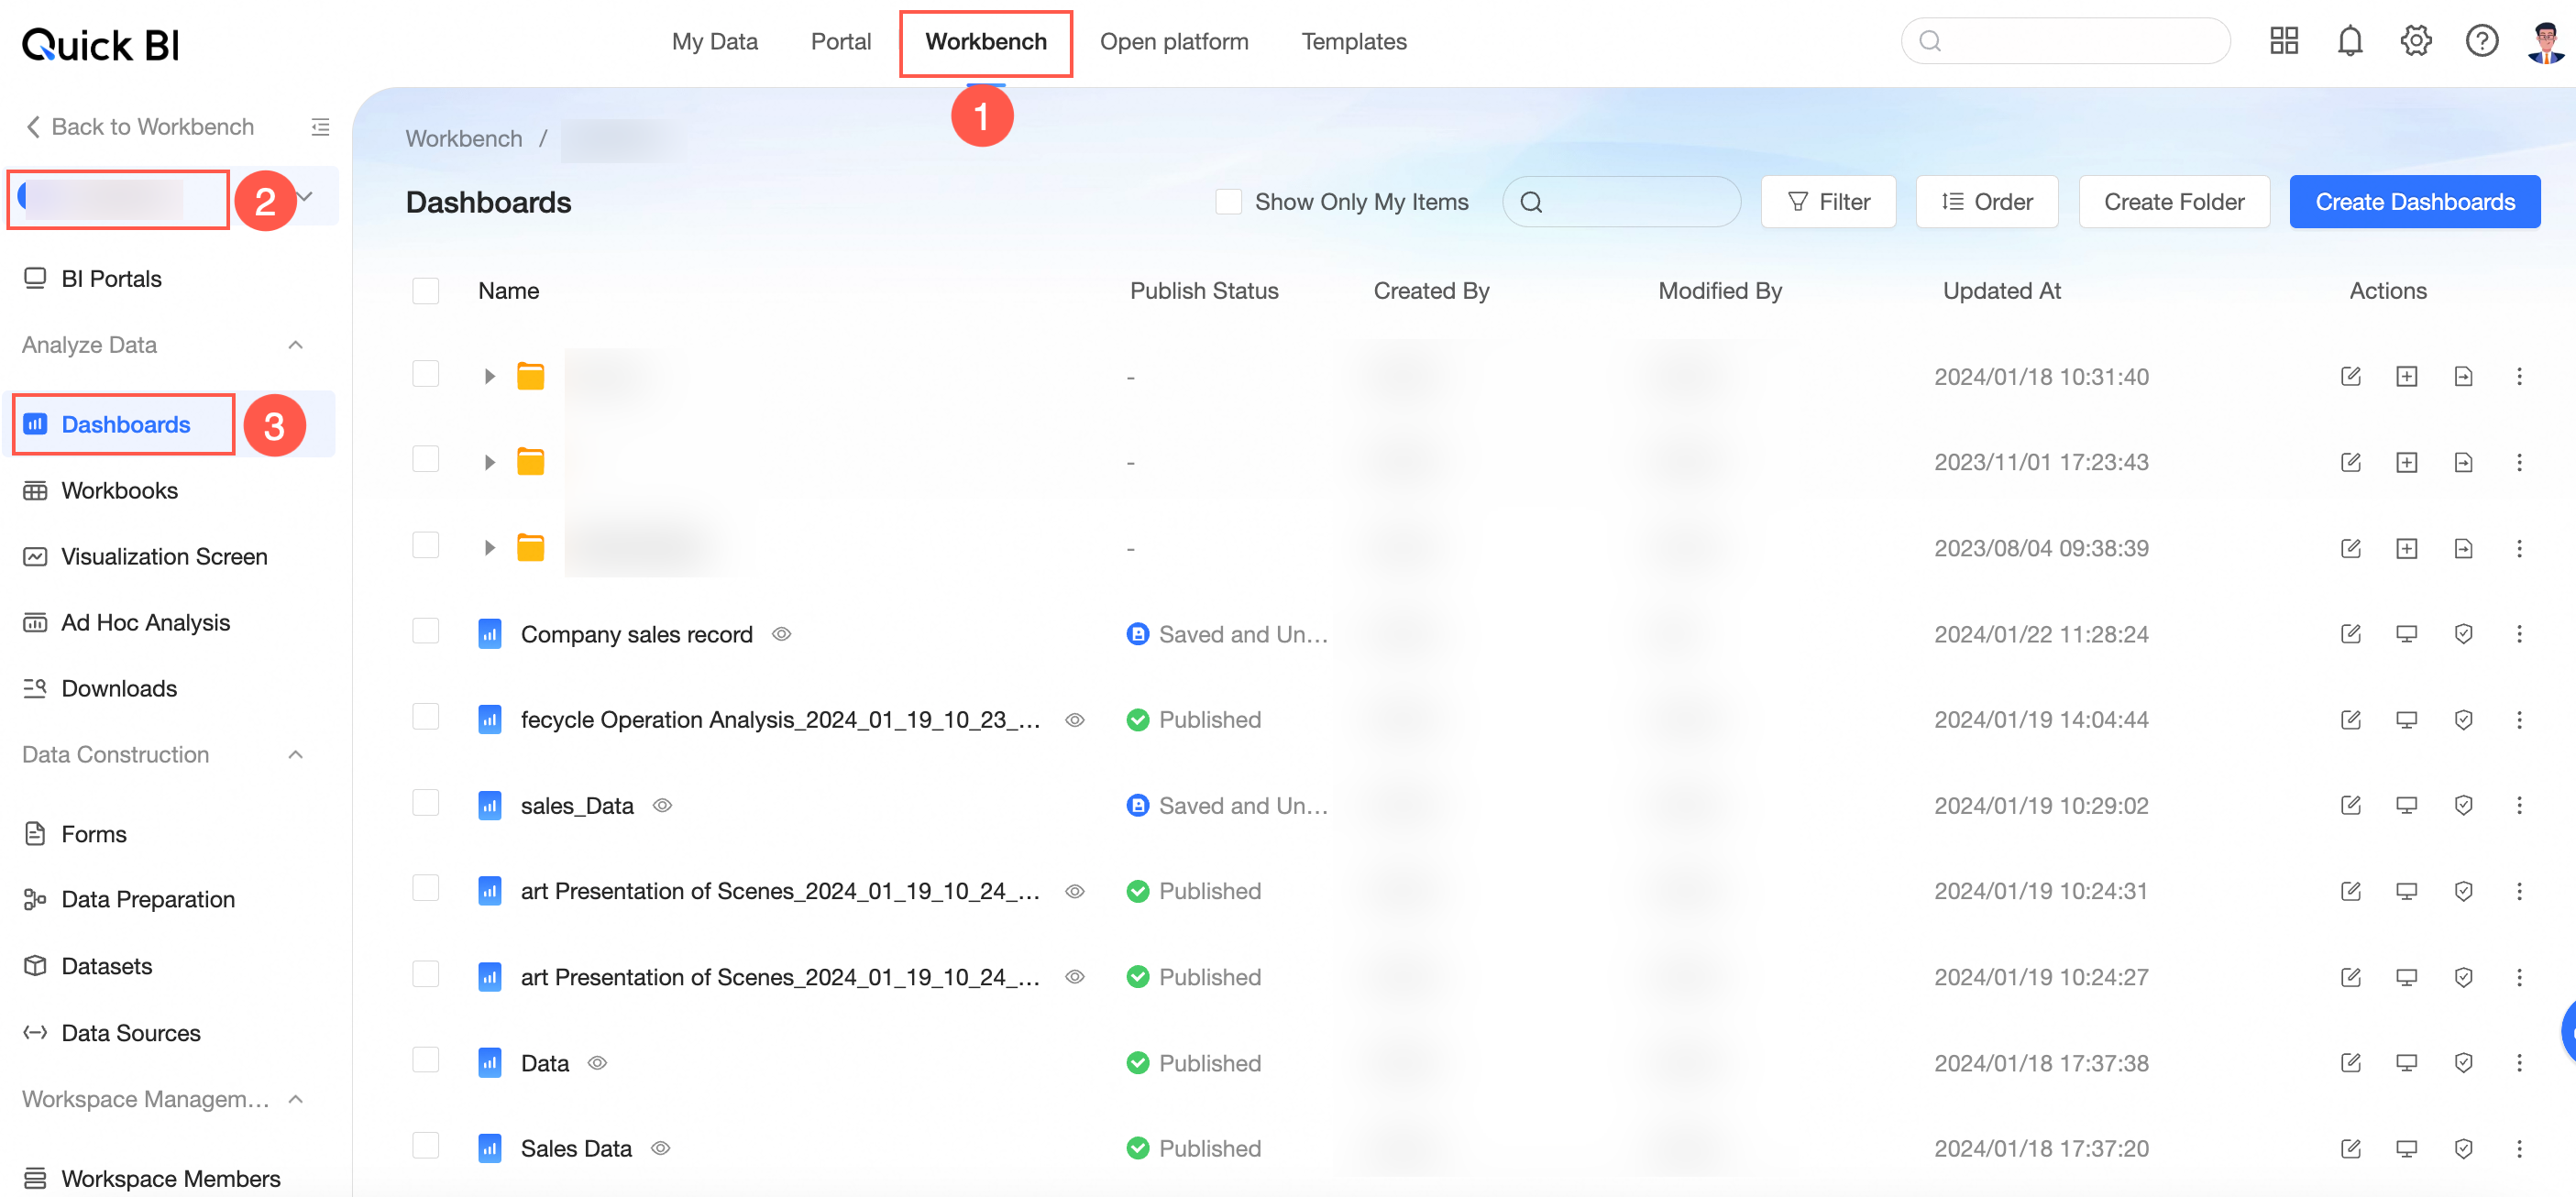
On the Dashboards page, you can:
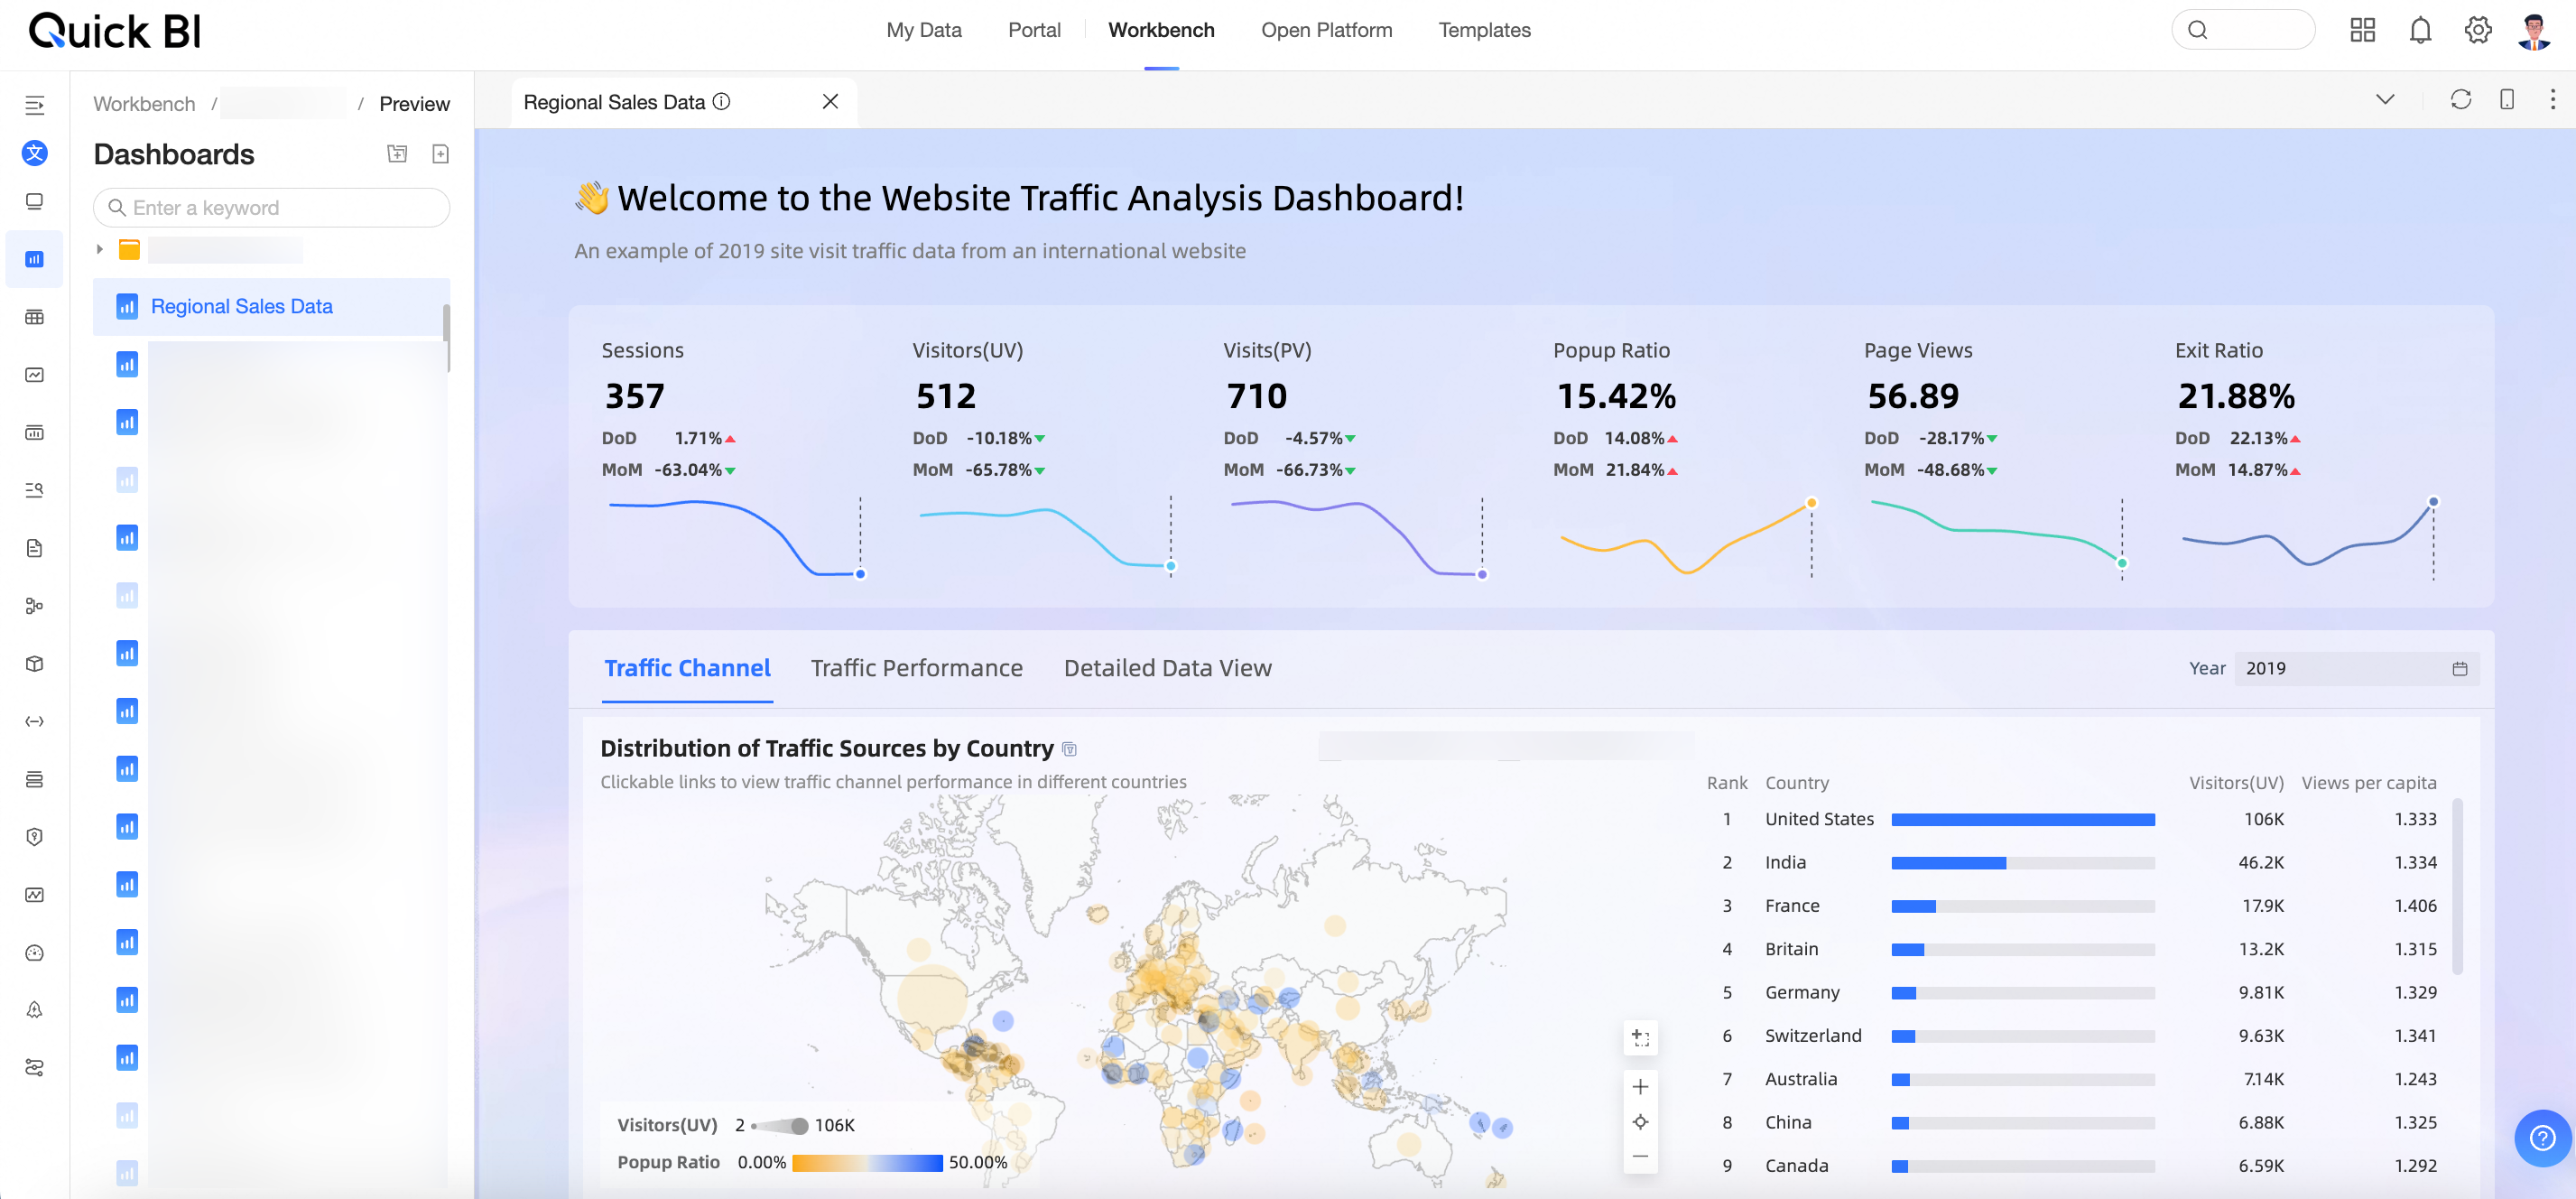
View a dashboard
-
On the Dashboards page, find the target dashboard and click the
 icon.
icon.The preview page opens.
-
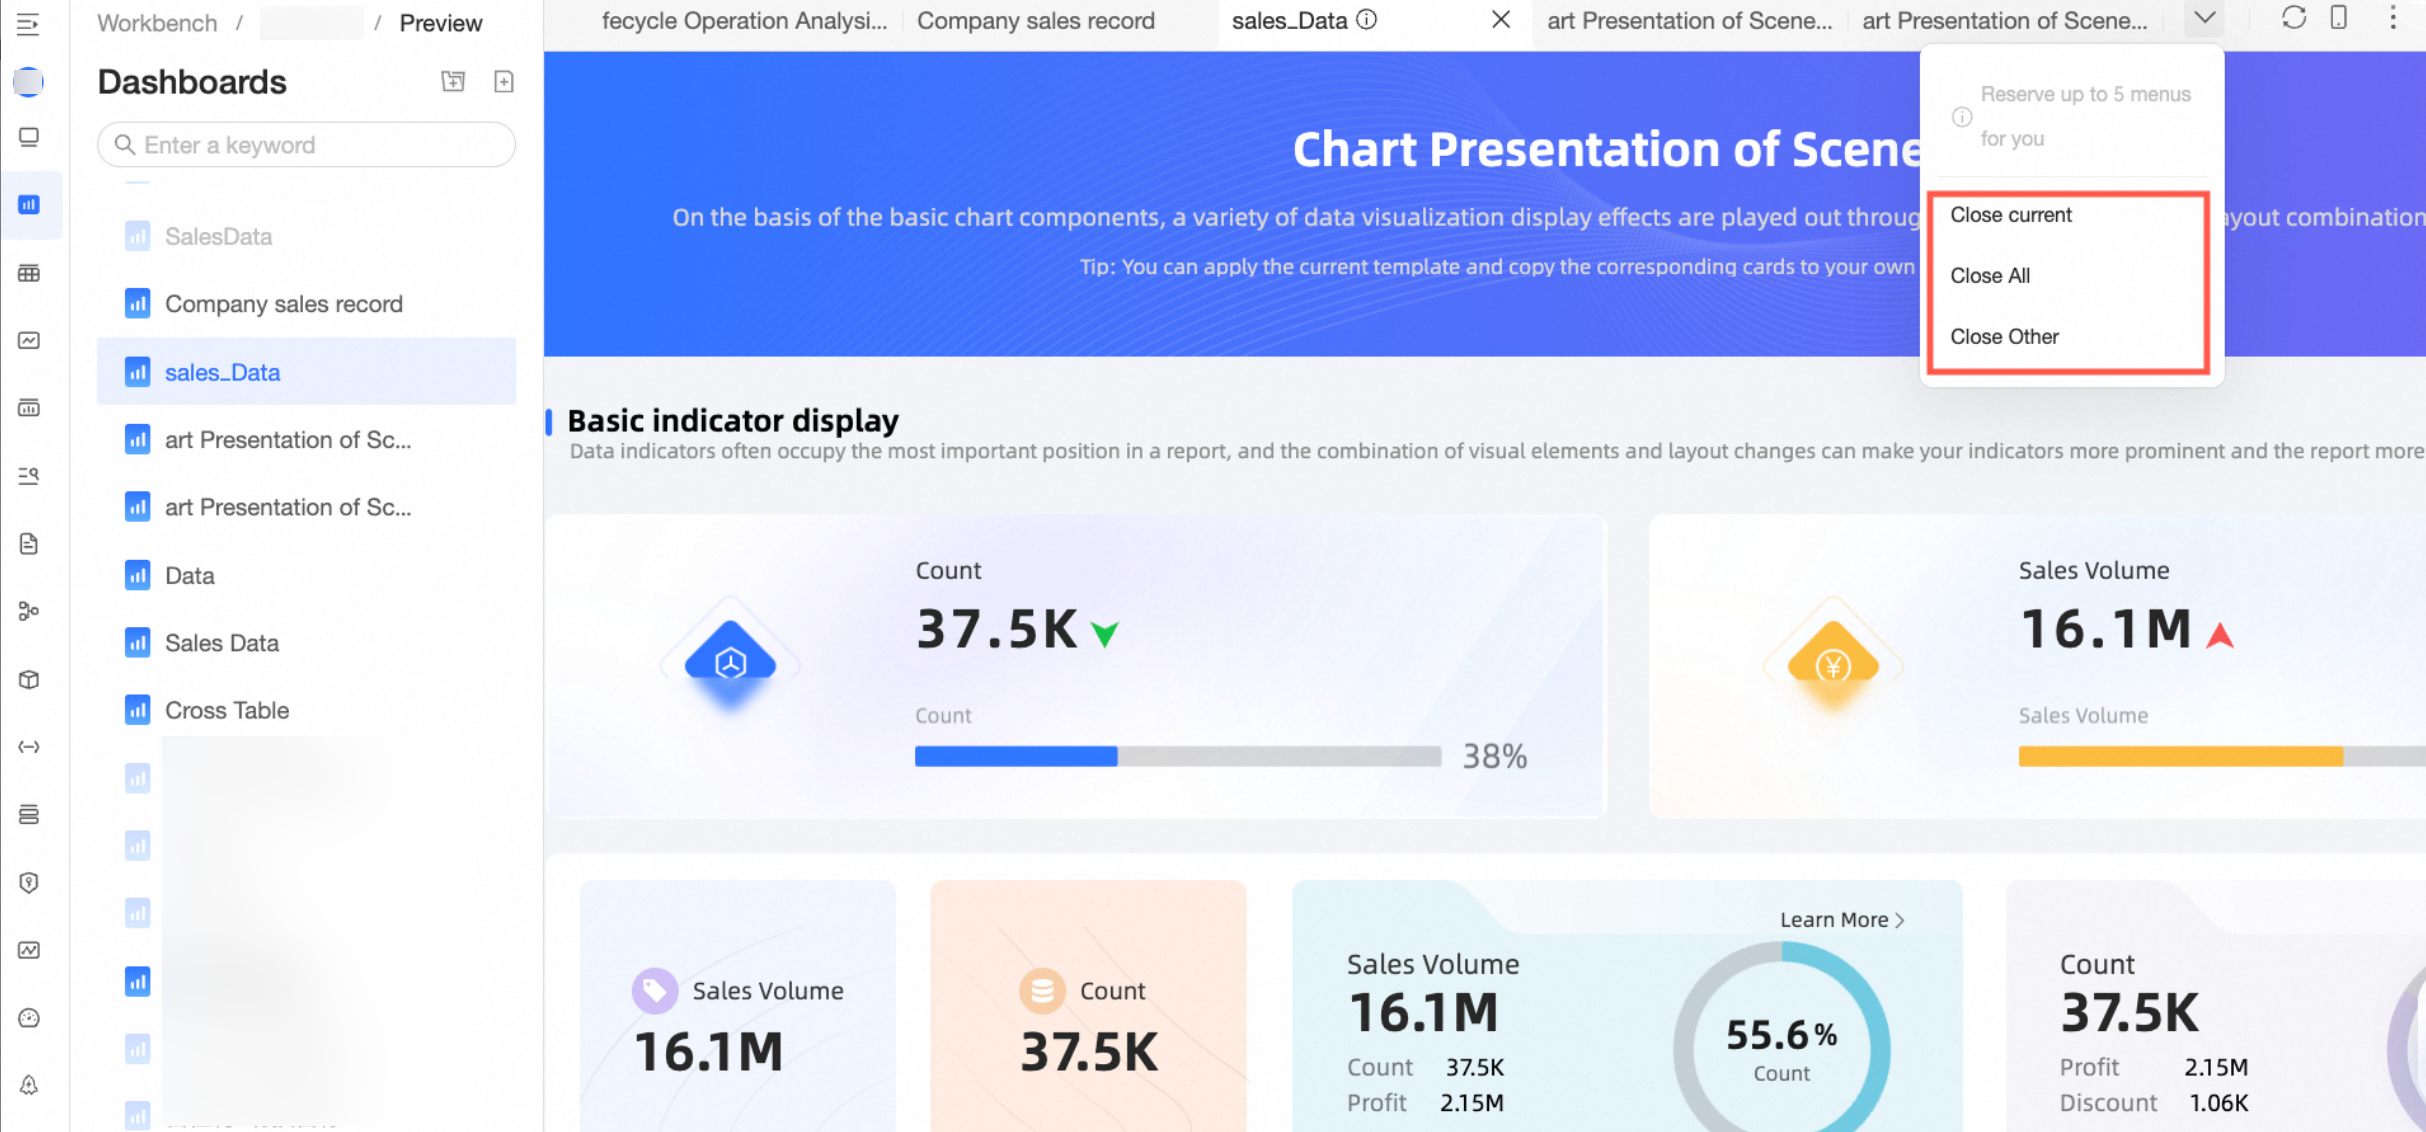
Open and switch between multiple preview tabs.
NoteYou can have a maximum of five tabs open.
Click the
 icon in the upper-right corner to select Close Current, Close All, or Close Others.
-
Close Current: Closes the current preview tab.
-
Close All: Closes all open preview tabs.
-
Close Others: Closes all preview tabs except for the current one.
-
Find a dashboard
-
Find the target dashboard.
-
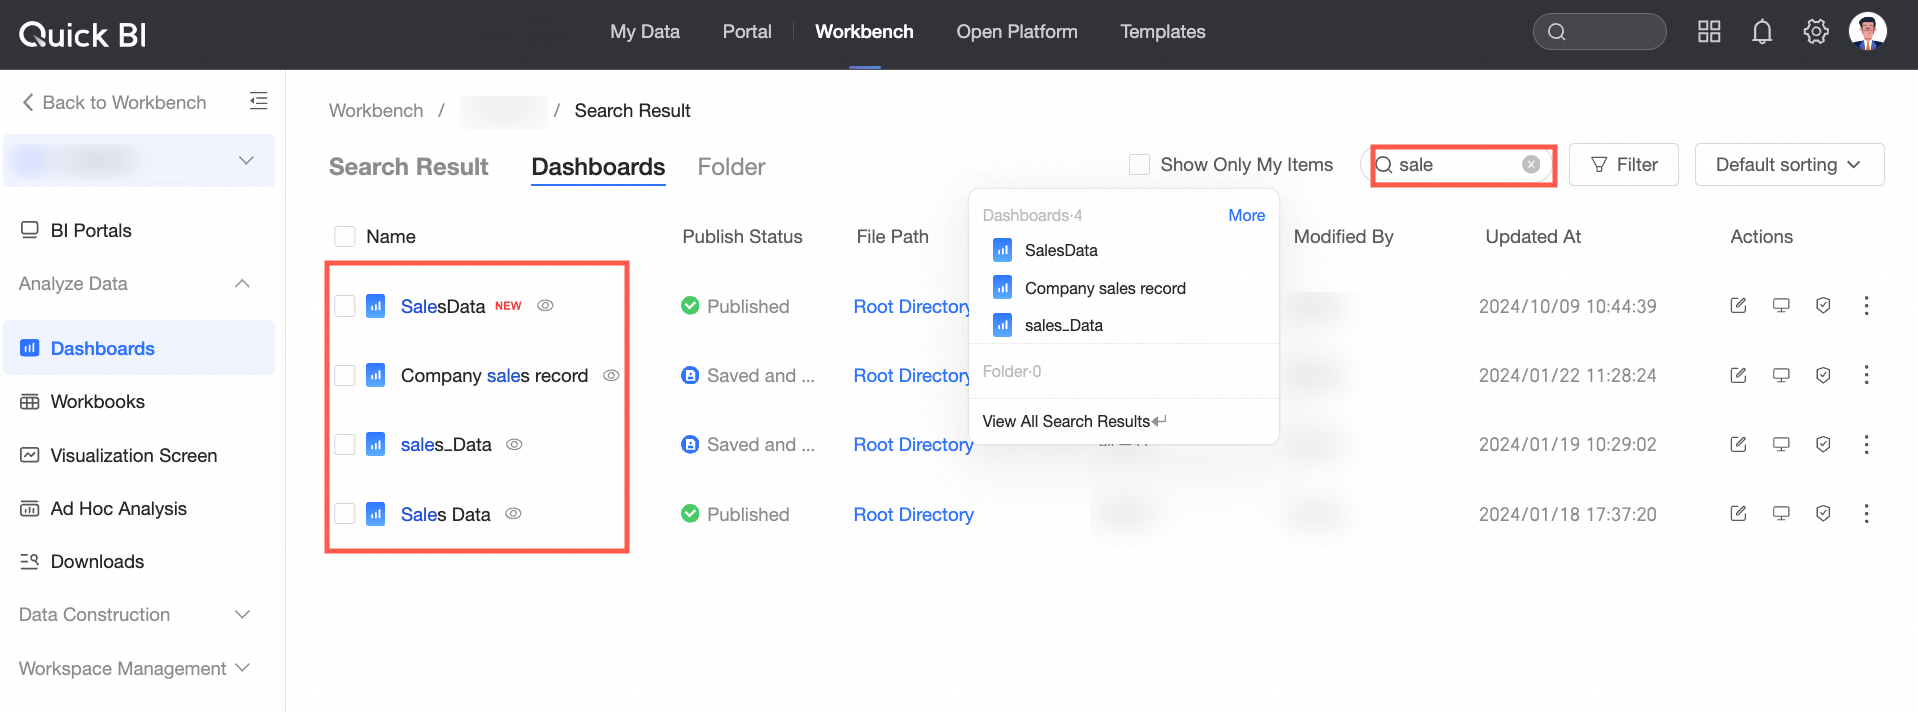
Search
Enter a keyword in the search box to find the dashboard.
-
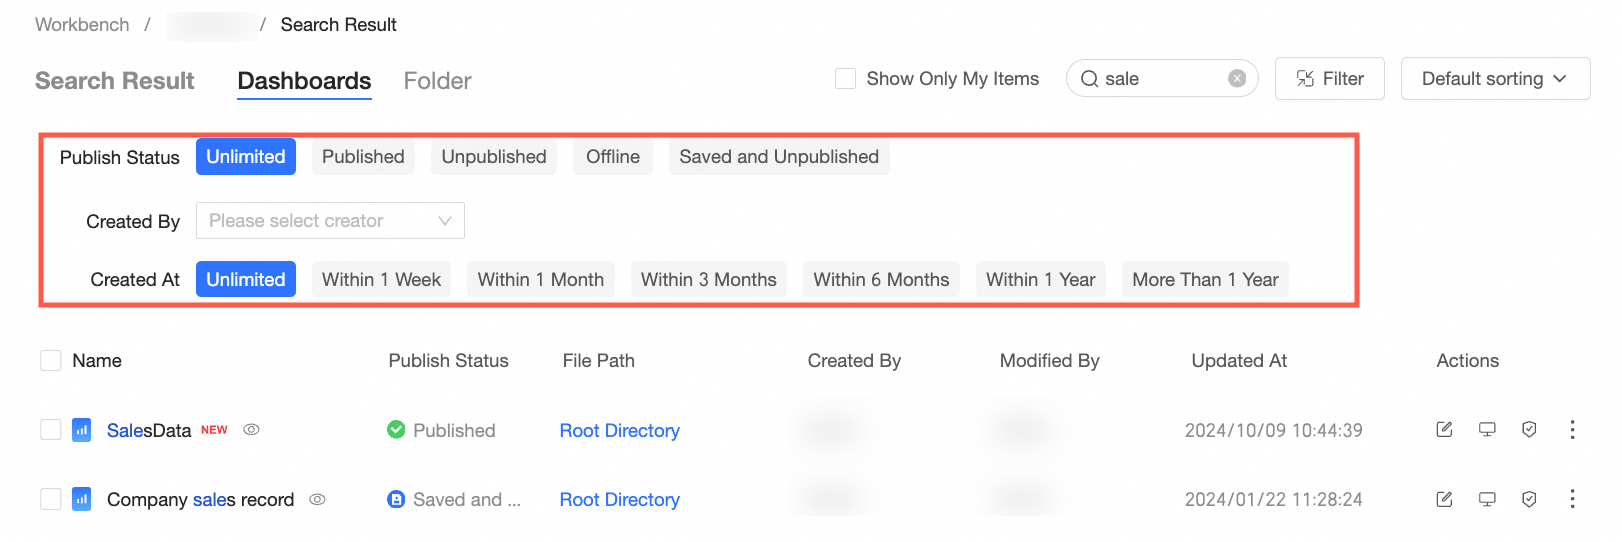
Filter
Click Filter to filter by publish status, creator, and creation time.
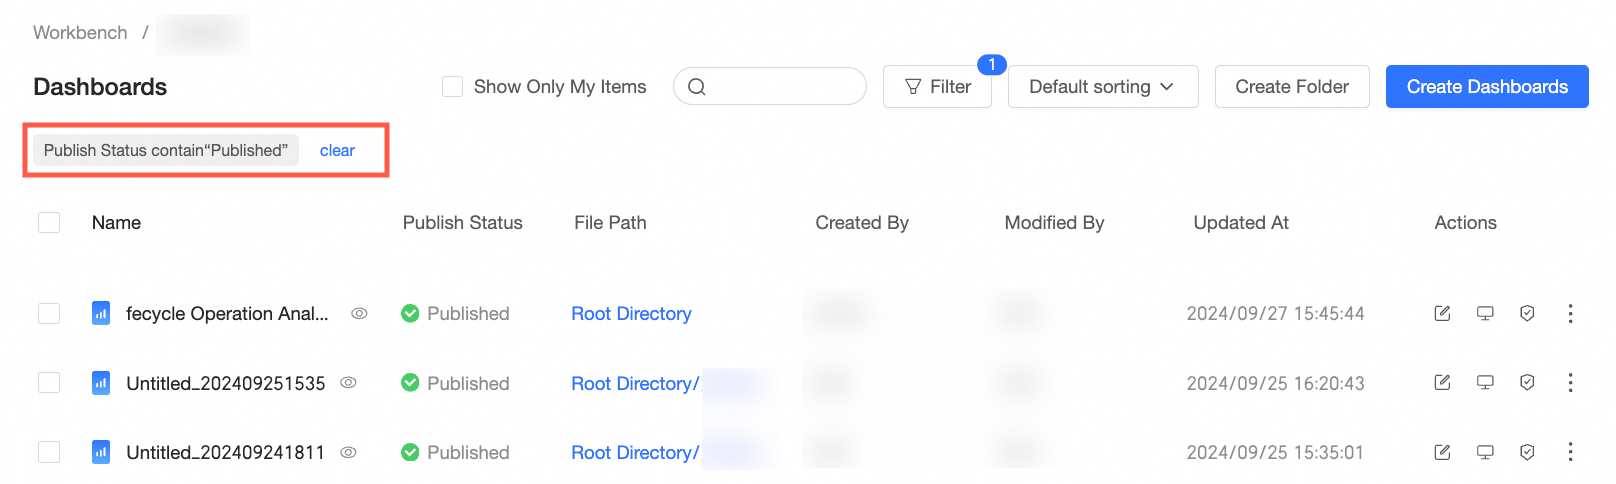
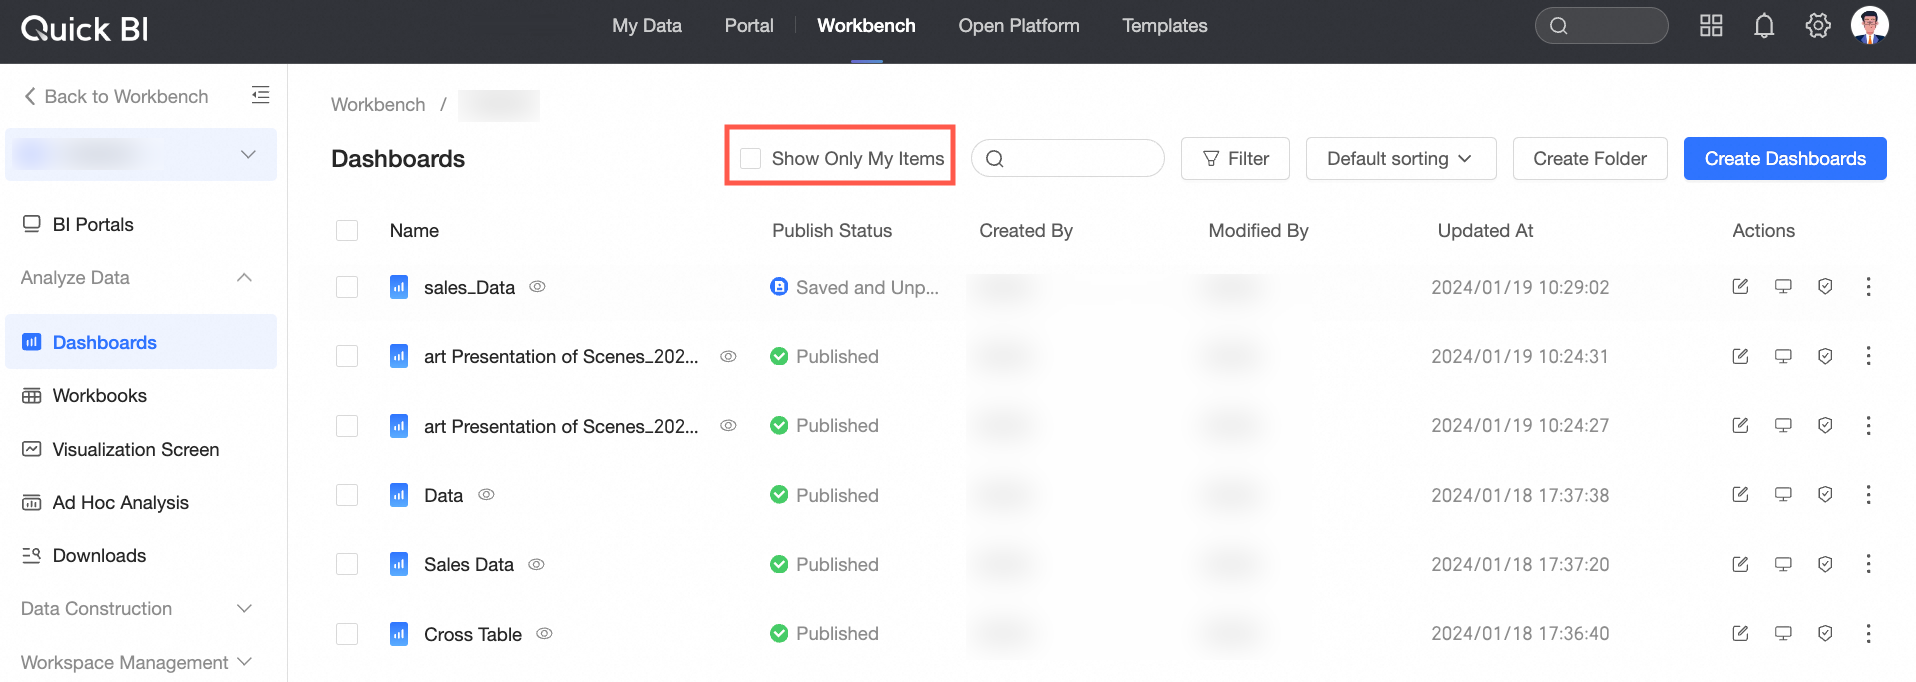
Click the
icon to hide the filter area. Active filters remain visible and can be deleted or cleared.Select Show only mine to display only your dashboards.
-
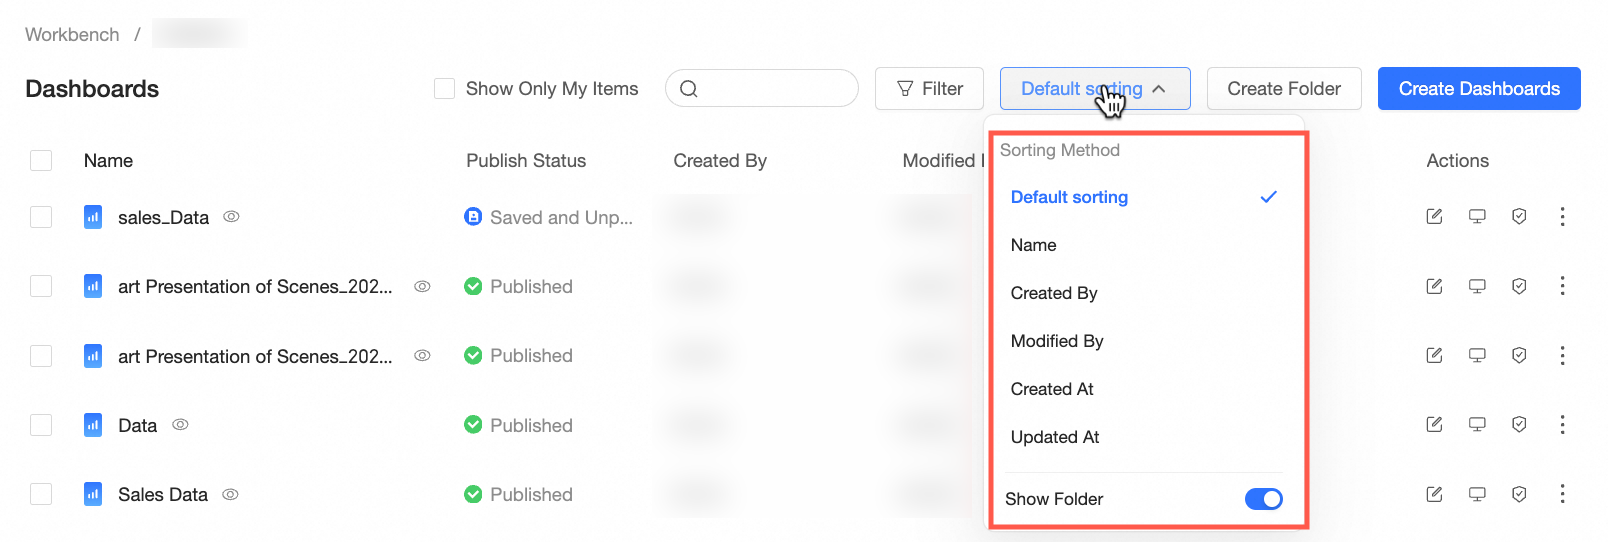
Sort
Sort dashboards by Name, Creator, Modifier, Creation Time, or Modification Time. Keep directory structure is selected by default and excludes directories from sorting.
-
Comment on a dashboard
-
The comment feature requires an organization administrator to select Comment under View State Functions in Report Configuration, and enable Enable report comments on the Advanced tab of Page Settings in the dashboard editor.
-
Both dashboard-level and component-level comments are supported.
-
Open the dashboard preview page. View a dashboard.
-
Open the comment panel.
-
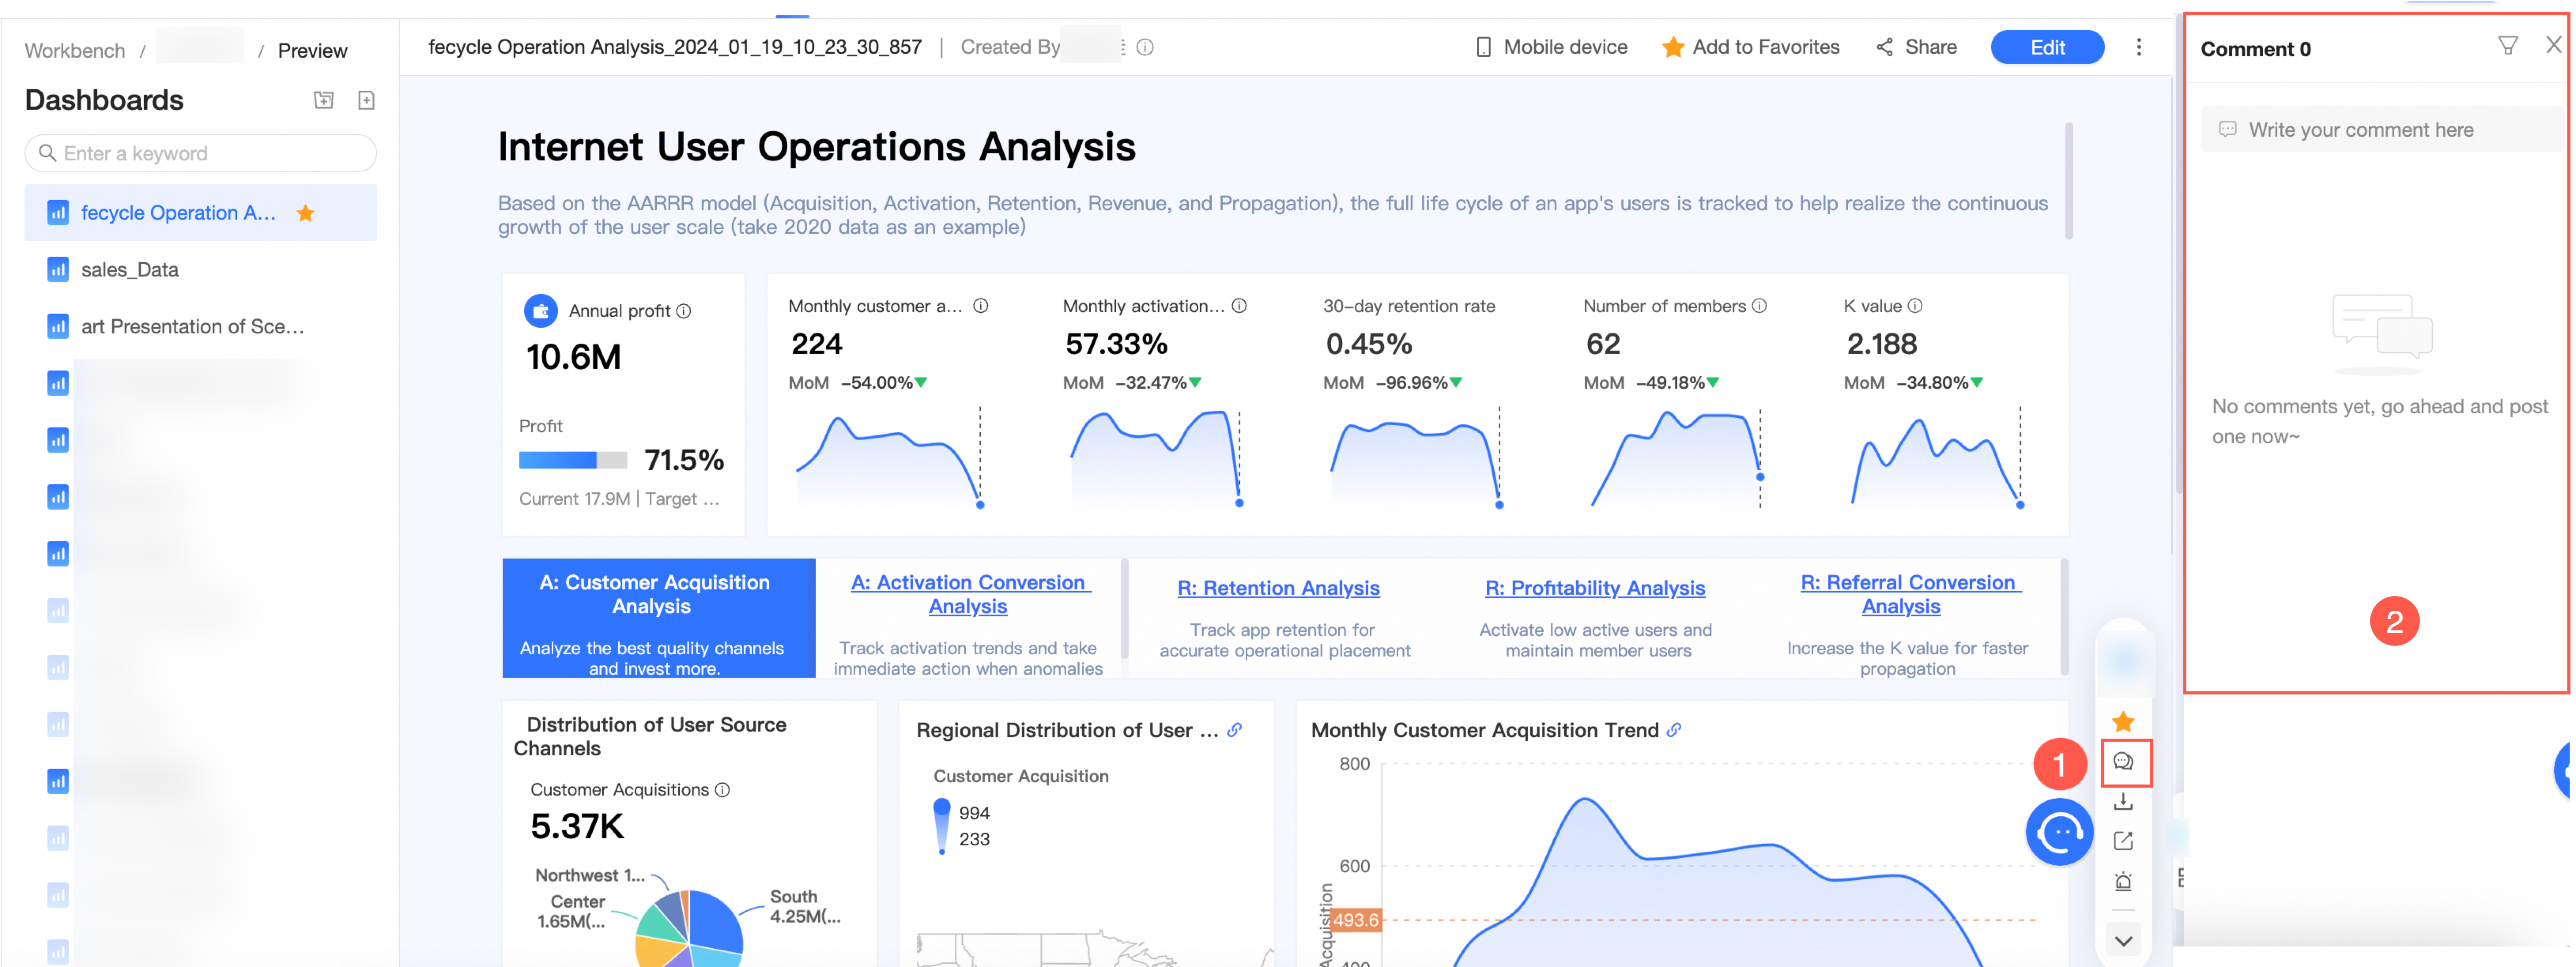
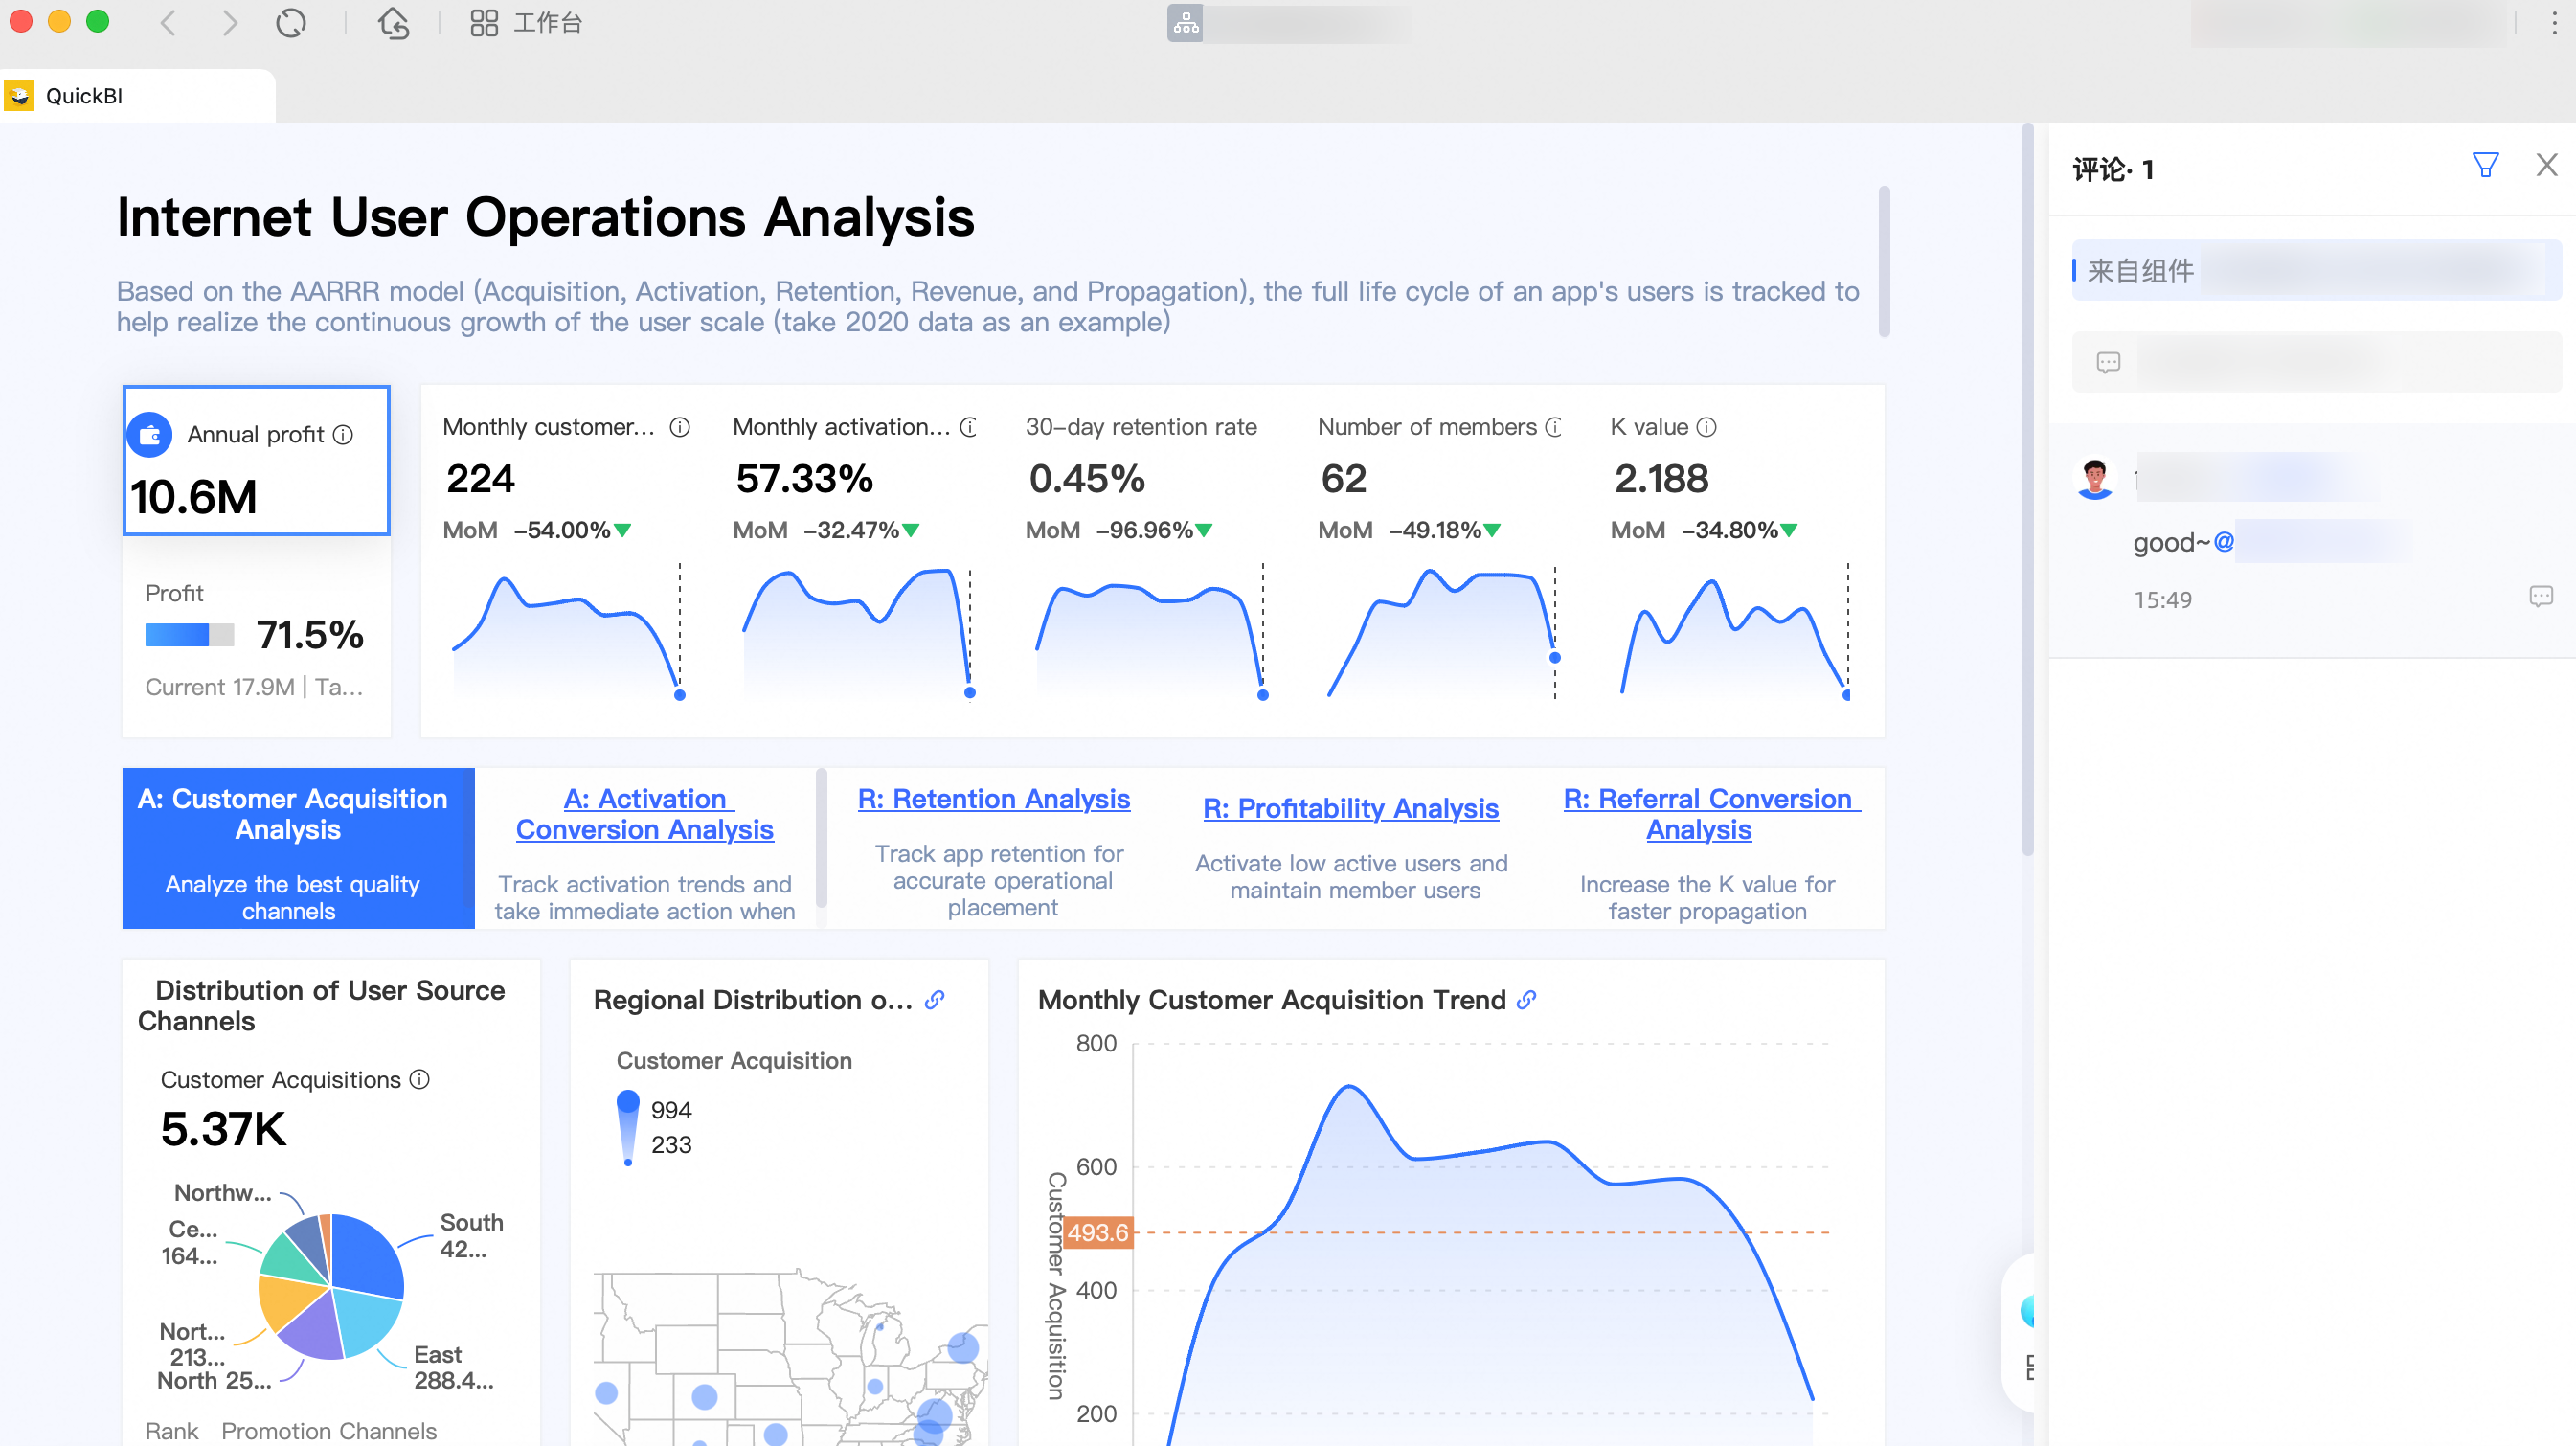
Dashboard-level comment entry point
On the preview page, click the
icon (①) in the lower-right floating menu to open the Comments panel (②). -
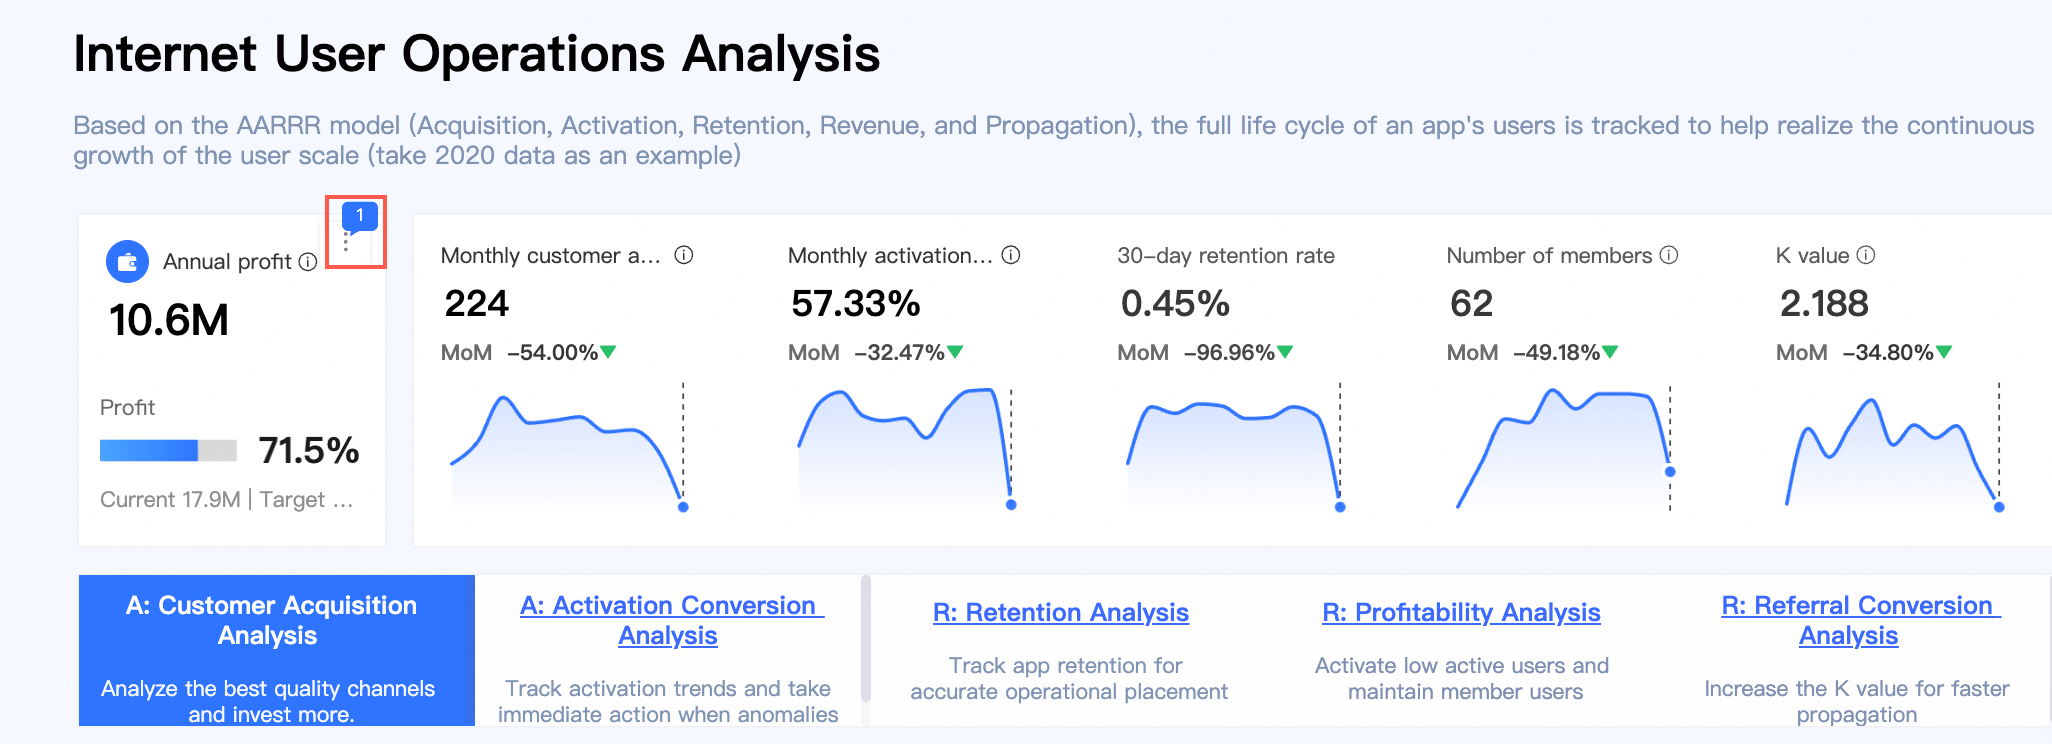
Component-level comment entry point
On the preview page, open the comment panel for a component as shown.
If a component has comments, click its comment icon to open the panel. Click another component's comment icon to switch.
-
-
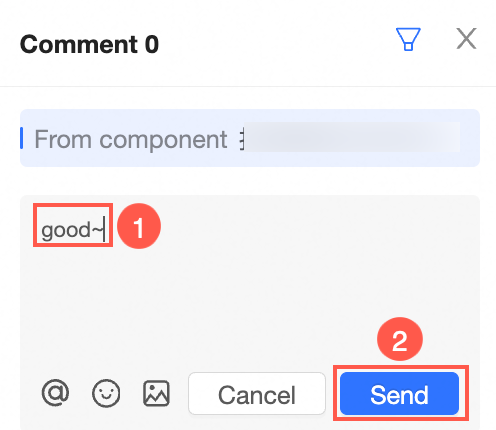
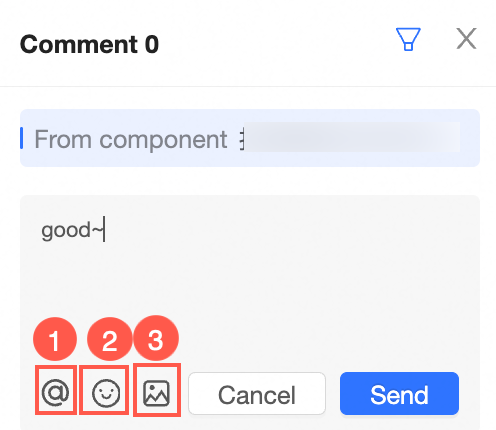
Enter a comment in the comment box (①) and click Send (②).
Comments support @mentions (①), emojis (②), and images (③).
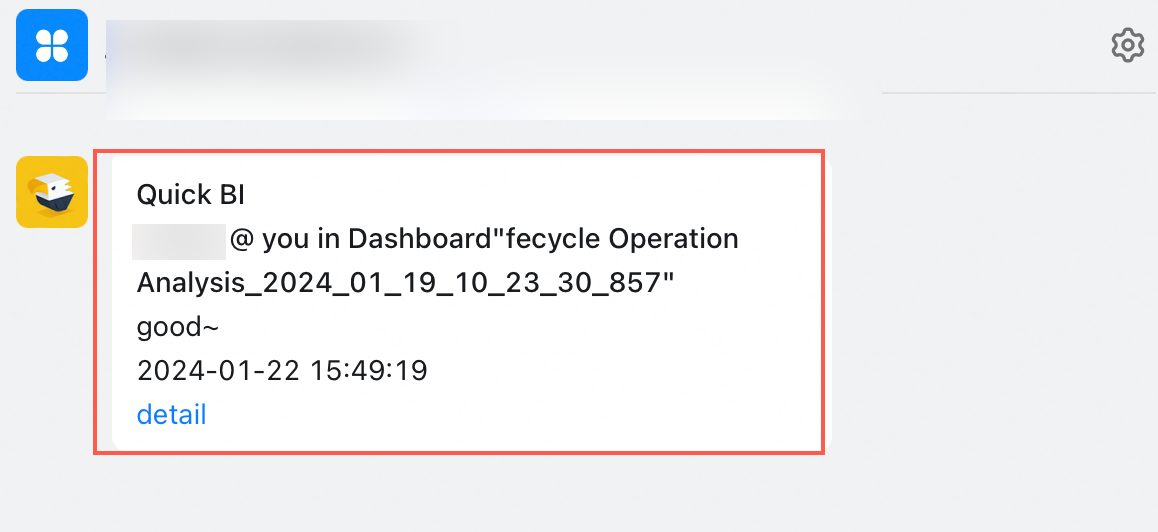
@mentioned users receive a push notification:
Clicking the notification opens the dashboard preview page with the relevant comment.
-
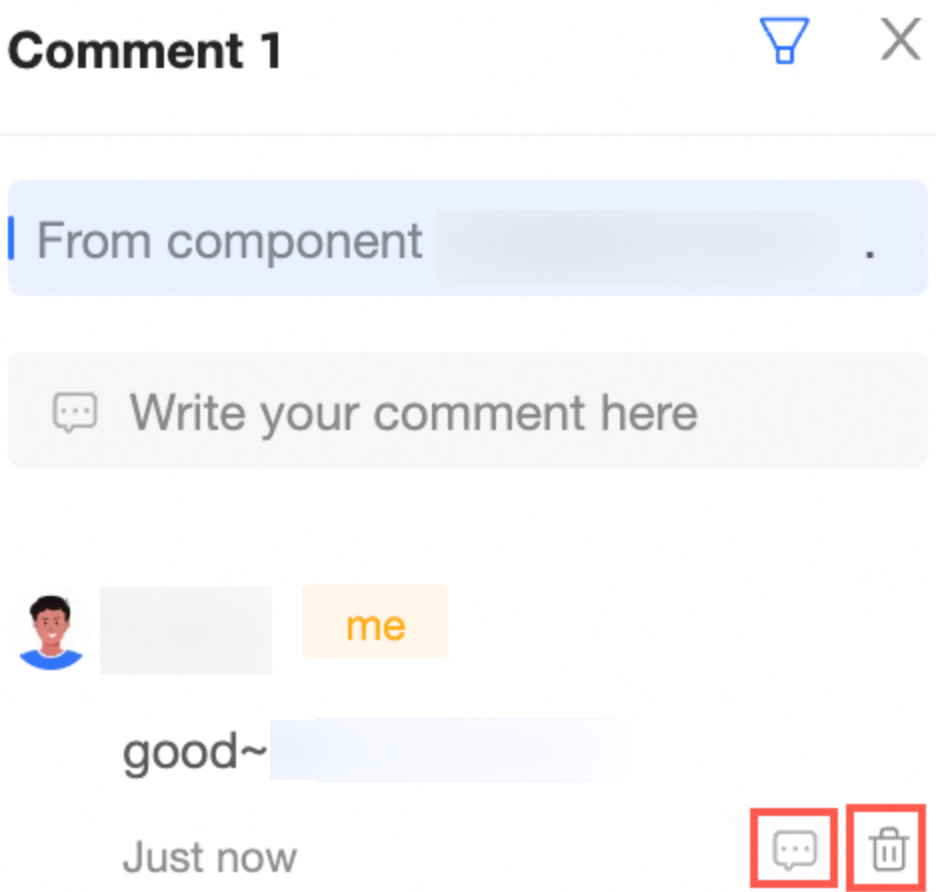
After posting a comment, you can reply to or delete your own comment.
-
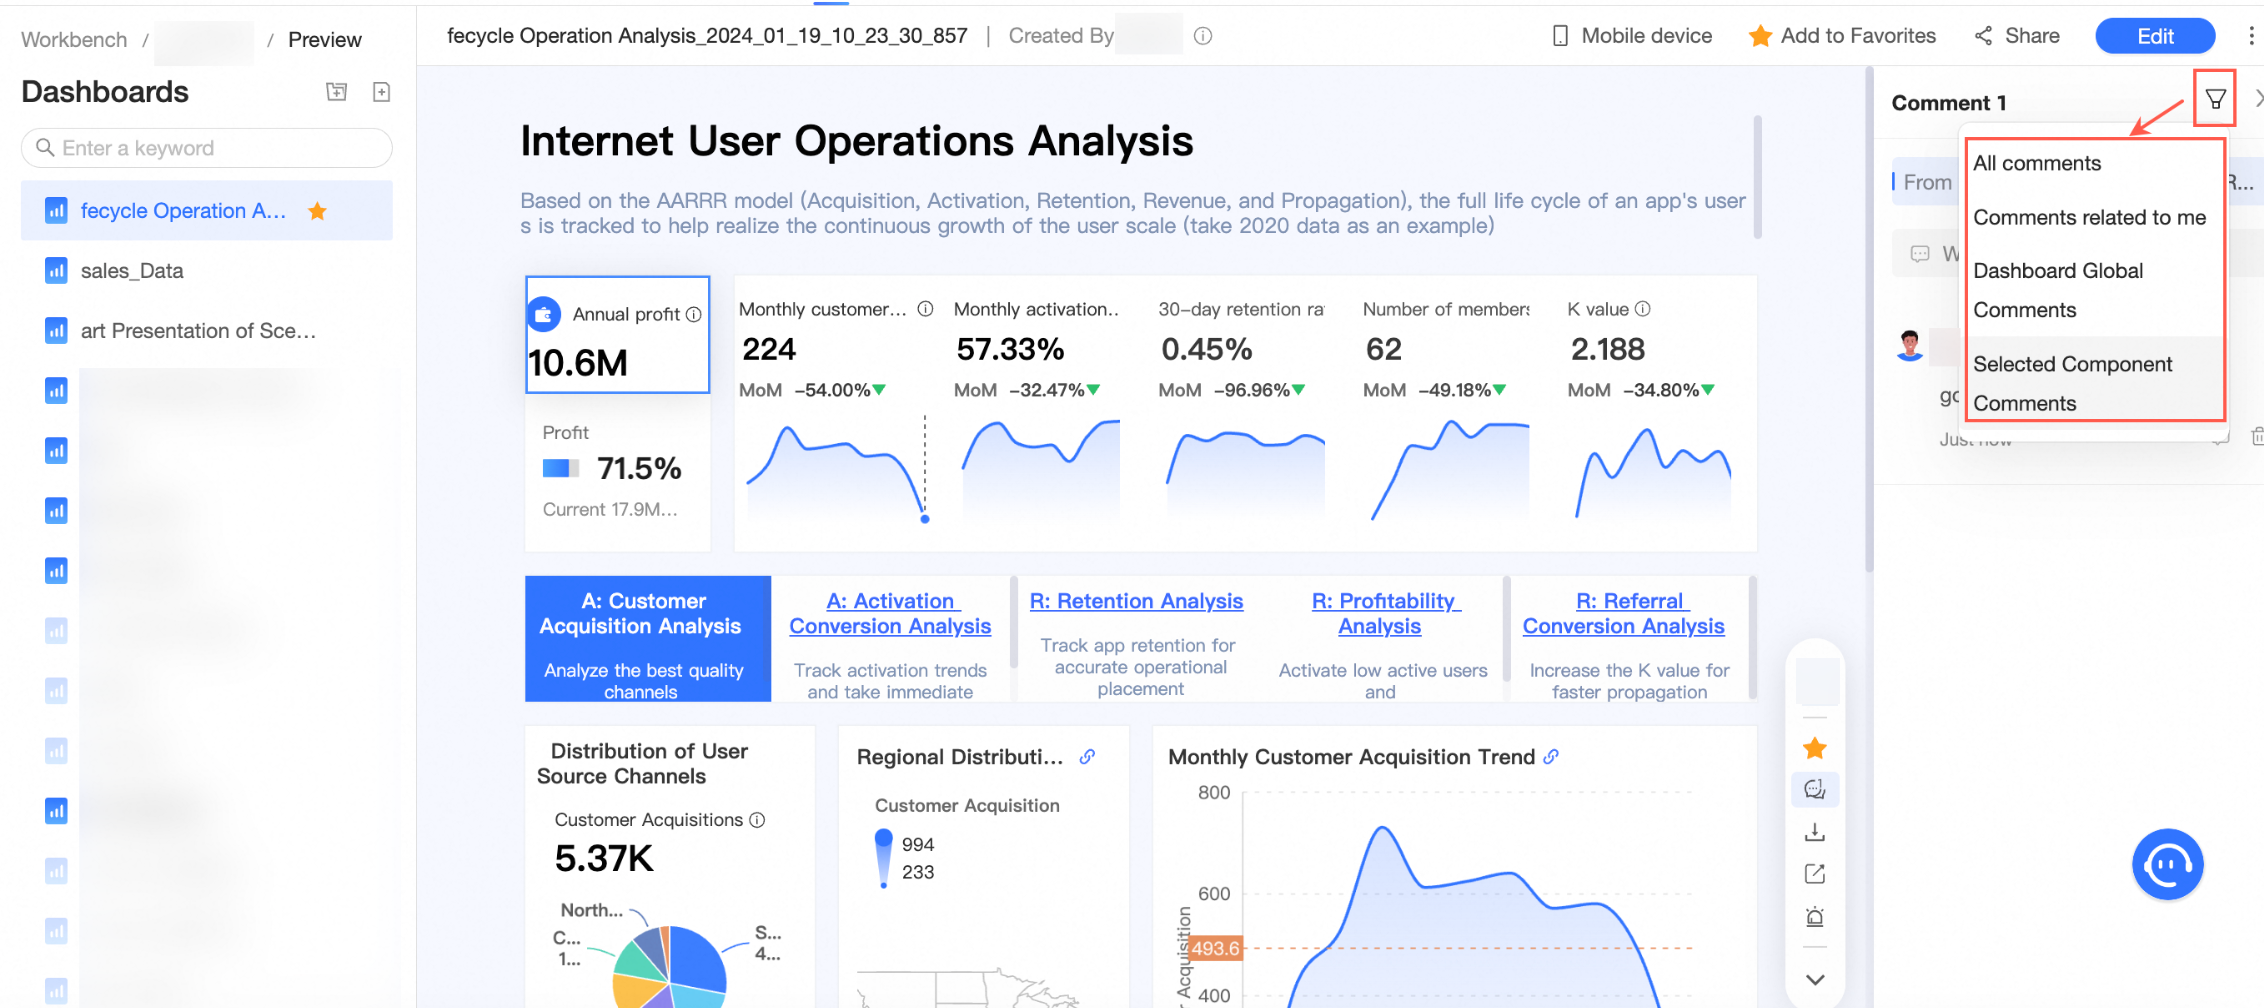
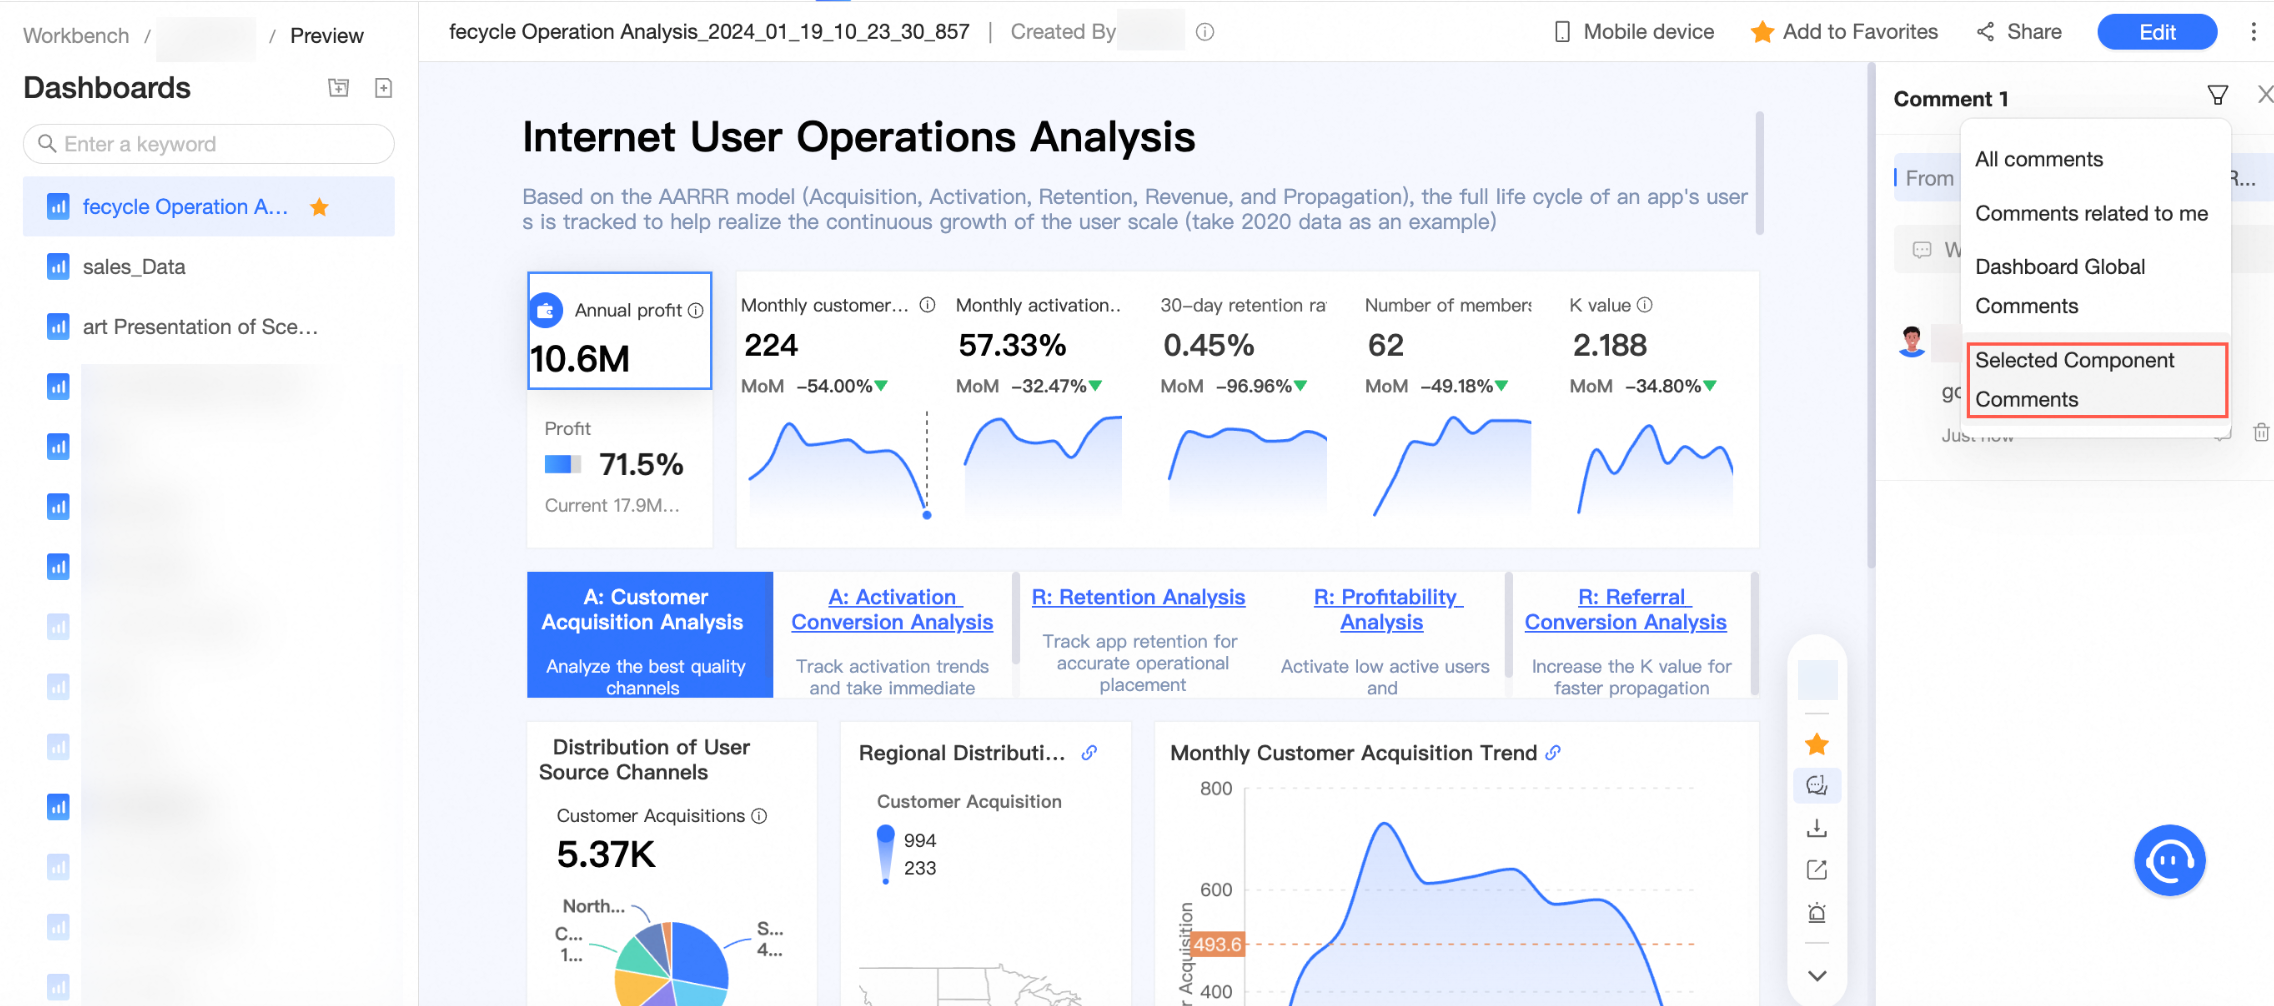
Click the
icon in the upper-right corner to filter comments. You can filter for All Comments, Comments related to me, or Dashboard global comments.When you enter the comments page from an existing comment on a component, the
icon for Selected Component Comments is selected by default. You can switch to the other three types of comments.

Move a dashboard
-
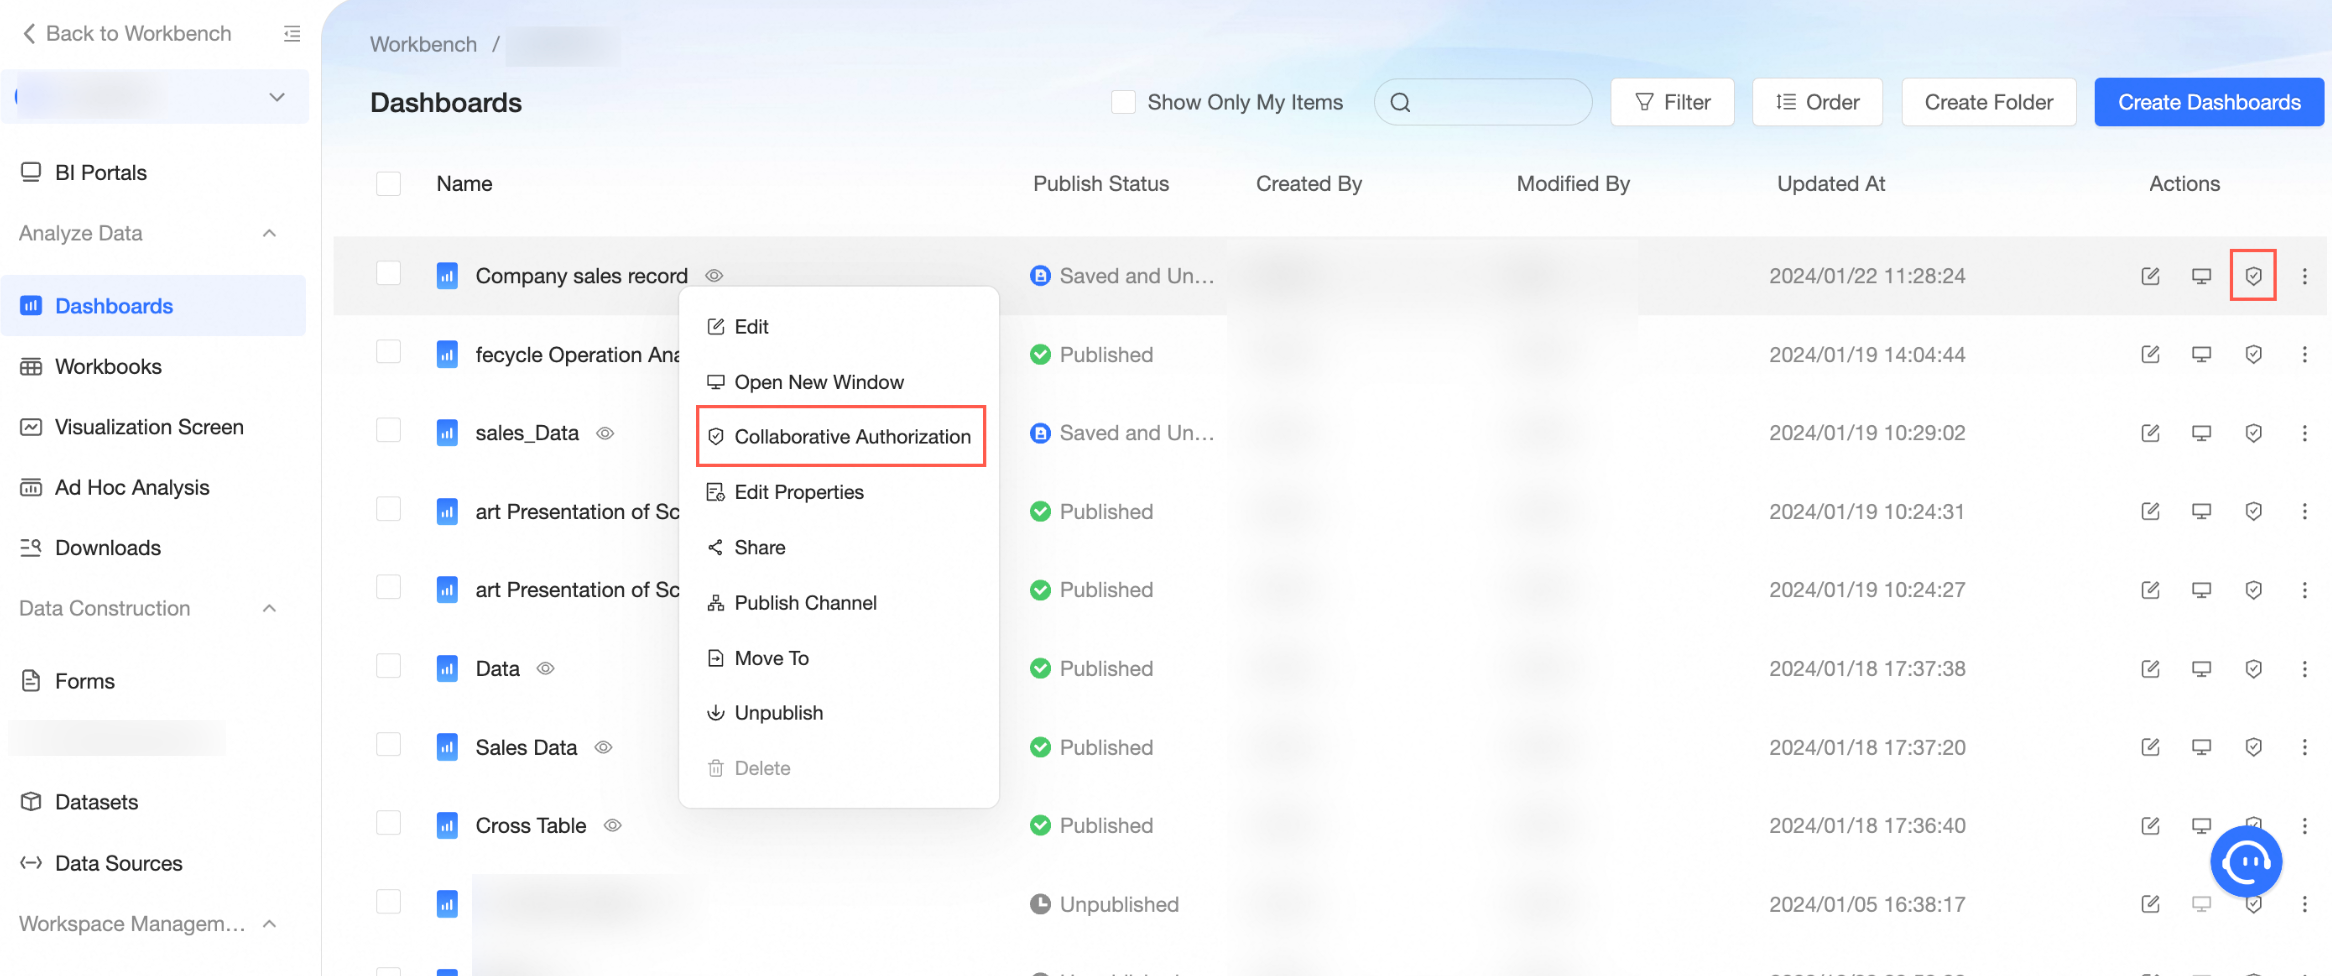
Find the dashboard that you want to move, click the
icon in its row, and select Move To. -
In the Move To dialog box, select the destination directory and click Confirm.
 icon in its row, and select Move To.
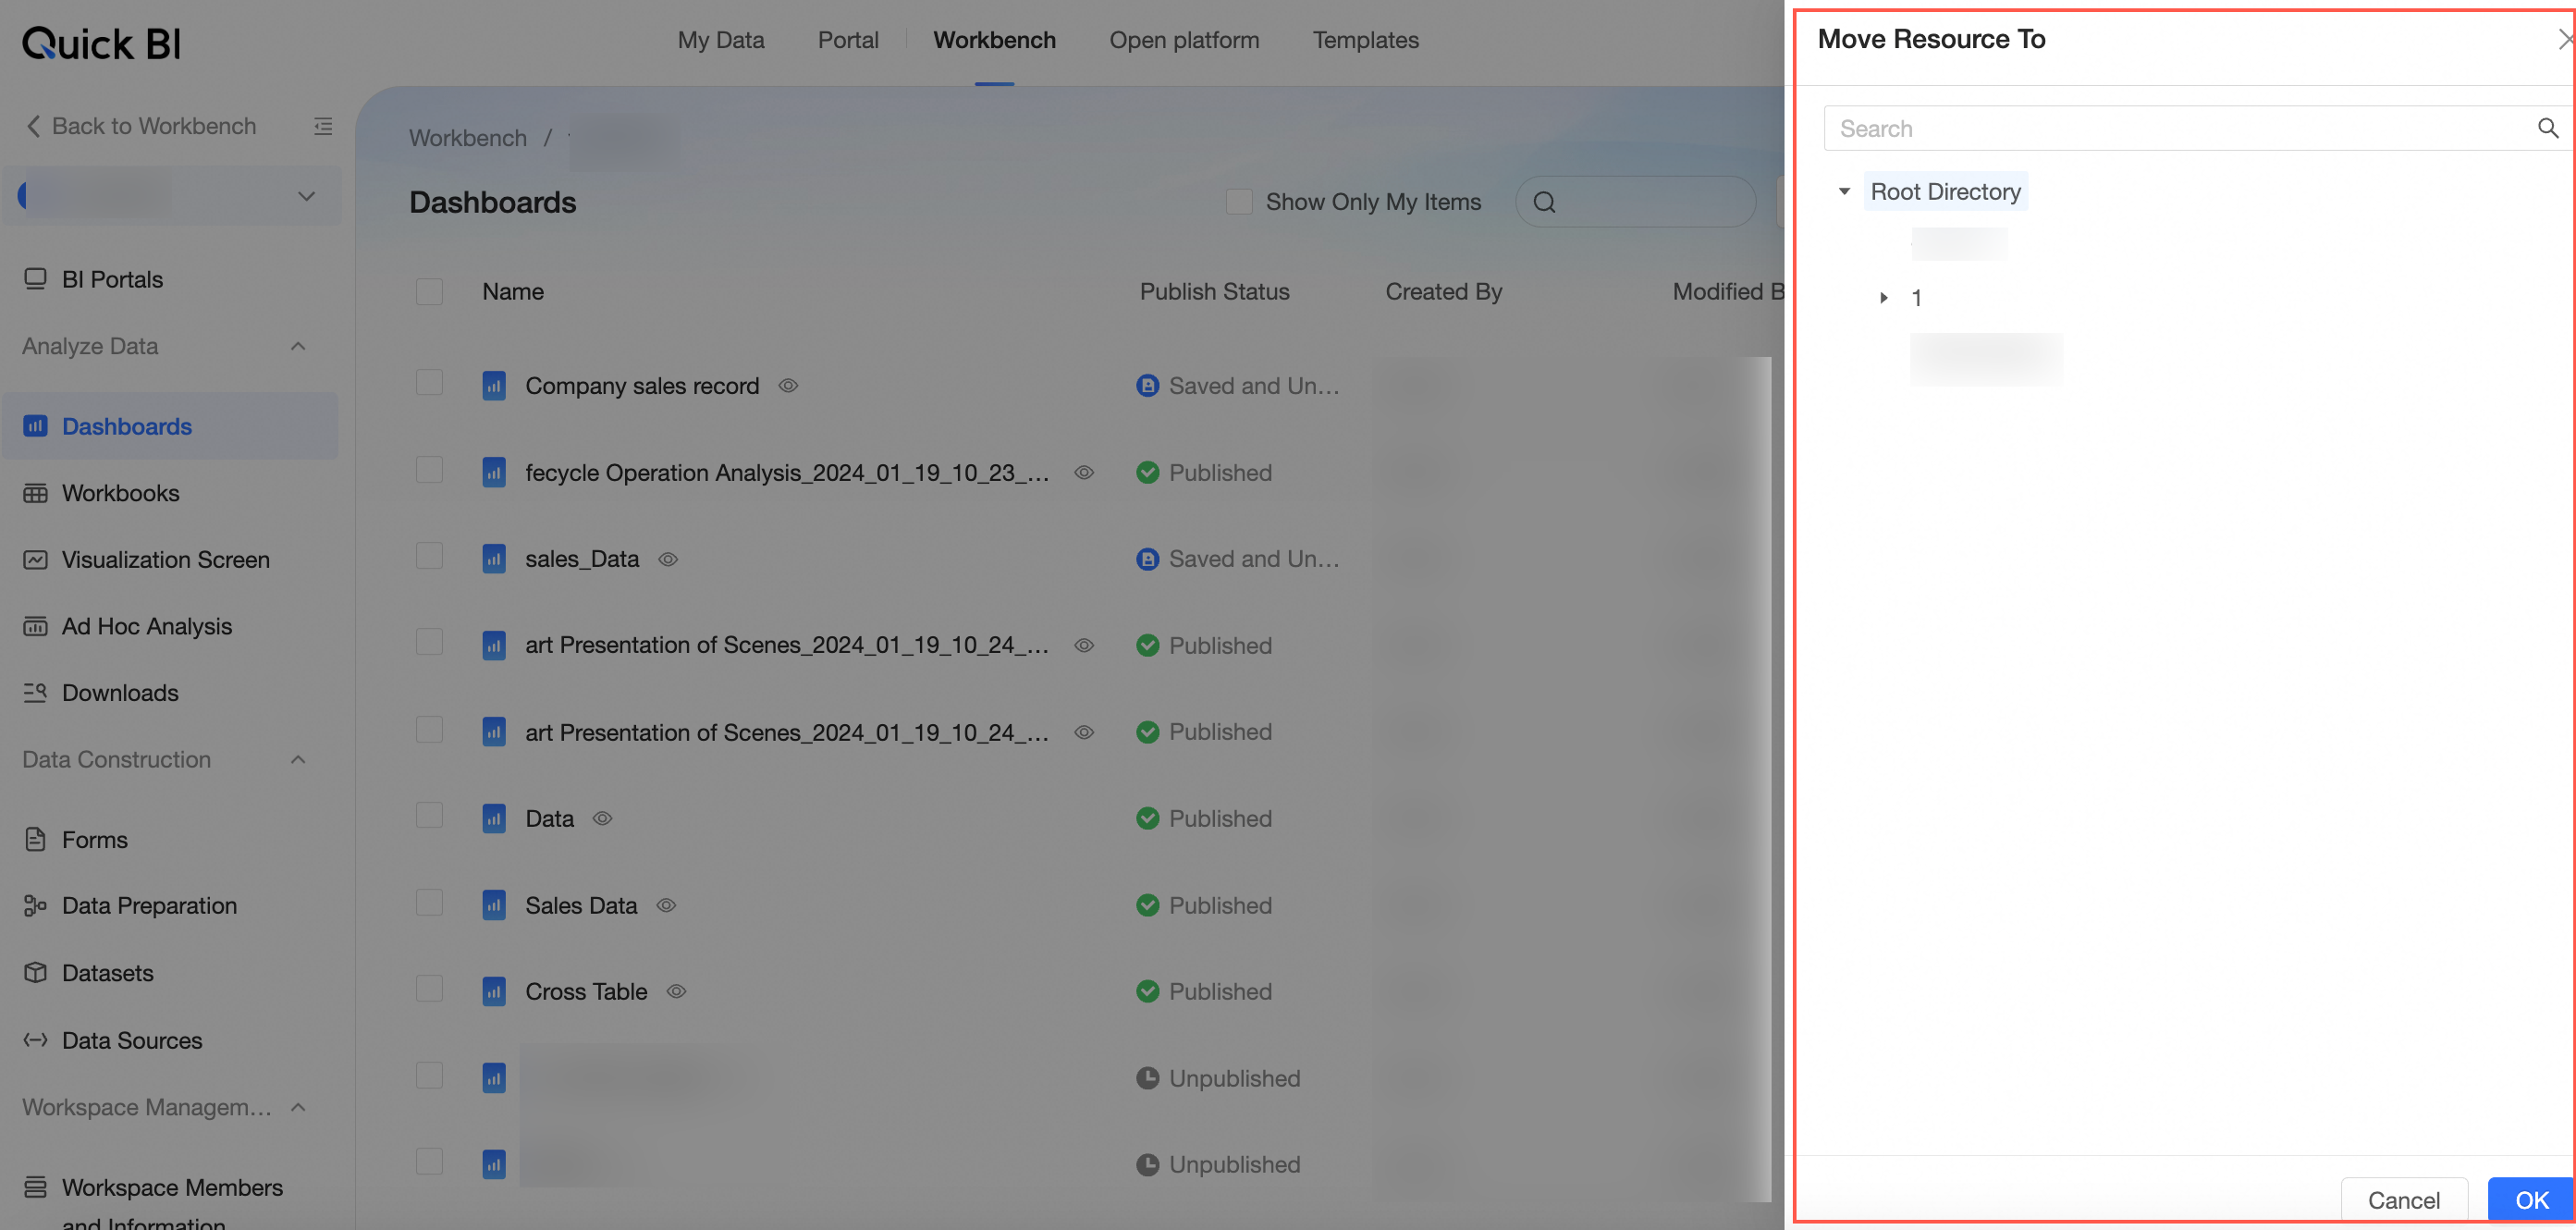
Share a dashboard
This feature is available only when the publish status of the dashboard is Published.
-
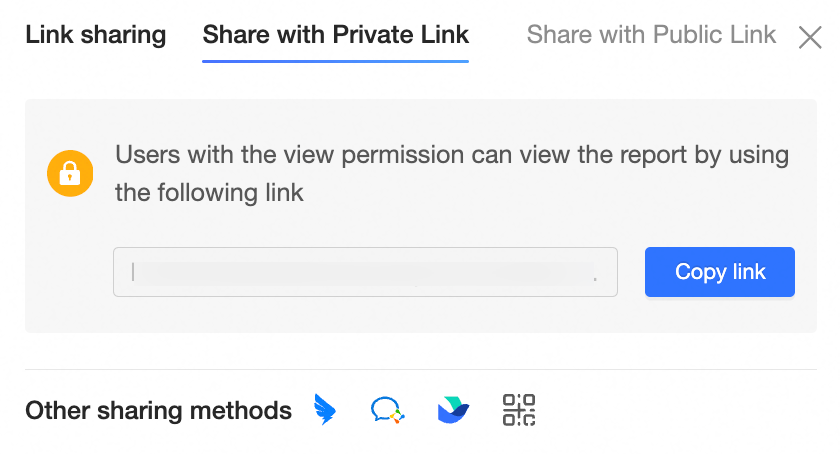
On the Dashboards page, open the sharing dialog box as shown.
-
In the Private Link Sharing dialog box, copy the URL and send it to authorized users.
Publish channels
This feature is available only when the publish status of the dashboard is Published.
-
On the Dashboards page, configure a publish channel as shown.
-
In the Publish Channel dialog box, click Enable Embedding.
After you enable embedding, a success message and the Embedding Channel dialog box appear. Click Go to Configuration to configure embedding. Publish channels.
Make a dashboard public
-
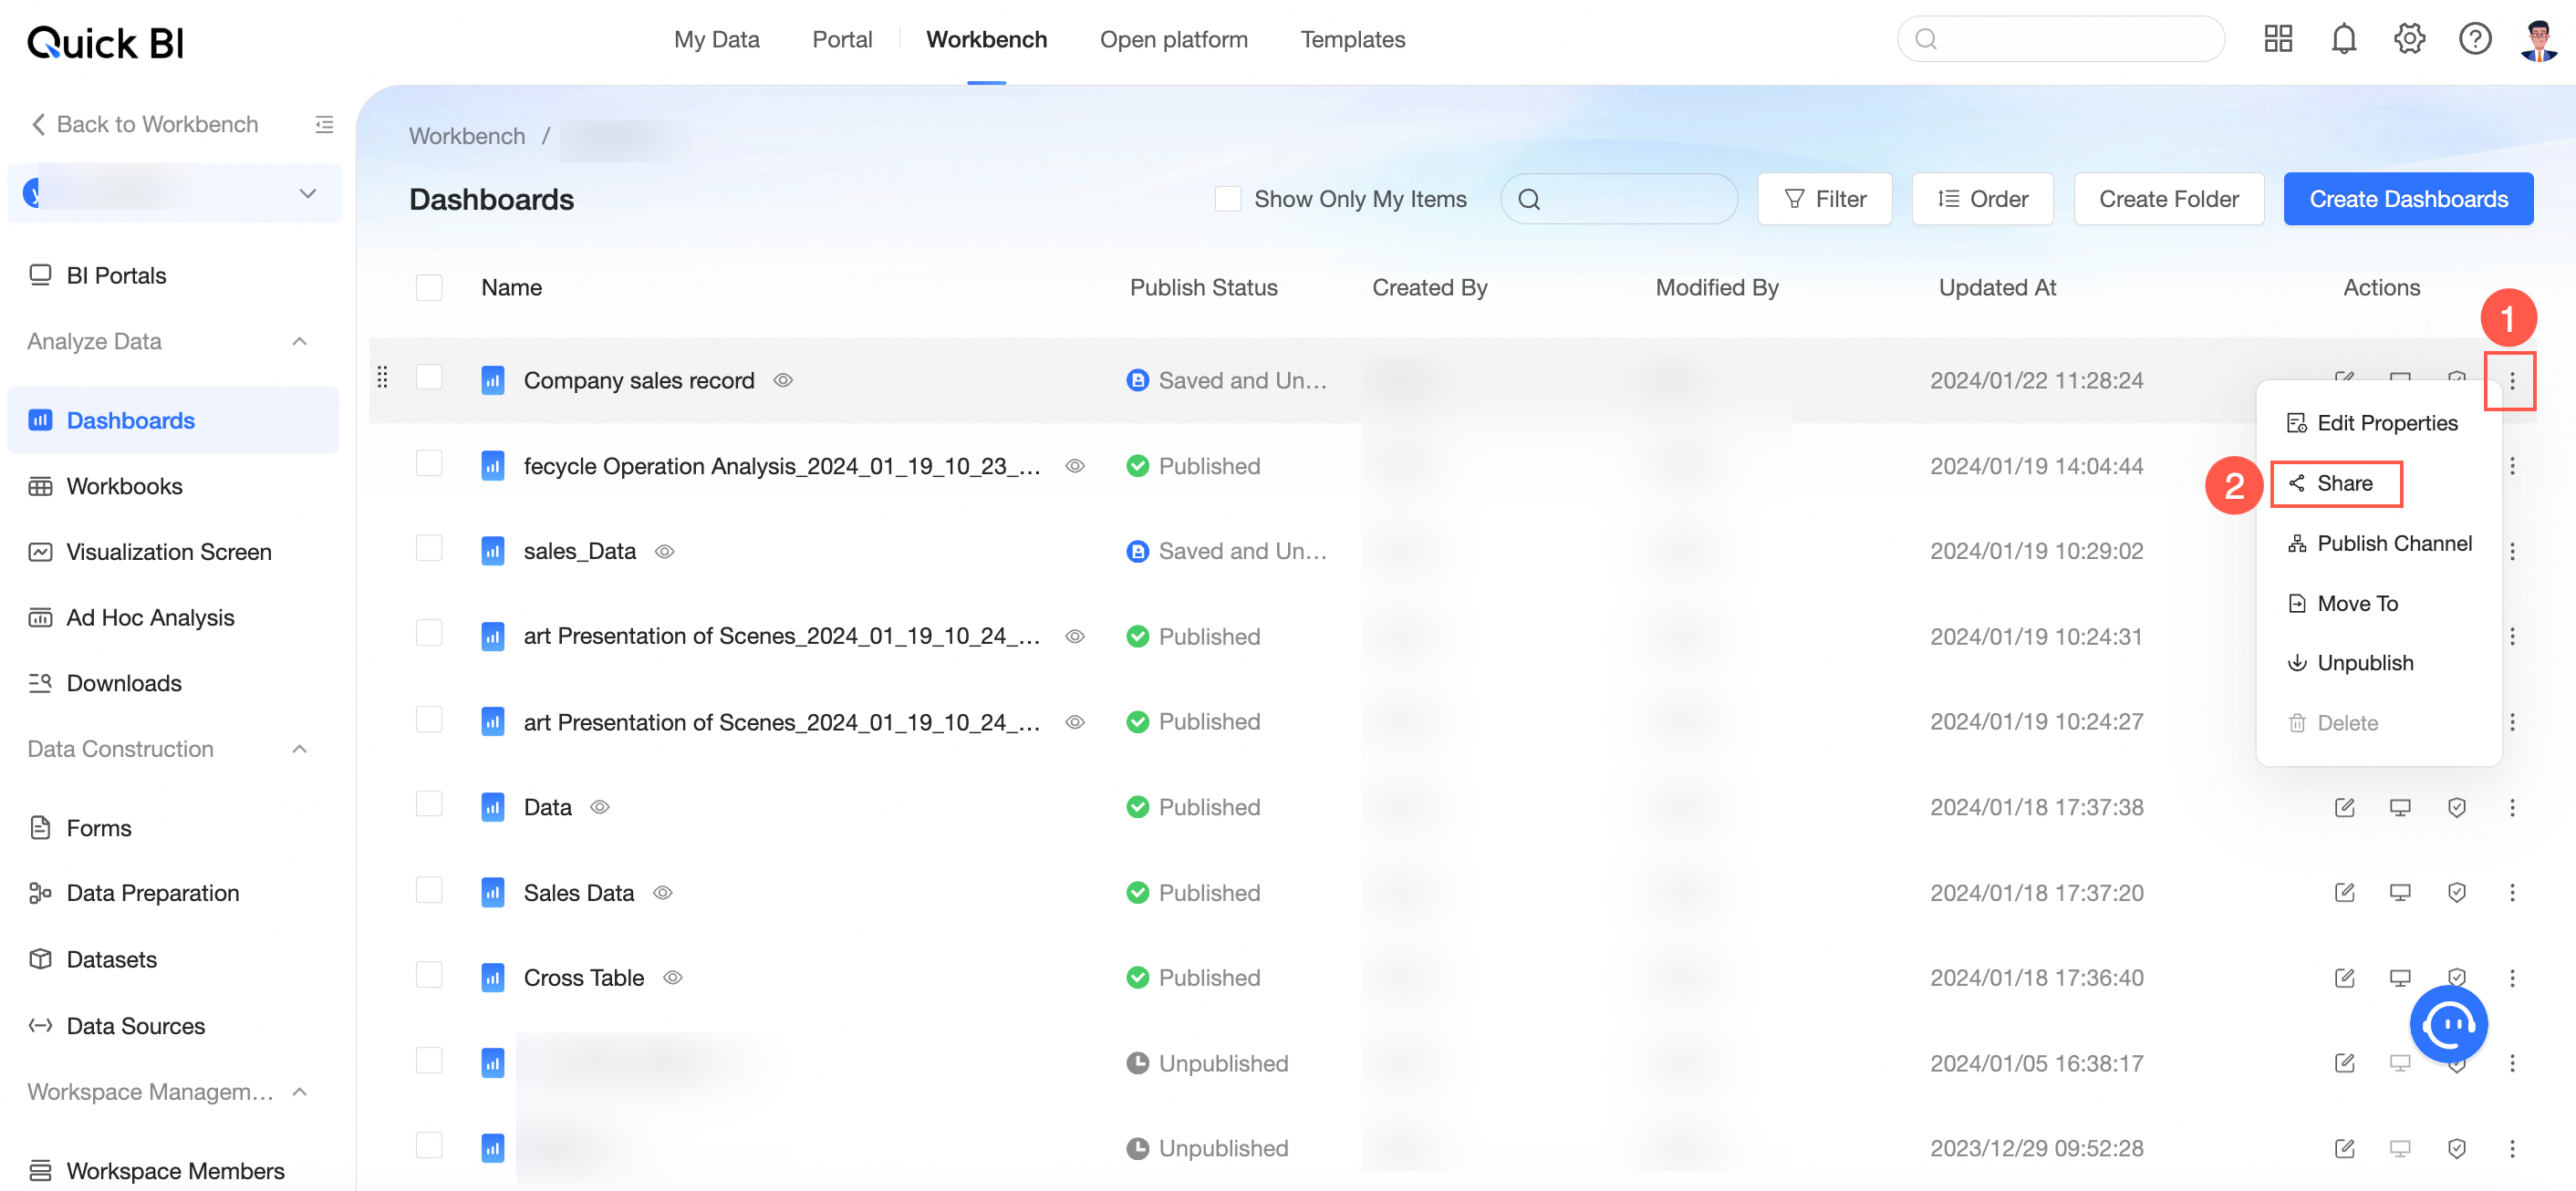
On the Dashboards page, find the target dashboard, right-click it, then select Share.
Alternatively, click the
icon in the dashboard's row and select Share. -
In the Share dialog box, switch to the Public Link Sharing tab.
-
Click Make Public to make the dashboard public.
 icon in the dashboard's row and select Share.
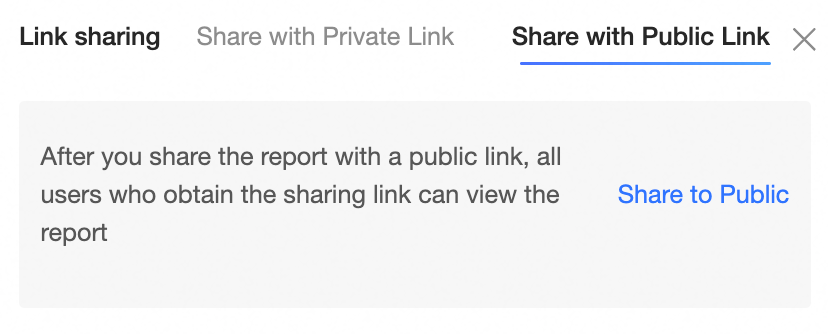
Copy a dashboard
Copy a dashboard by using Save As.
-
On the Dashboards page, click the target dashboard.
-
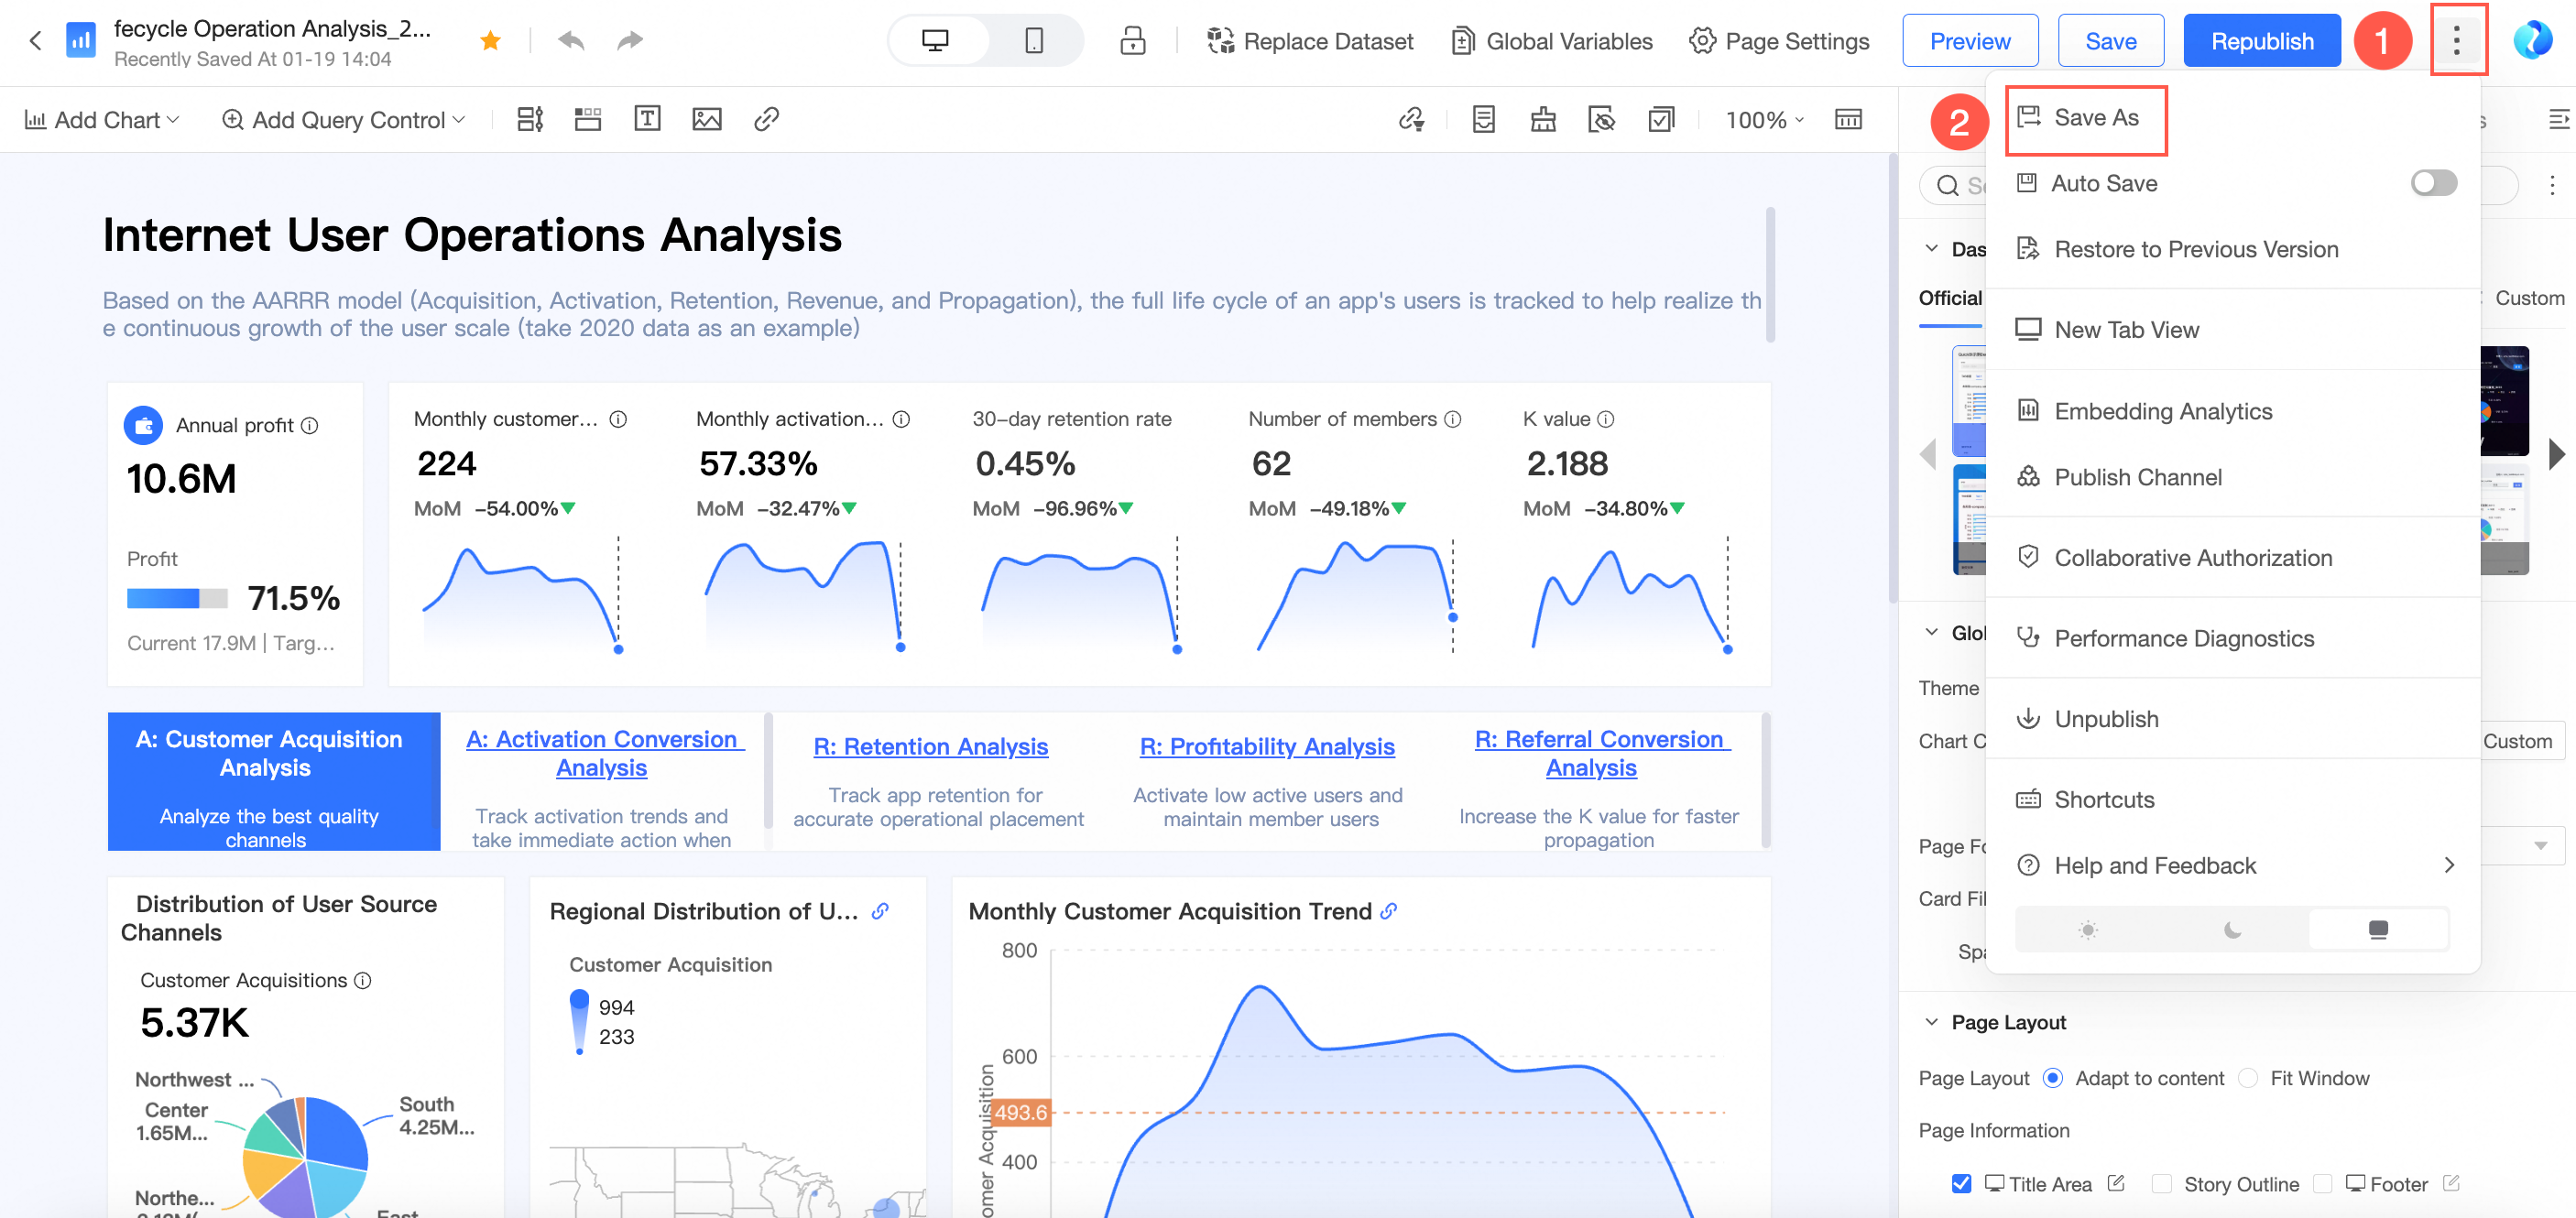
On the dashboard editing page, click the
icon and select Save As. -
In the Save as Dashboard dialog box, enter a dashboard name, select a destination directory, then click OK.
Transfer and rename
-
On the Dashboards page, find the target dashboard, right-click it, then select Properties.
Alternatively, you can click the
icon in the dashboard's row. -
In the Properties dialog box, configure the following parameters:
Parameter
Description
Name
The dashboard name.
NoteDashboard names must be unique within the same directory but can be duplicated across different directories.
Owner
Select a new owner to transfer the dashboard.
Description
Add a description for the dashboard.
-
Click OK.
The transfer feature is available only in the Pro and Enterprise Standard editions.
Co-authoring
-
On the Dashboards page, find the target dashboard, right-click it, then select Co-authoring.
Alternatively, you can click the
icon in the dashboard's row.NoteWhen co-authoring is enabled, multiple users can edit a data asset simultaneously, but only one user can save at a time. The lock preemption mechanism:
-
If User A saves and exits the edit mode, User B can open and edit the data asset directly without needing to preempt the lock.
In this case, User B's edits will not overwrite User A's saved content.
-
If User A loses their internet connection or is inactive for 3 hours without saving, User B can open and edit the data asset directly without needing to preempt the lock.
In this case, User B's edits will overwrite User A's unsaved changes.
-
If User A is actively editing the data asset, User B must preempt the lock to make edits.
-
If User A has saved the data asset but has not exited the edit mode, User B's preemption attempt will succeed.
In this case, User B can start editing directly without overwriting User A's saved content.
-
If User B tries to preempt the lock while User A is editing and has unsaved changes, User B will be prompted to choose whether to sync User A's latest modifications.
-
If User B chooses to sync, the system will save User A's updates after User B successfully preempts the lock.
-
If User B chooses not to sync, the system will save User B's updates, overwriting User A's unsaved changes.
After being preempted, User A can continue editing and save their current work as a new data asset, or communicate with User B and attempt to reacquire the lock.
-
-
-
Favorite a dashboard
-
You can favorite a dashboard in the following ways:
-
On the dashboard editing page, click the
icon next to the dashboard name.NoteClick the
icon again to remove the dashboard from your favorites. -
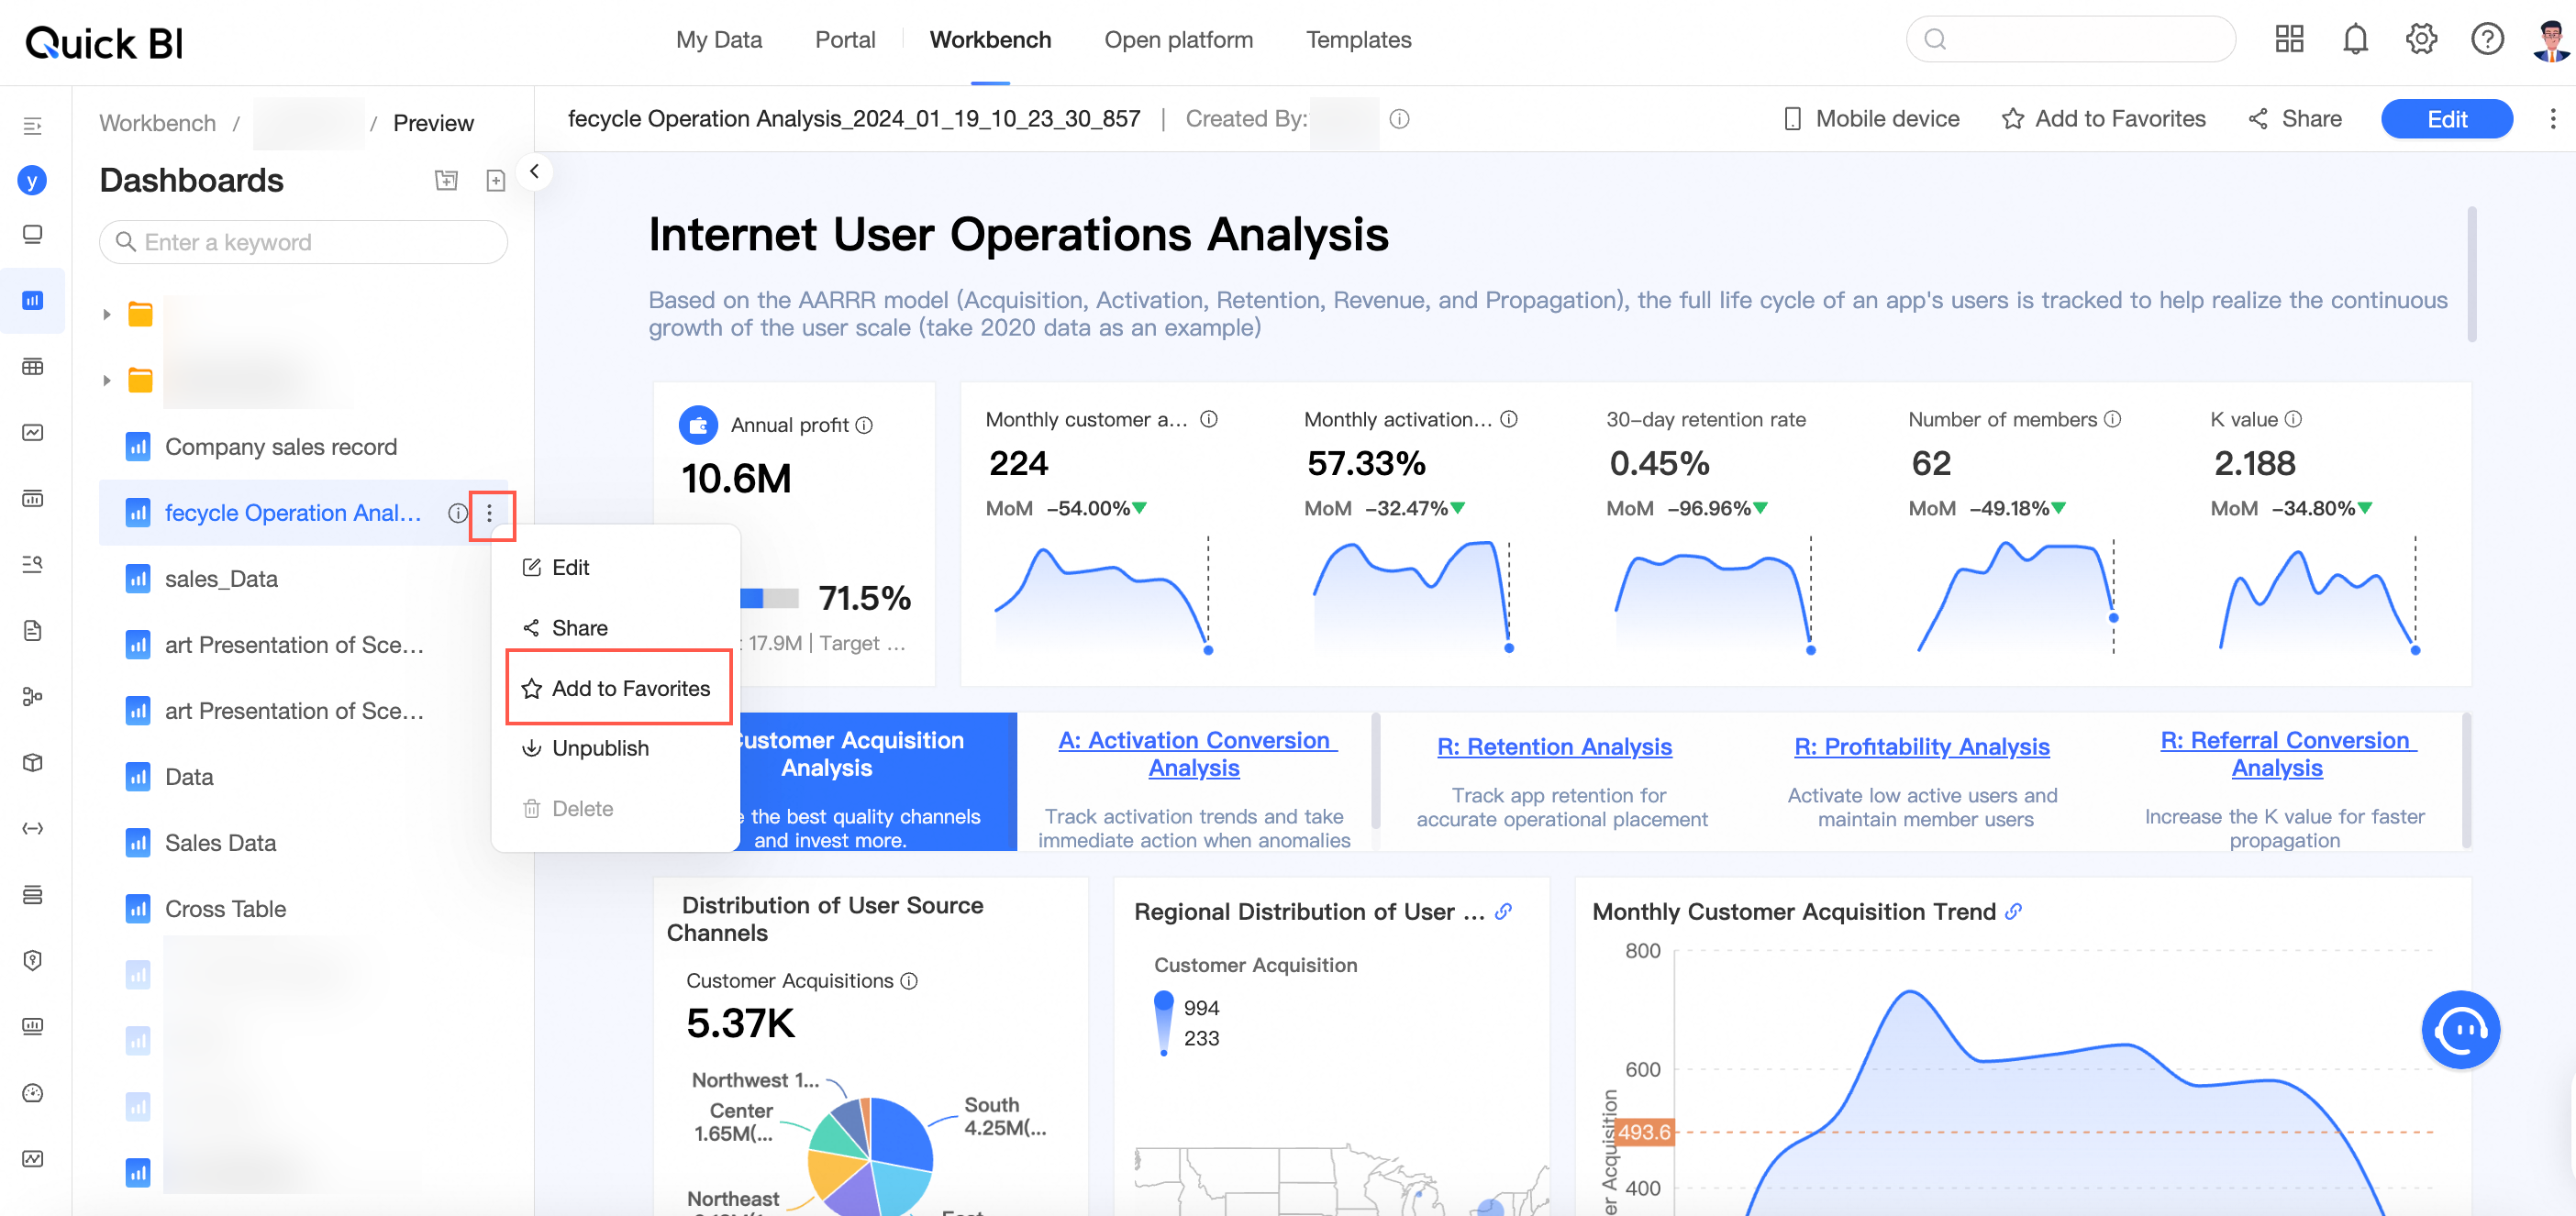
On the dashboard preview page, click the
icon next to the target dashboard and select Favorite, or click the Favorite icon in the upper-right corner.
 icon next to the dashboard name.
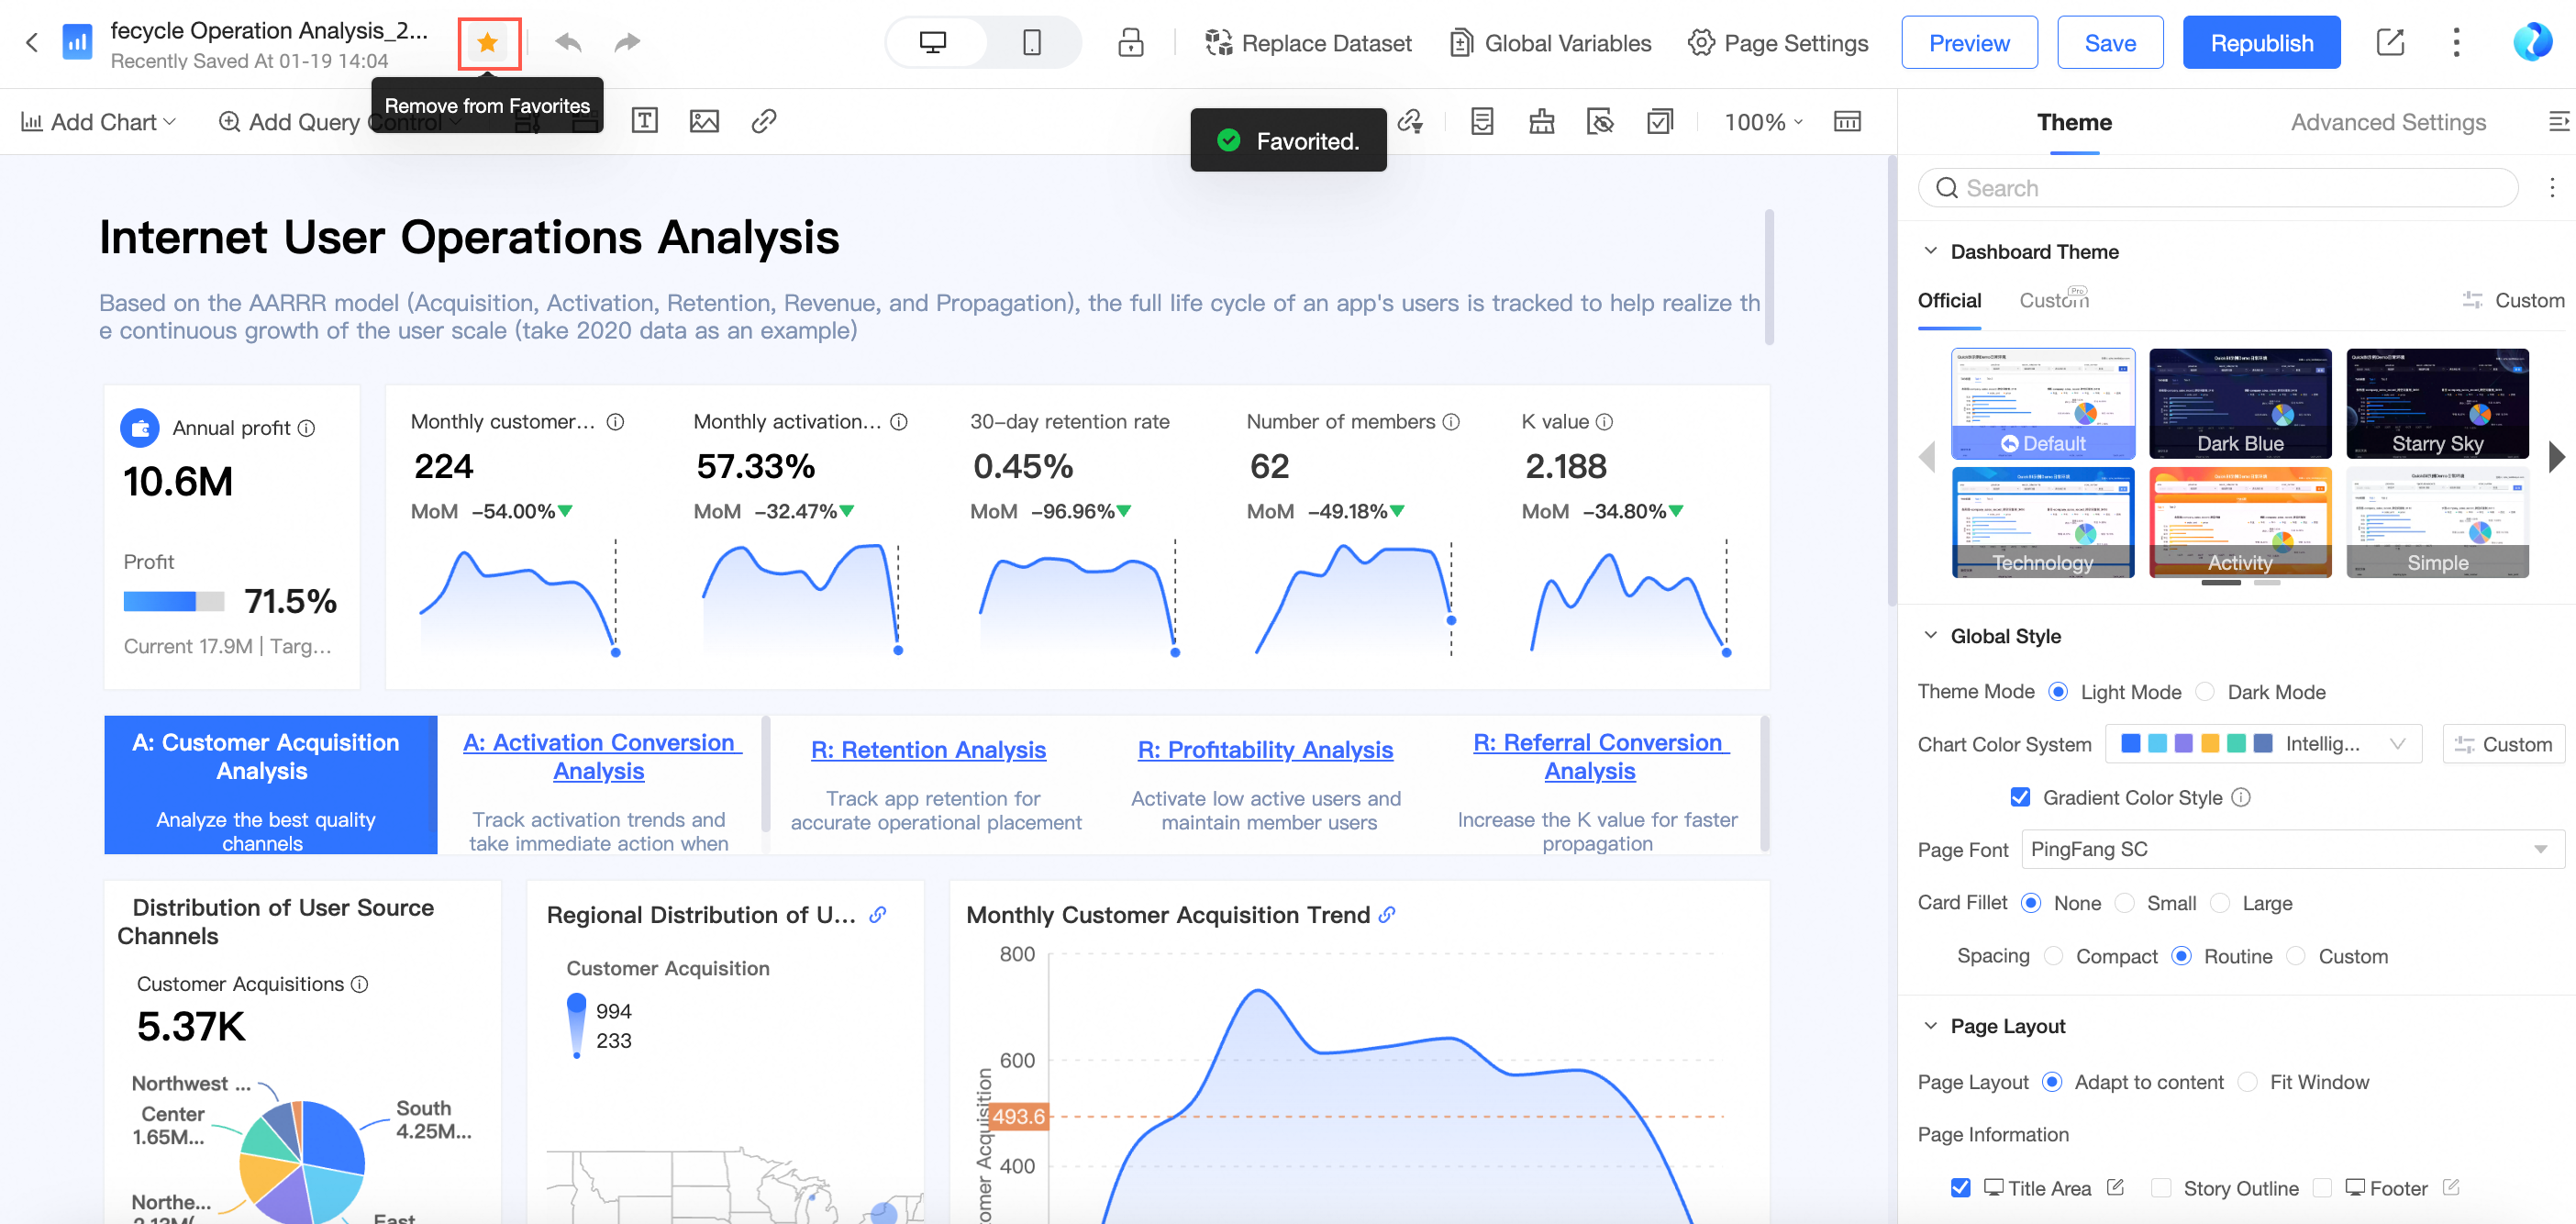
Switch between light and dark modes
-
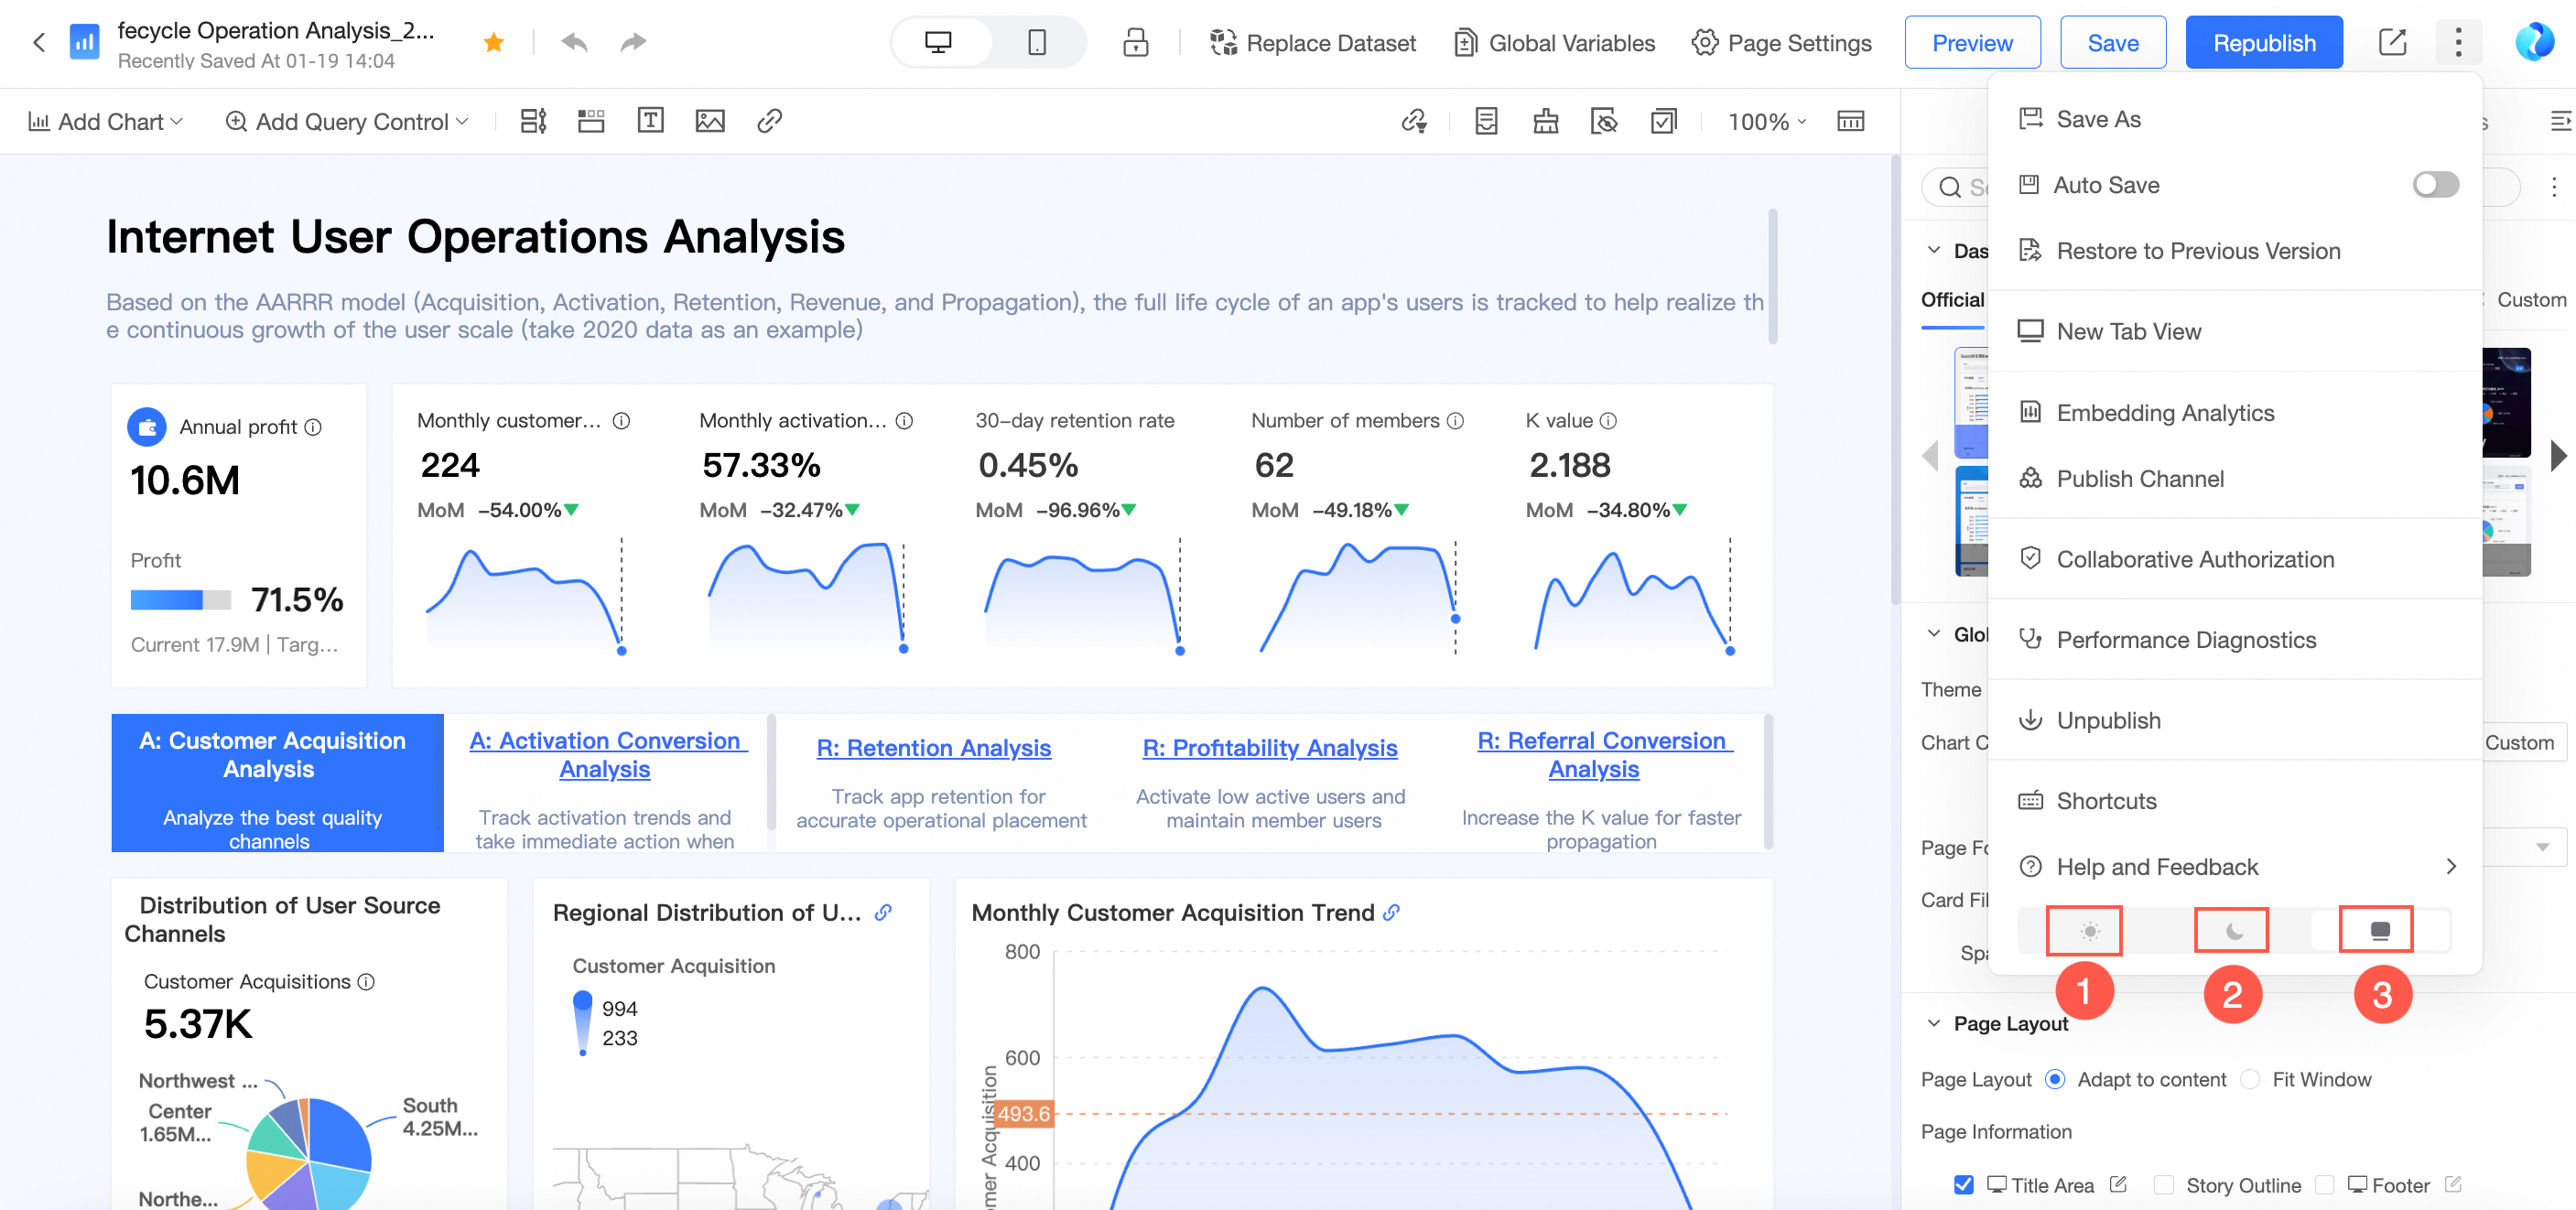
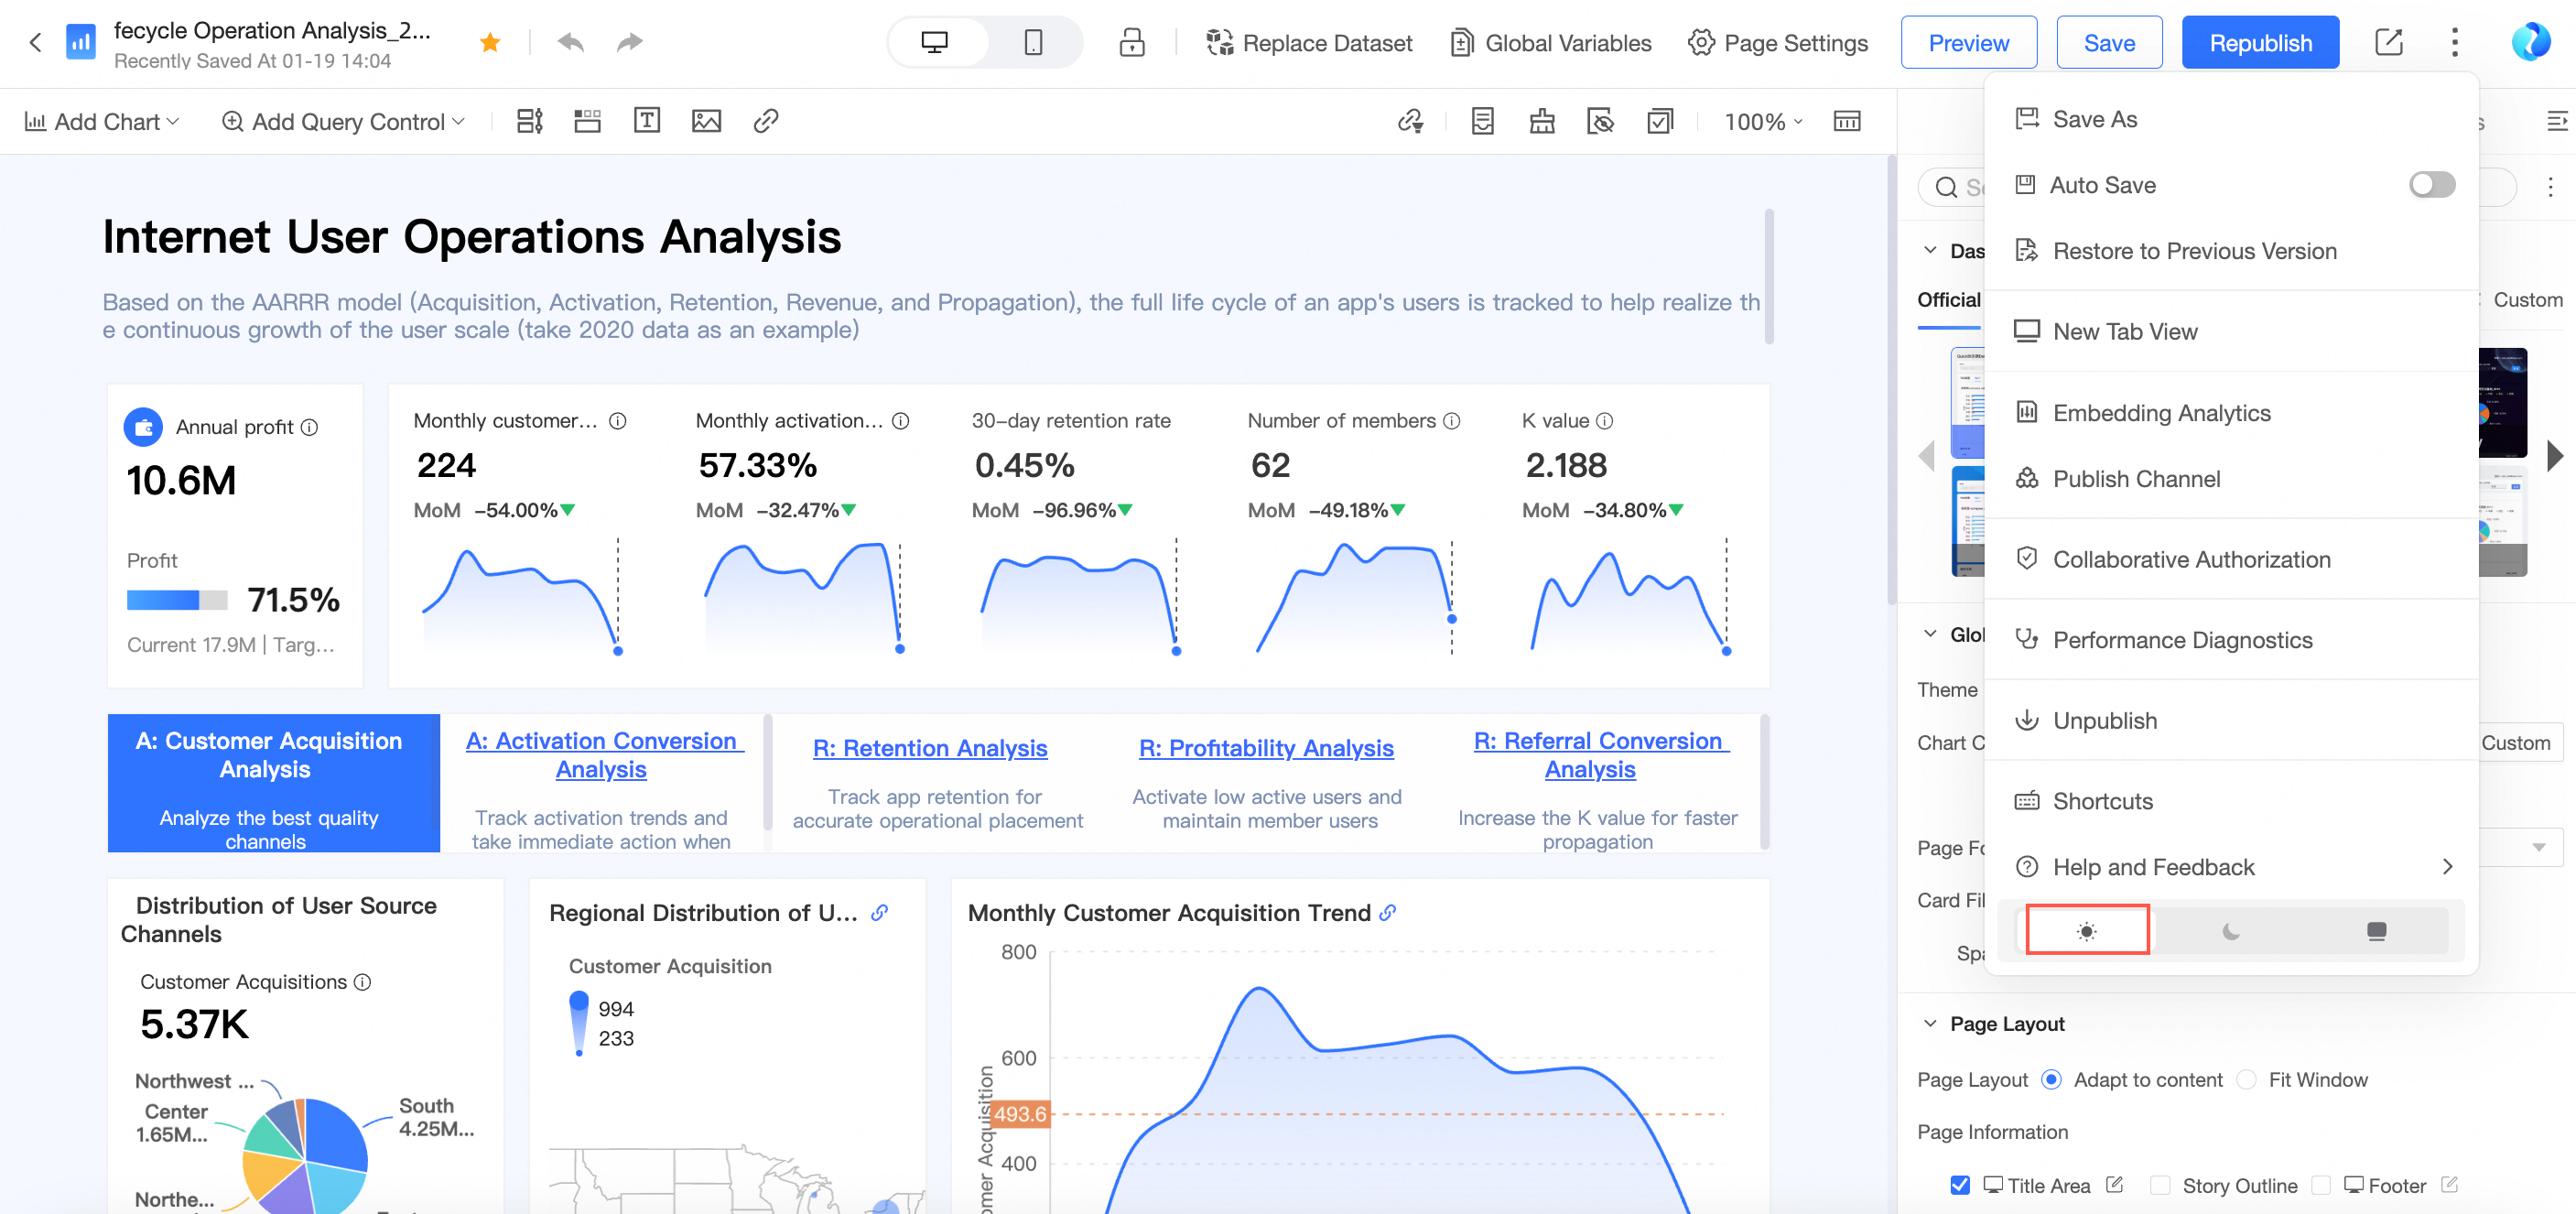
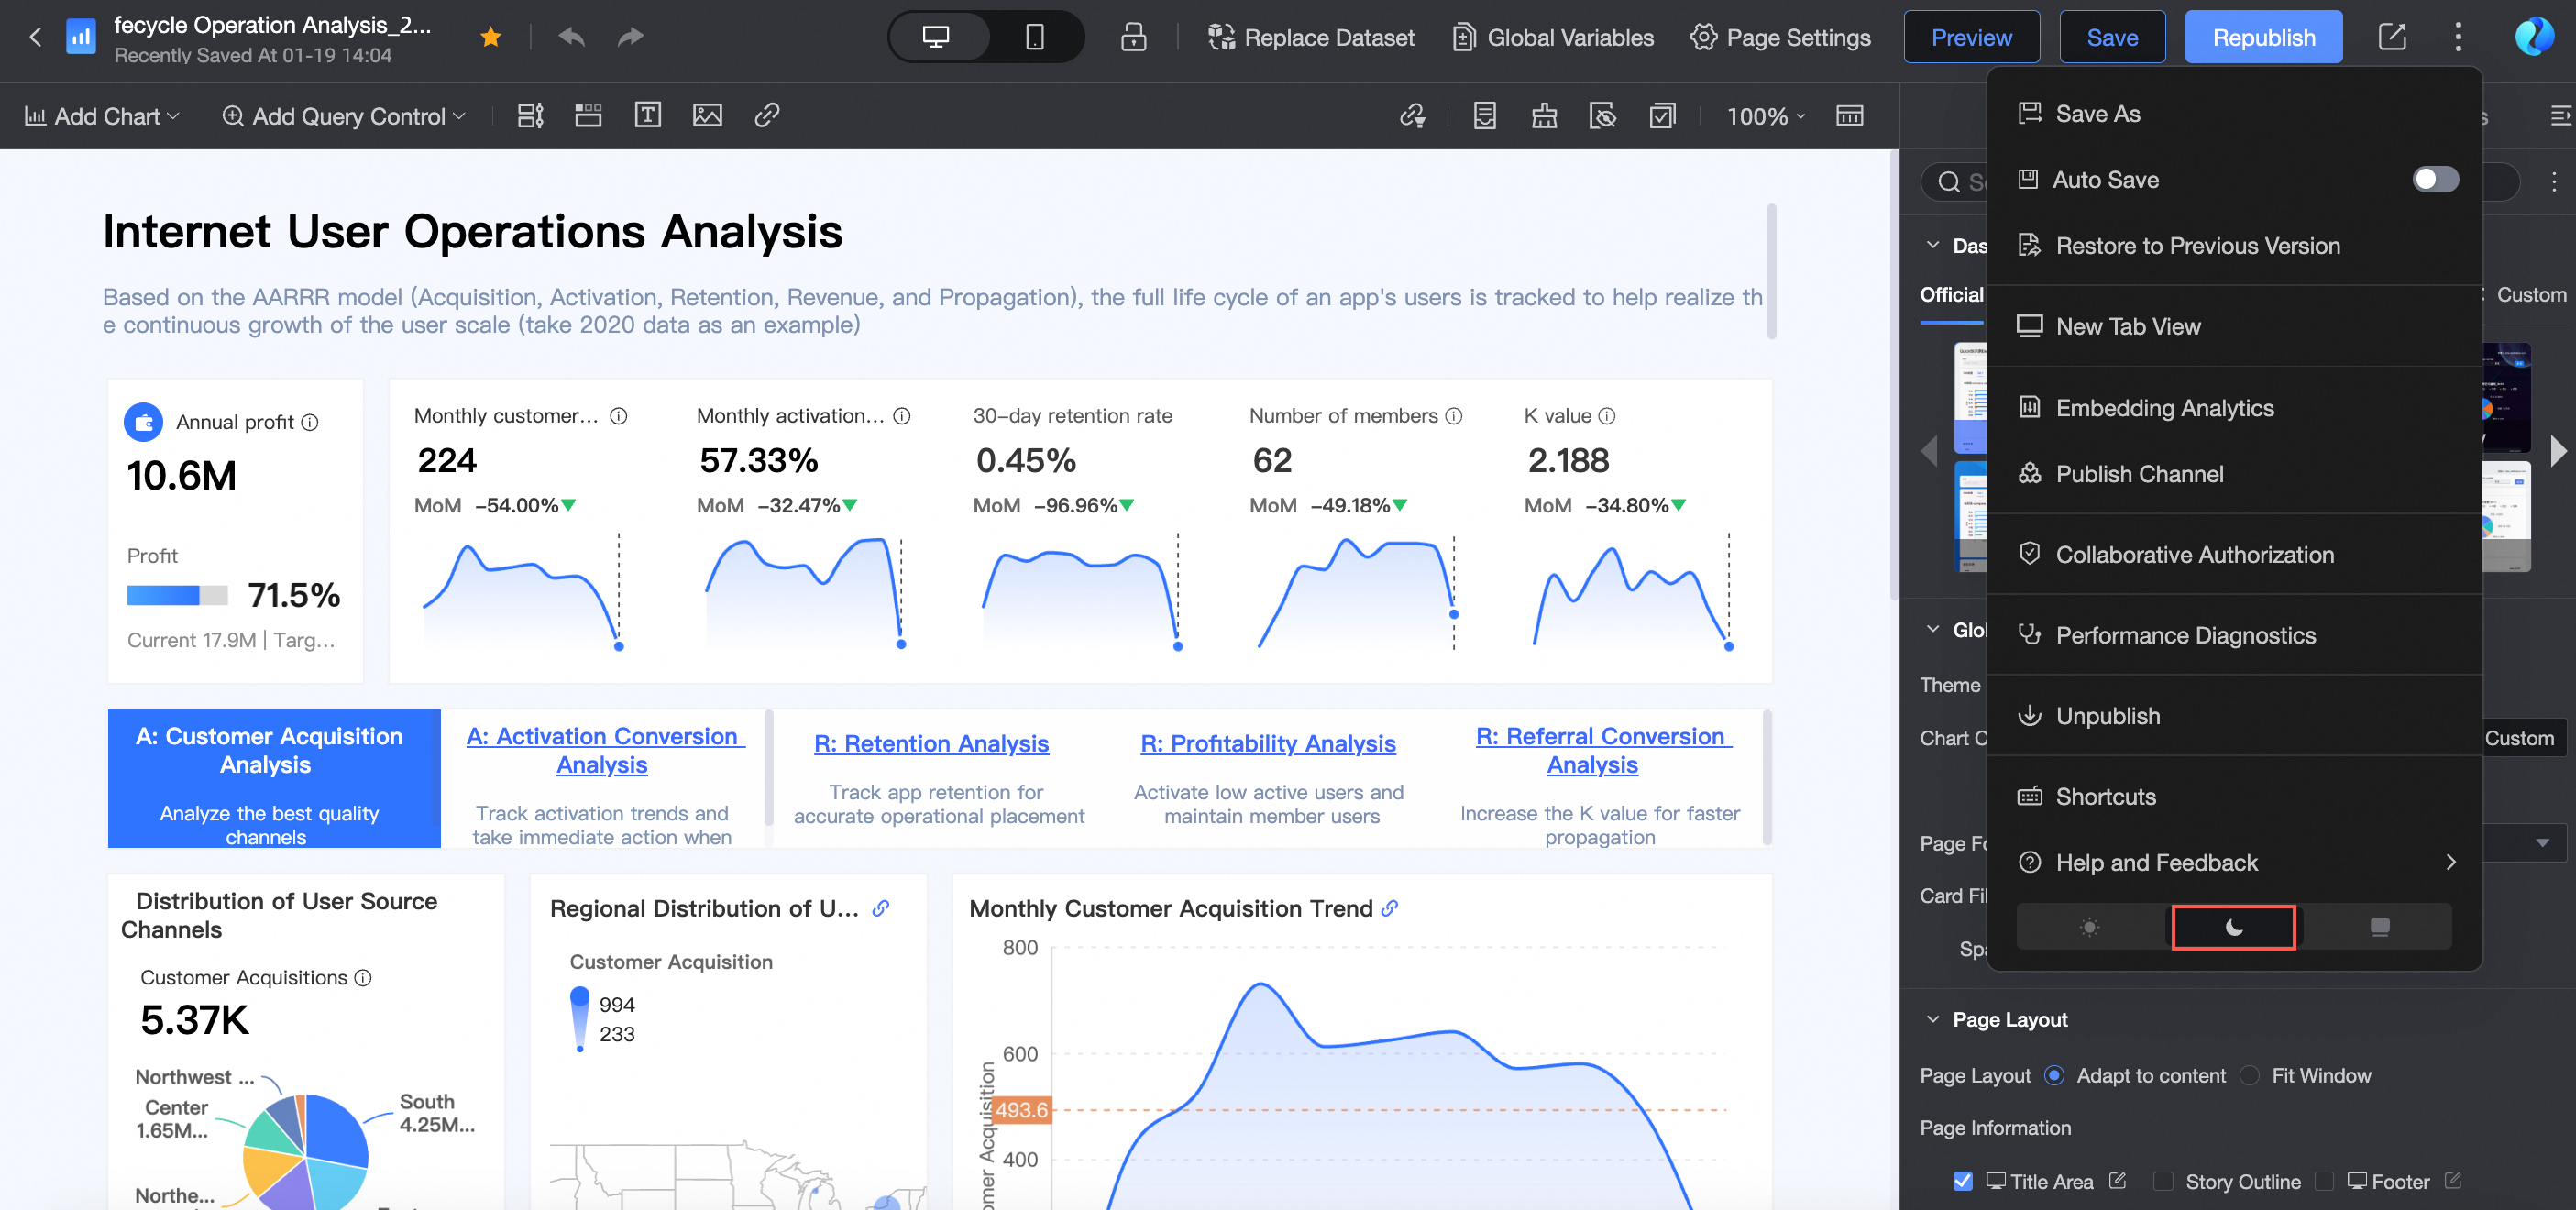
On the dashboard editing page, click the
icon in the upper-right corner and find the mode switching icons at the bottom to switch the dashboard mode.NoteThe Personal edition supports only light mode.
① Light mode
② Dark mode
③ Follow system
Follows the system style configured in Customization.
NoteOnly organization administrators can set the system style in Customization. Dashboard-level mode settings take precedence over organization-level settings.

Delete a dashboard
To delete a Published dashboard, unpublish it first.
A deleted dashboard cannot be recovered. Proceed with caution.
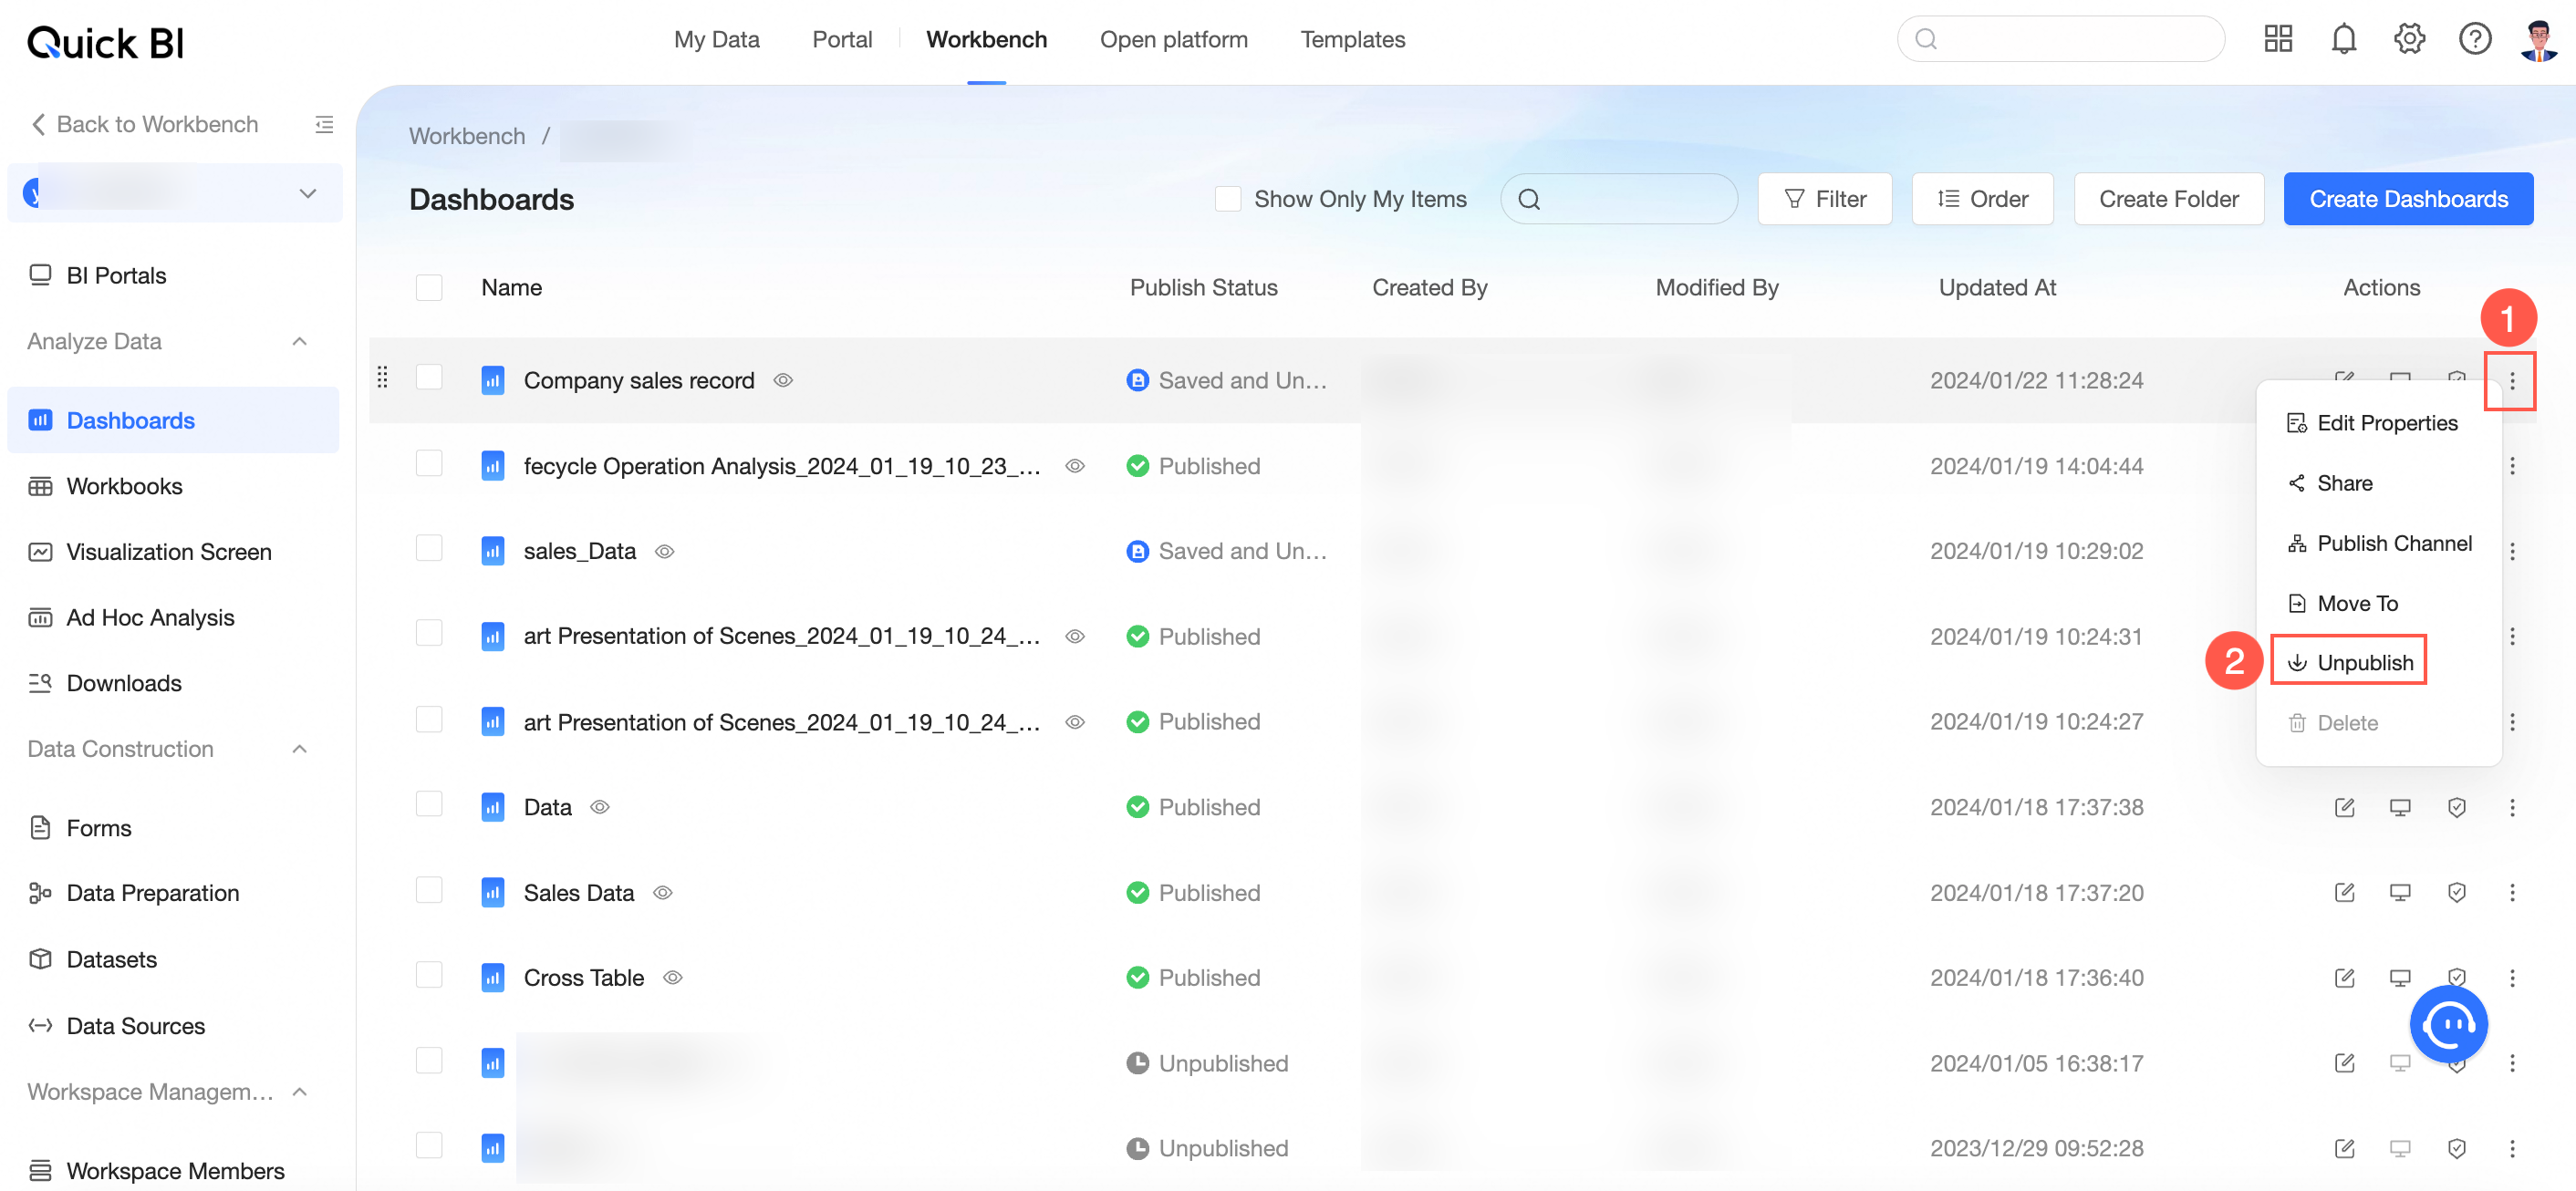
- (Optional)
On the Dashboards page, unpublish the dashboard as shown.
NoteIf your dashboard's publish status is already Unpublished, skip this step.
-
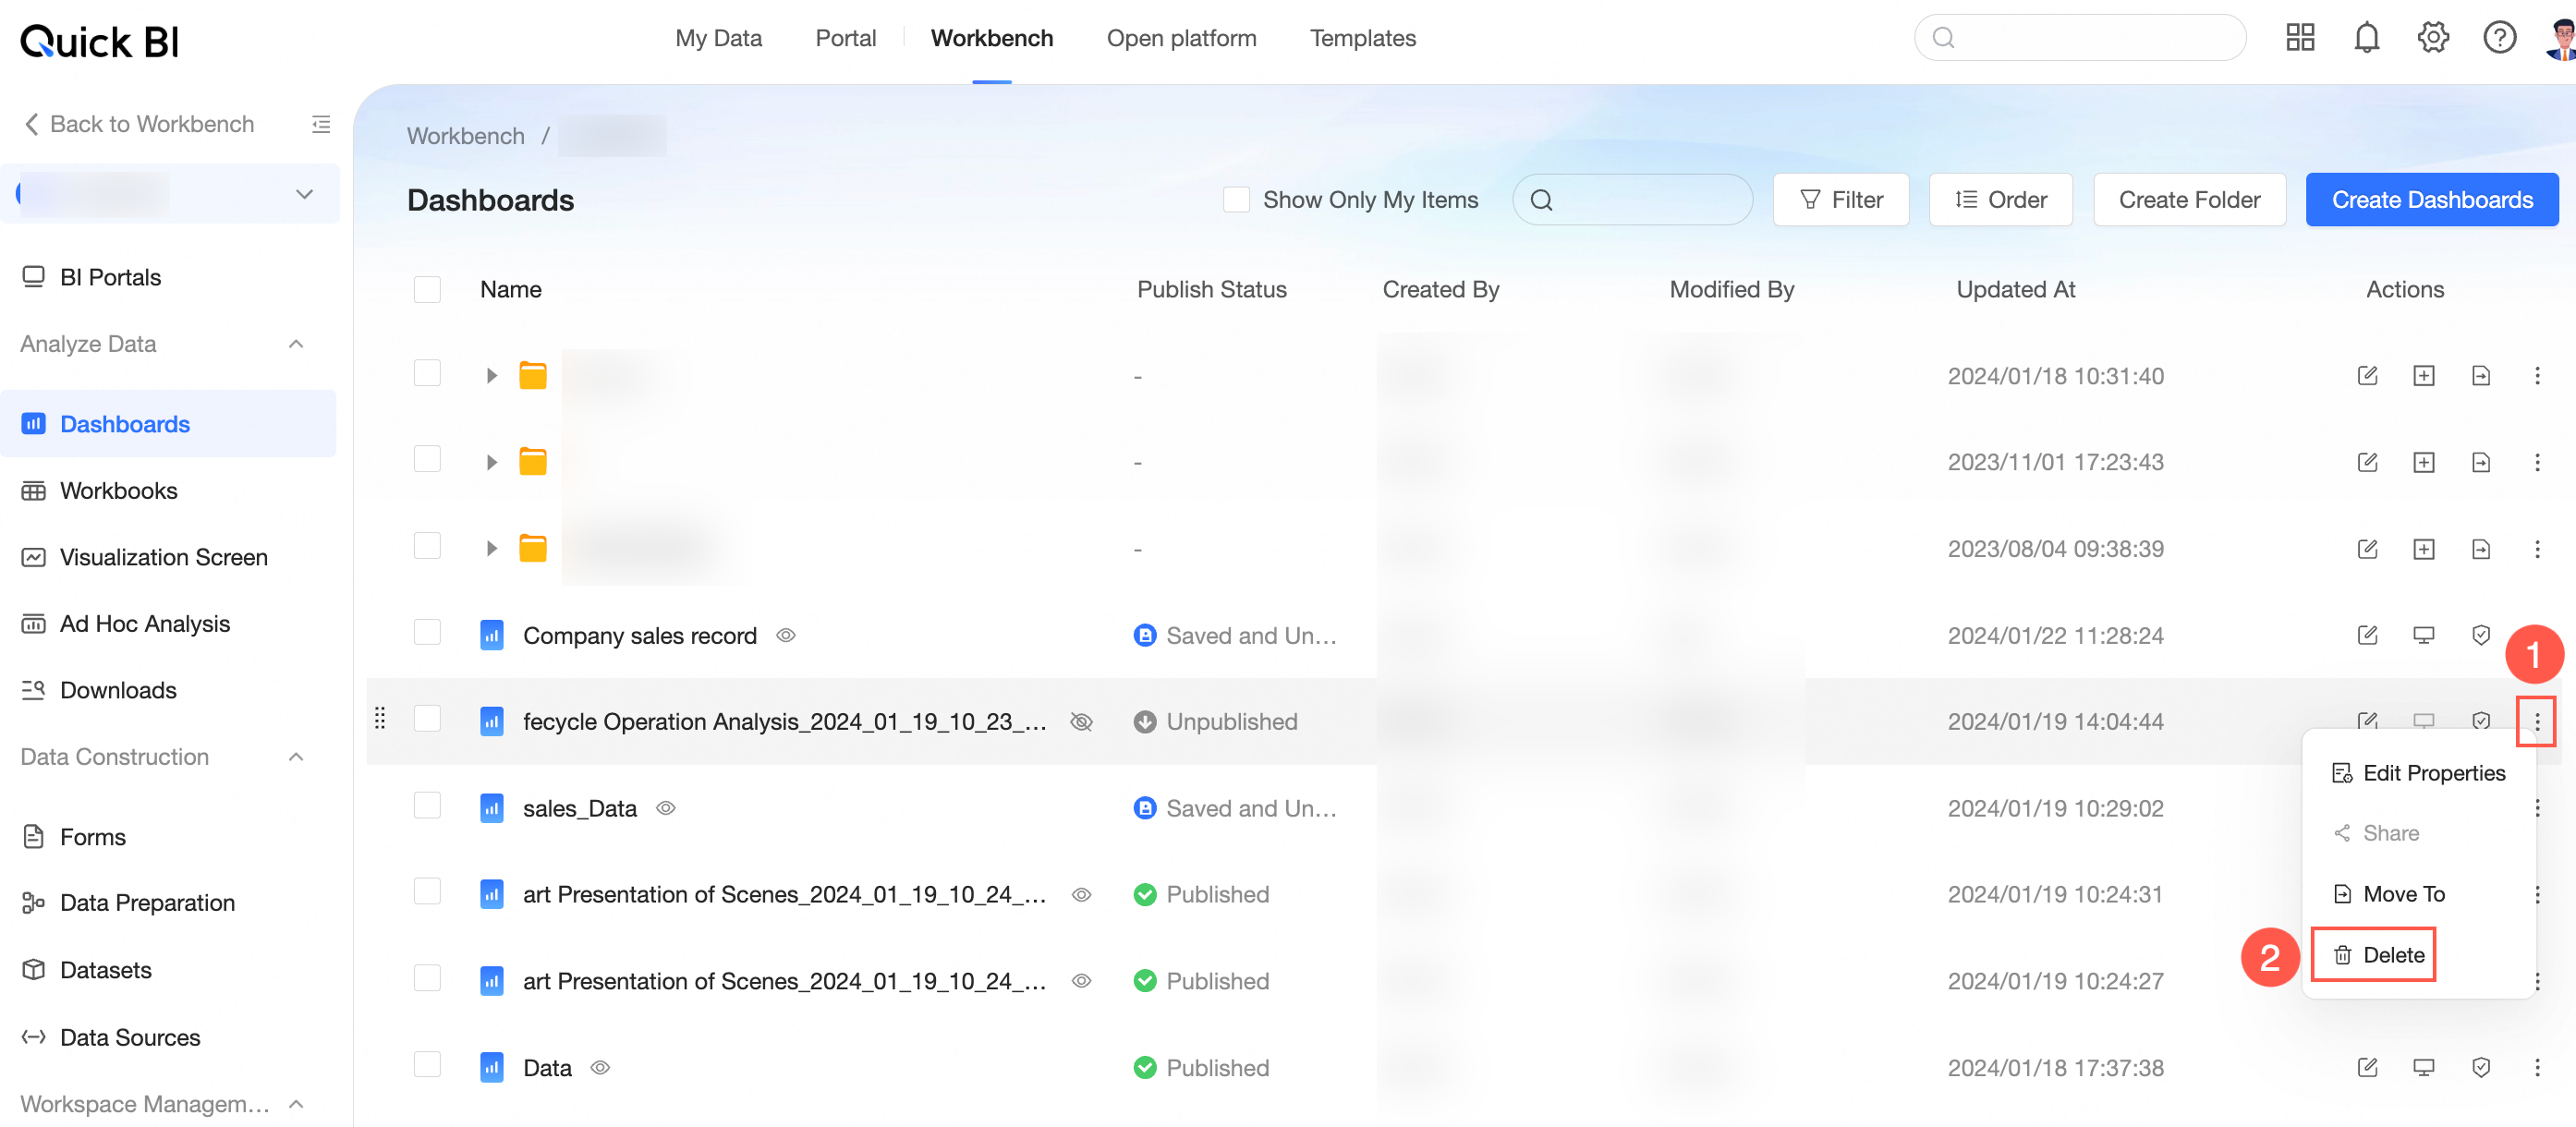
On the Dashboards page, delete the dashboard as shown.
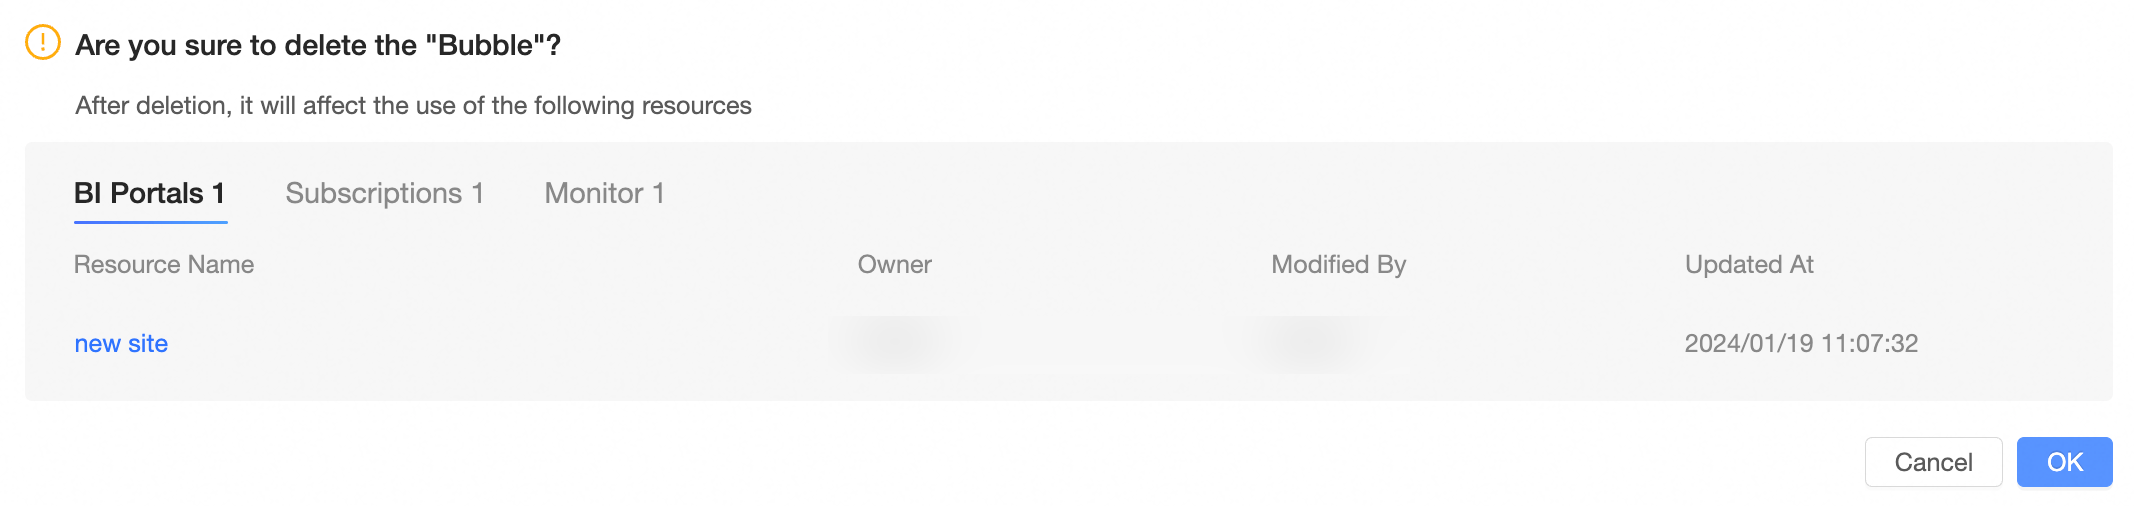
If this dashboard is linked to a data portal, subscription, or monitoring and alerting rule, or a jump link to it exists from a data screen, dashboard, or spreadsheet, a dialog box lists the affected published resources with their name, owner, modifier, and modification time.
-
In the confirmation dialog box that appears, click OK.
Rename a dashboard
- (Optional)
On the Dashboards page, find the target dashboard.
-
Double-click the dashboard name to rename it.