A metric filter control dynamically filters measures such as sales, profit, or conversion rate across multiple charts from a single selection. Instead of filtering by dimensions like time or region, it shows or hides measures, helping you quickly locate, combine, or exclude specific business metrics for streamlined cross-chart analysis.
Use Cases
-
Scenario: You need to analyze the same set of measures, such as sales and profit margin, across multiple charts. Manually adjusting the measure configuration for each chart is time-consuming and error-prone.
-
Solution: With a metric filter control, you select the desired measures once. All linked charts update simultaneously, ensuring consistent analysis.
-
Example: A sales manager needs to compare various business metrics in a "Weekly Trend Chart" and a "Monthly Trend Chart". Using a metric filter control, the manager can instantly switch both charts to display sales, profit, or cost to quickly compare measures across different time granularities.
Limitations
-
Prerequisites: Before you begin, ensure you have completed the following:
-
You have created a dashboard. The charts you want to control must share the same dataset and include the measure fields you intend to filter.
-
You have added an empty query control to the dashboard. For more information, see Create a query control.
-
-
Chart limitations: The metric filter control supports the following chart types.
-
Tables: crosstab, details table, trend analysis table, and multi-dimensional analysis table.
-
Indicators: metric trend chart.
-
Line/Area charts: line chart, area chart, and percentage stacked area chart.
-
Column/Bar charts: column chart, stacked column chart, percentage column chart, bar chart, stacked bar chart, percentage bar chart, box plot, and histogram.
-
Pie/Ring charts: pie chart, rose chart, and sunburst chart.
-
Geographic charts: choropleth map, bubble map, heat map, flight map, and symbol map.
NoteIn some cases, a chart that typically supports metric filtering cannot use this feature, for example, if the chart has a mixed row and column layout.
-
Access Points
The entry point for configuring the metric filter depends on whether the query control already has content.
-
Entry point 1: When the query control is empty
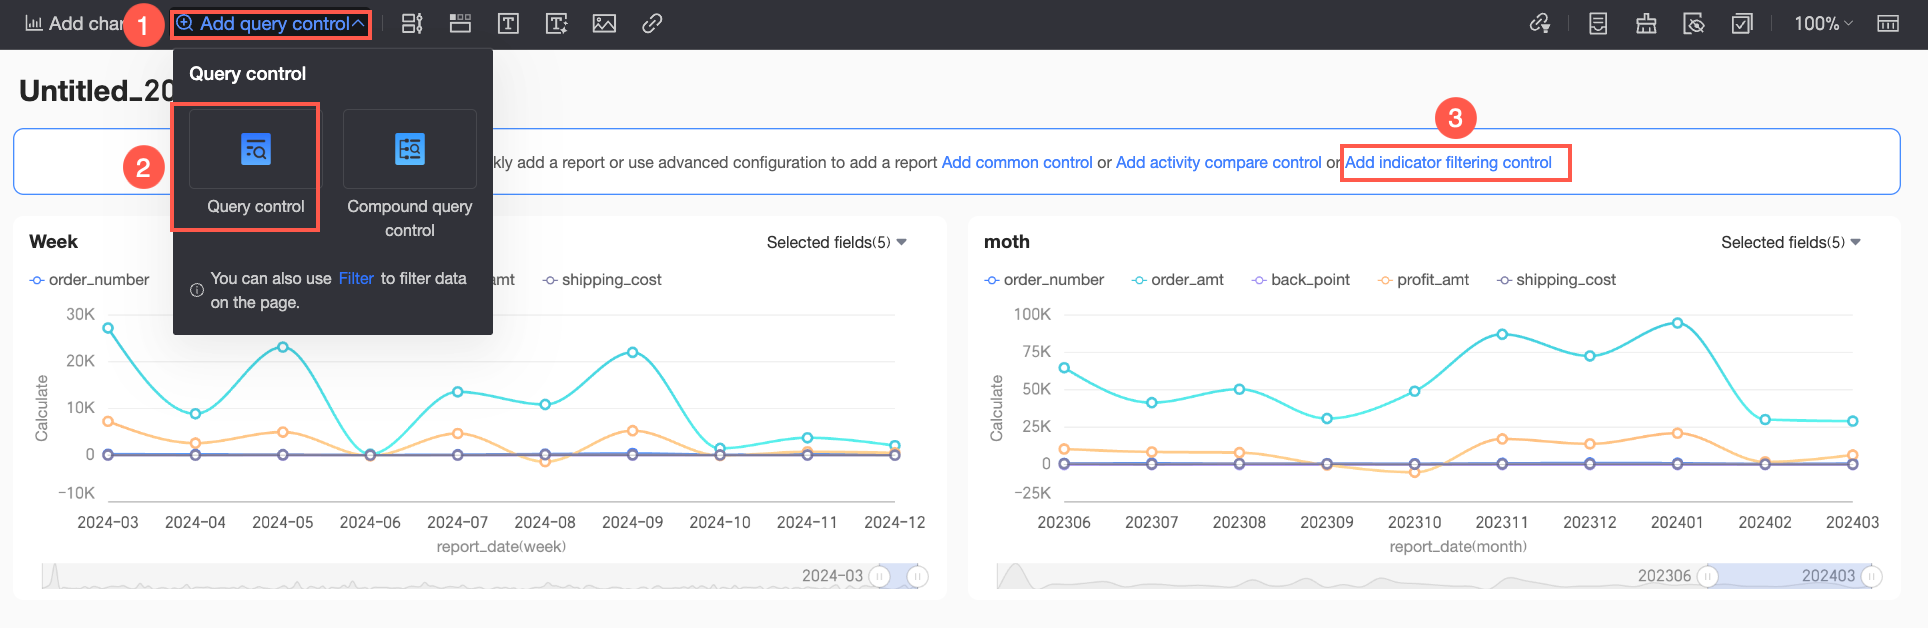
Click Add Query Control > Query Control in the toolbar to add an empty query control to the current dashboard. Click Add Metric Filter Control in the empty query control to open the configuration dialog box.
-
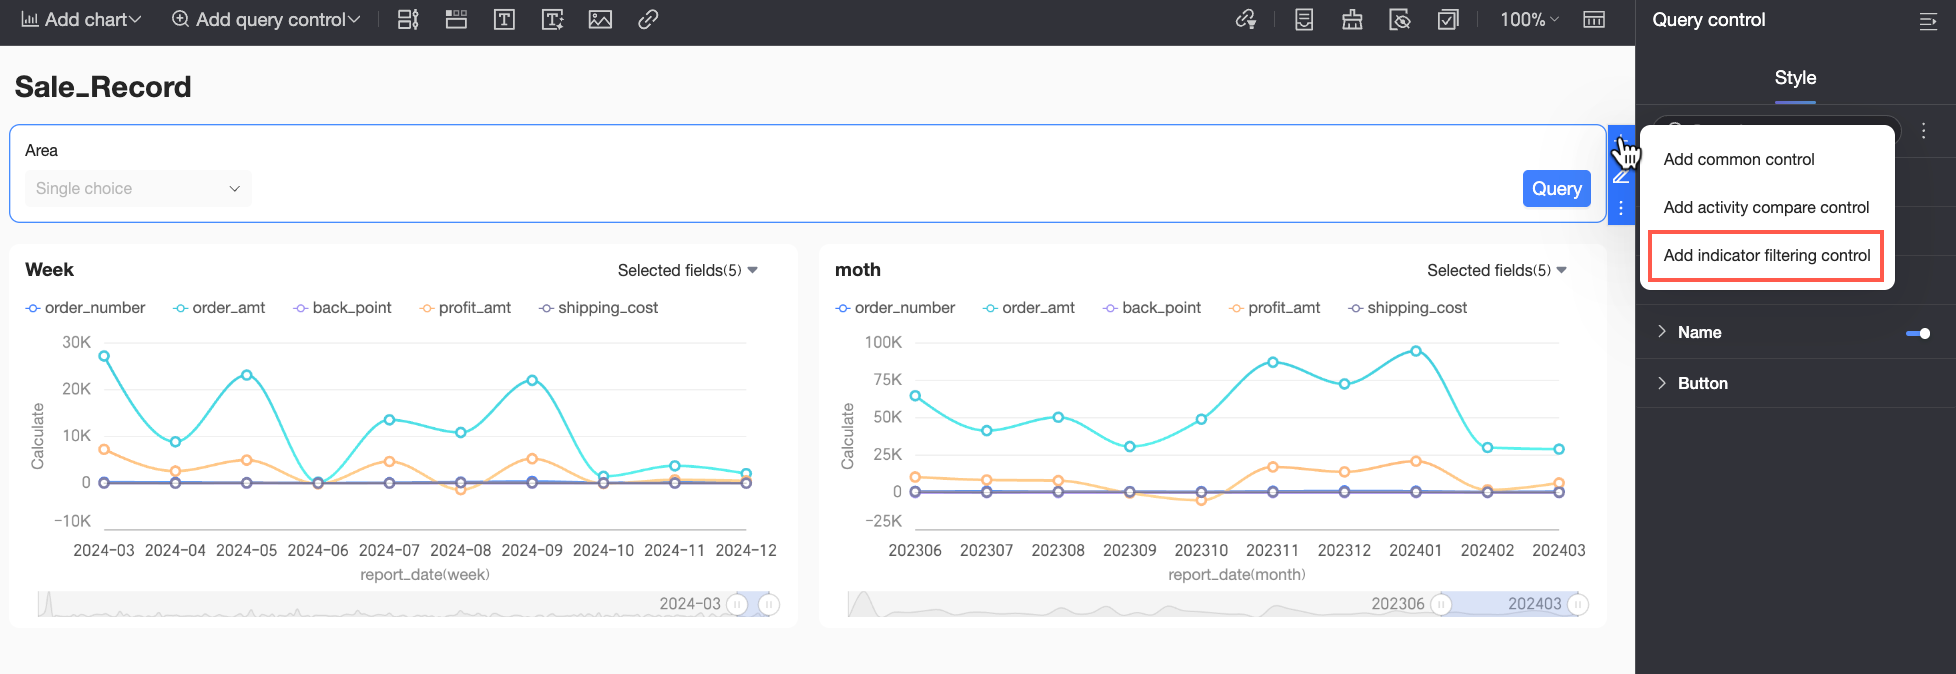
Entry point 2: When the query control is not empty
Hover over the ![]() icon on the right side of the query control and click Add Metric Filter Control in the drop-down list to open the configuration dialog box.
icon on the right side of the query control and click Add Metric Filter Control in the drop-down list to open the configuration dialog box.
Steps
The following example uses the scenario in Use Cases to demonstrate how to configure a metric filter control.
-
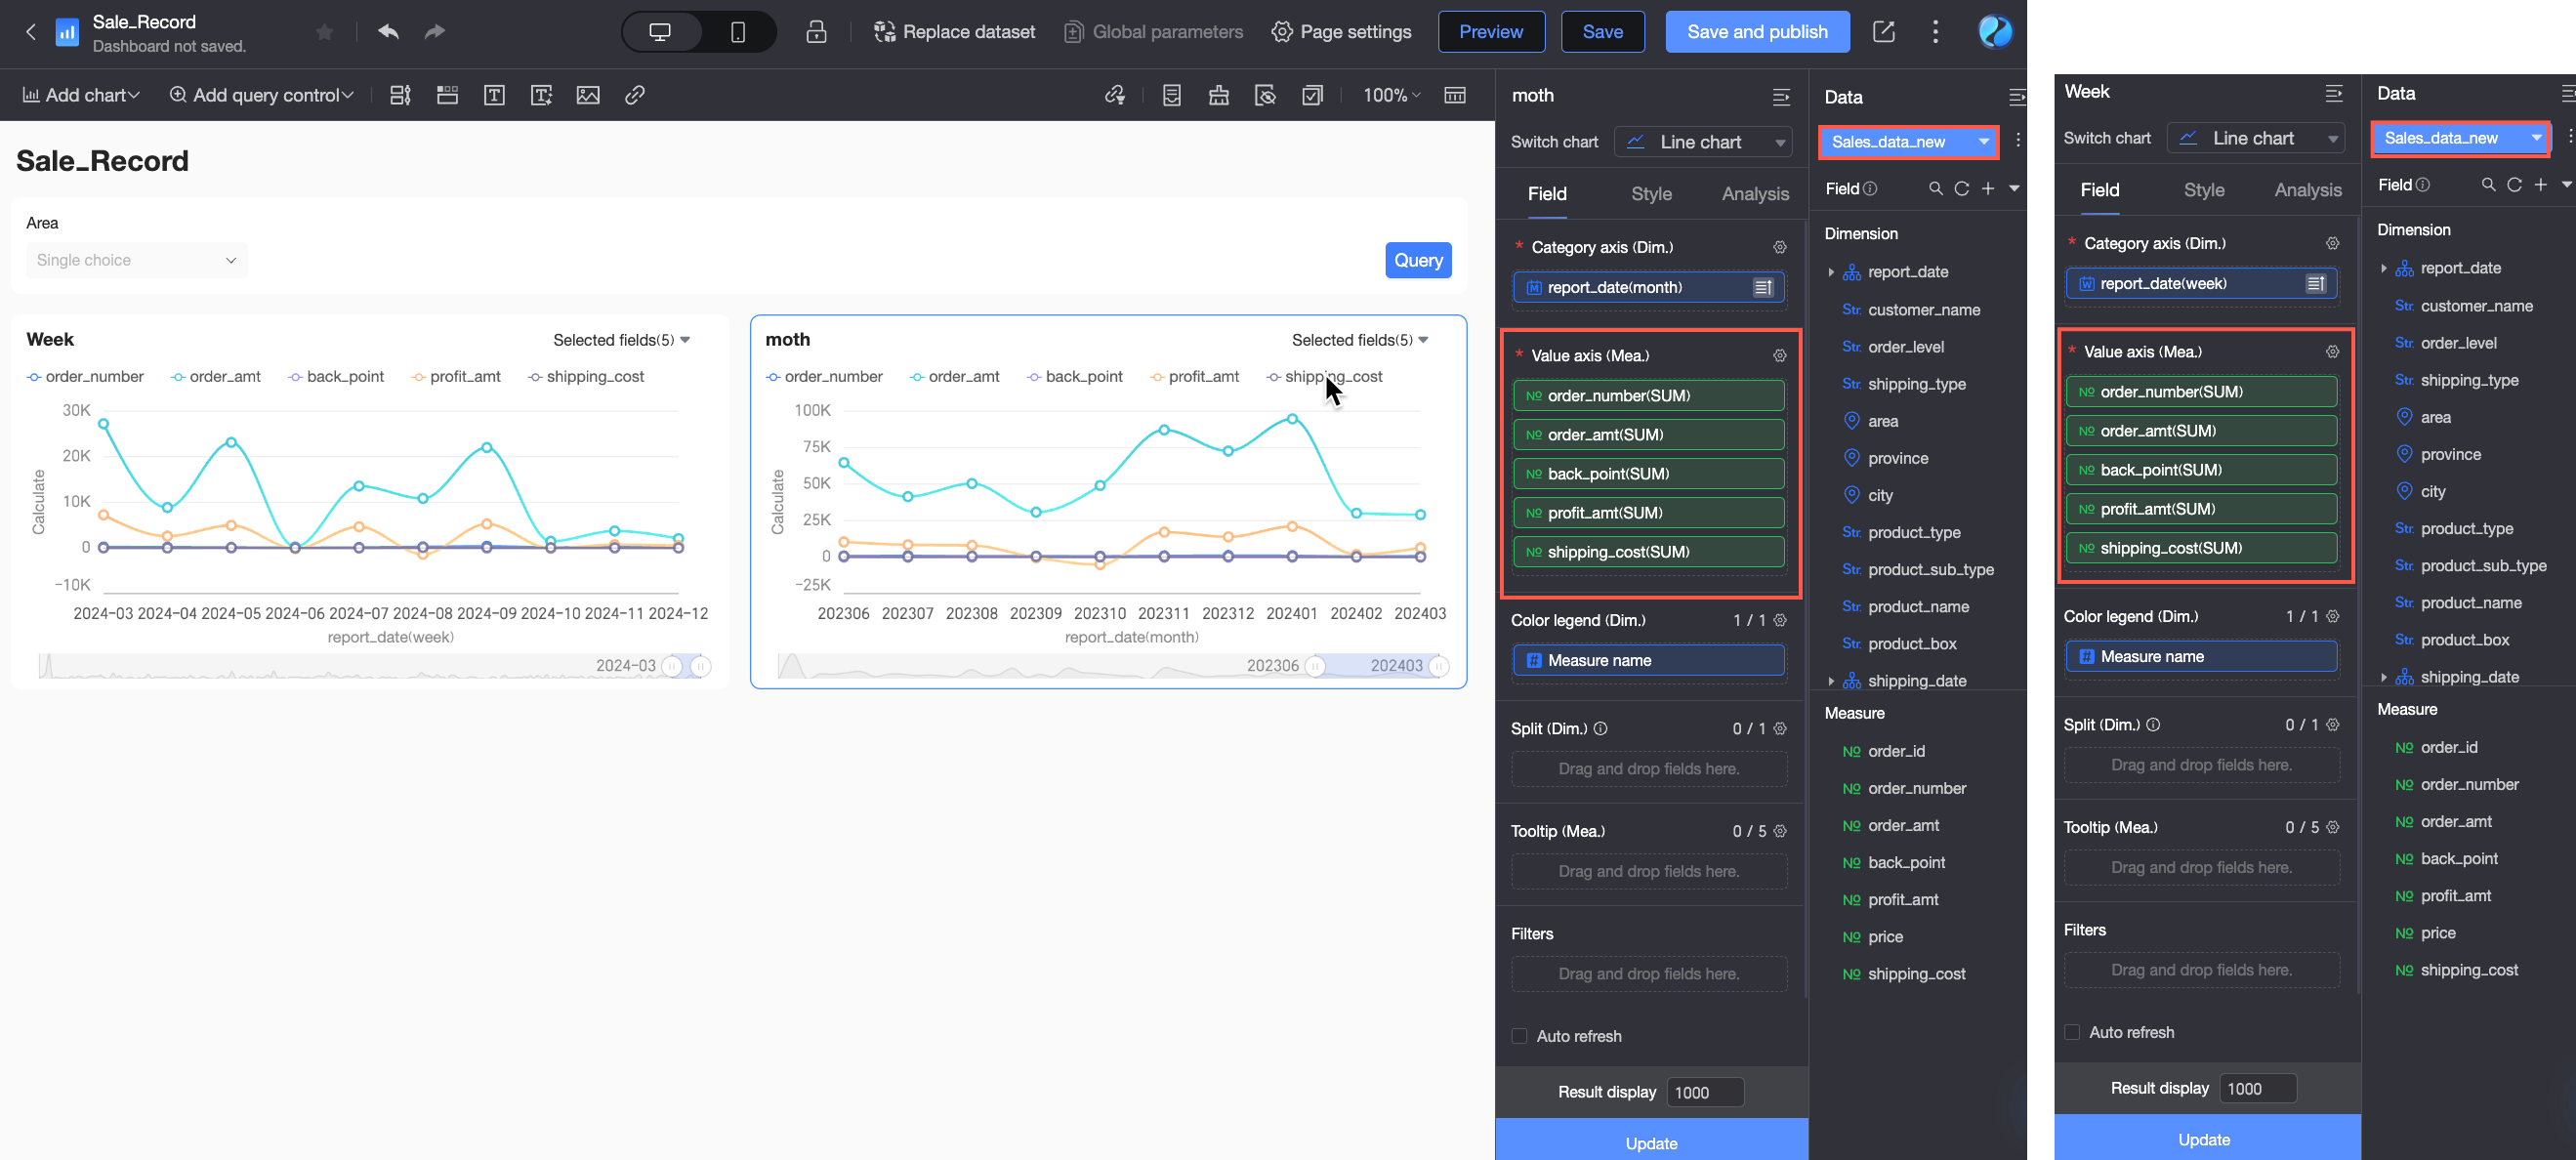
Go to the edit page of the Business Analysis dashboard. This page already contains the charts and an empty query control as shown in the following figure.
Because the "Weekly Trend Chart" and "Monthly Trend Chart" need to be controlled by the same metric filter, you must configure the same dataset for both charts and configure the same measures based on the metric display requirements.
-
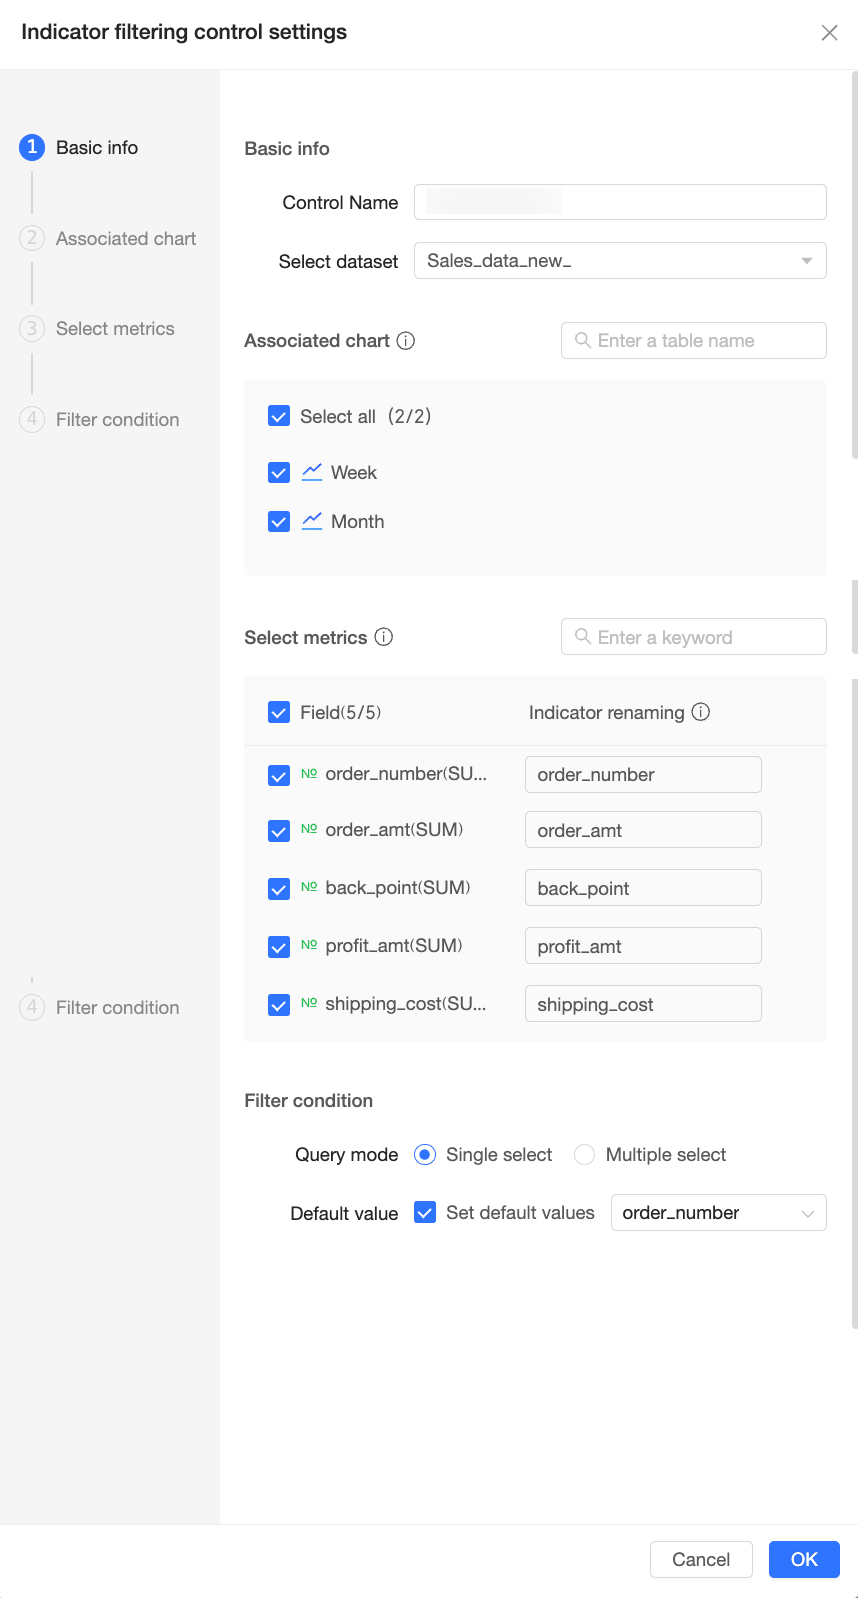
Click Add Metric Filter Control in the empty query control and configure the following settings in the Metric Filter Control Settings dialog box.

Configuration
Description
① Basic information
Control name
Enter a name for the metric filter control. The default value is Custom Control Name. You can customize the name based on its business meaning.
In this example, the metric filter control is used to switch between different business metrics, so it is named Business Metric Filter.
Select dataset
Click the dataset selection box to open a drop-down list that displays all datasets used in the current dashboard. You need to select the dataset used when creating the associated charts to ensure the control works correctly.
In this example, the business metrics configured for the associated charts are all from the company_sales_record dataset, so this dataset is selected.
② Associated charts
After selecting the dataset, the system automatically identifies the charts on the current dashboard that use this dataset, have measure fields configured, and support the metric filter feature.
You need to select the charts that the metric filter control will manage. If there are many charts on your dashboard, you can also enter keywords of the chart name in the search box to quickly locate the target chart.
NoteEnsure that there is an intersection of measure values among the selected charts, otherwise there will be no metrics to configure in the subsequent Select metrics step.
In this example, the metric filter control needs to simultaneously manage the "Weekly Trend Chart" and "Monthly Trend Chart", so both are selected.
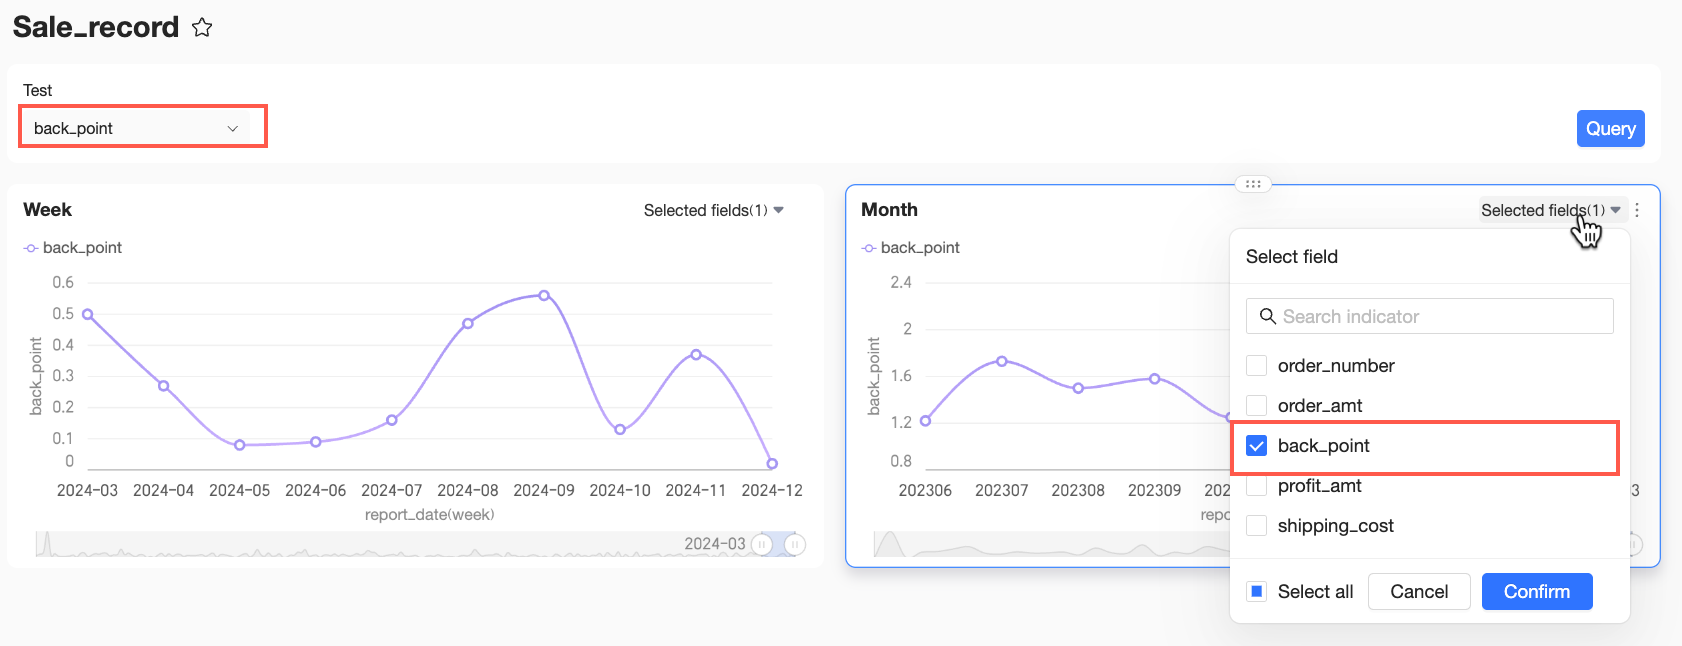
③ Select metrics
After associating the charts, the system generates a list of configurable metrics based on the intersection of the measures in the selected charts. Only intersection measures can be set as filter metrics.
You need to select the metrics you want to display in the control's drop-down list. Report viewers will only be able to choose from these preset metrics. You can also modify the display names of the selected metrics to better align with business language. If there are many metrics, you can also use the search box to quickly find them.
NoteWhen renaming the selected measure fields, ensure that there are no duplicate metric names.
In this example, all business metrics need to be displayed in the metric filter control, so the following are selected: order_quantity, order_amount, discount_point, profit_amount, and shipping_cost. Since the default system-generated metric names clearly and intuitively reflect their business meaning, this example will use them directly.
④ Filter conditions
Query method
Defines the number of metrics a report viewer can select from the control's drop-down list. You can set it to single-select or multi-select.
-
Single-select: Report viewers can only select one metric at a time. The associated charts will then display data for that single metric, focusing on the analysis of one metric.
-
Multi-select: Report viewers can select multiple metrics at the same time. The associated charts will then display data for all selected metrics, allowing for parallel analysis of multiple metrics.
NoteSome charts, such as pie charts, rose charts, and sunburst charts, do not support displaying multiple metrics simultaneously. When a multi-select operation is performed in a metric filter control associated with such a chart, the chart will display data based on the first metric selected.
In this example, each business metric needs to be analyzed individually, so single-select is chosen.
Default
Sets the default metric selected in the metric filter control when the dashboard is first loaded or refreshed. The associated charts will display data based on the default value, ensuring that report viewers first see the most relevant or frequently used metric data when they open the dashboard.
Select Set default filter value to enable this feature. You then need to specify the default value in the metric list to its right.
NoteWhen the query method is single-select, only one default value can be selected. When the query method is multi-select, multiple default values can be selected.
In this example, order_amount is the key analysis metric, so it is set as the default value.
-
-
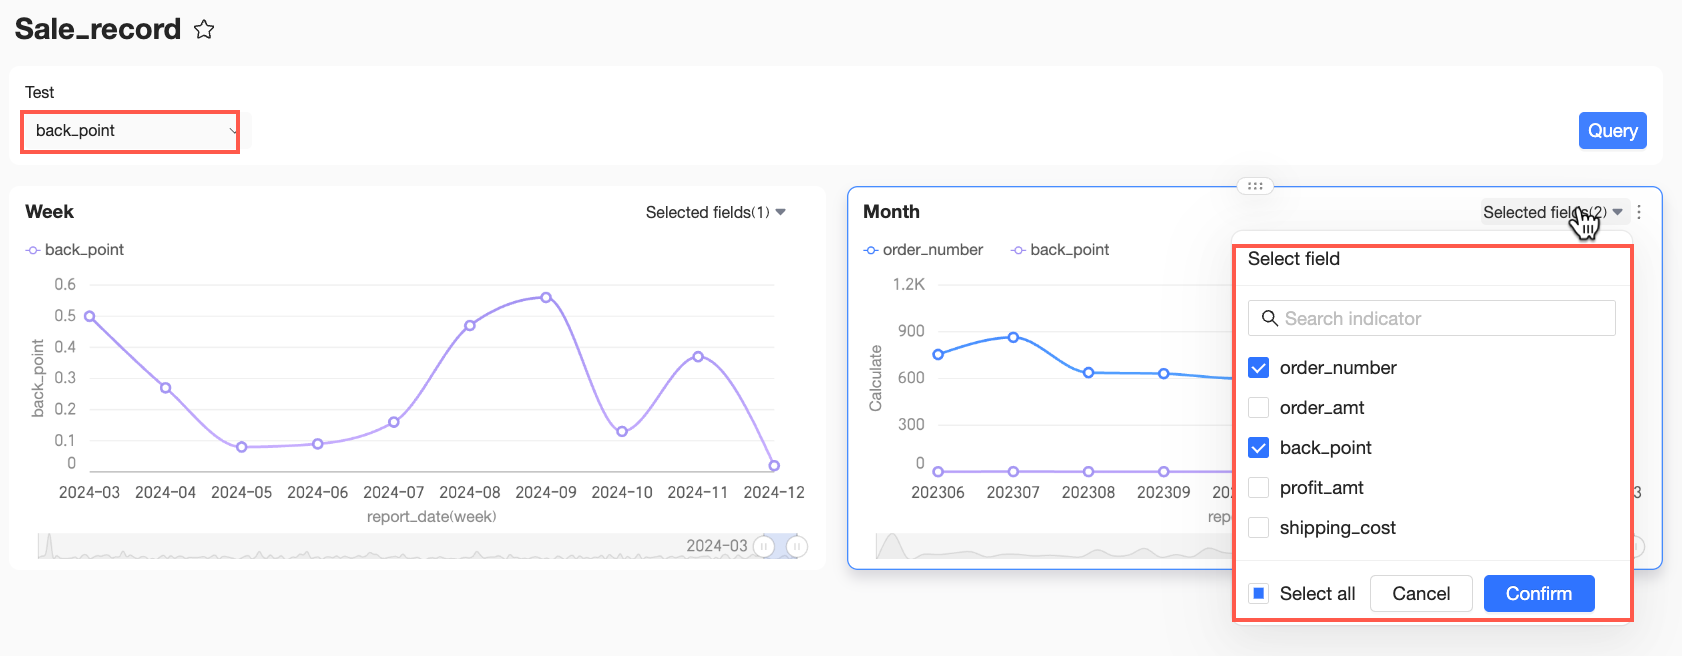
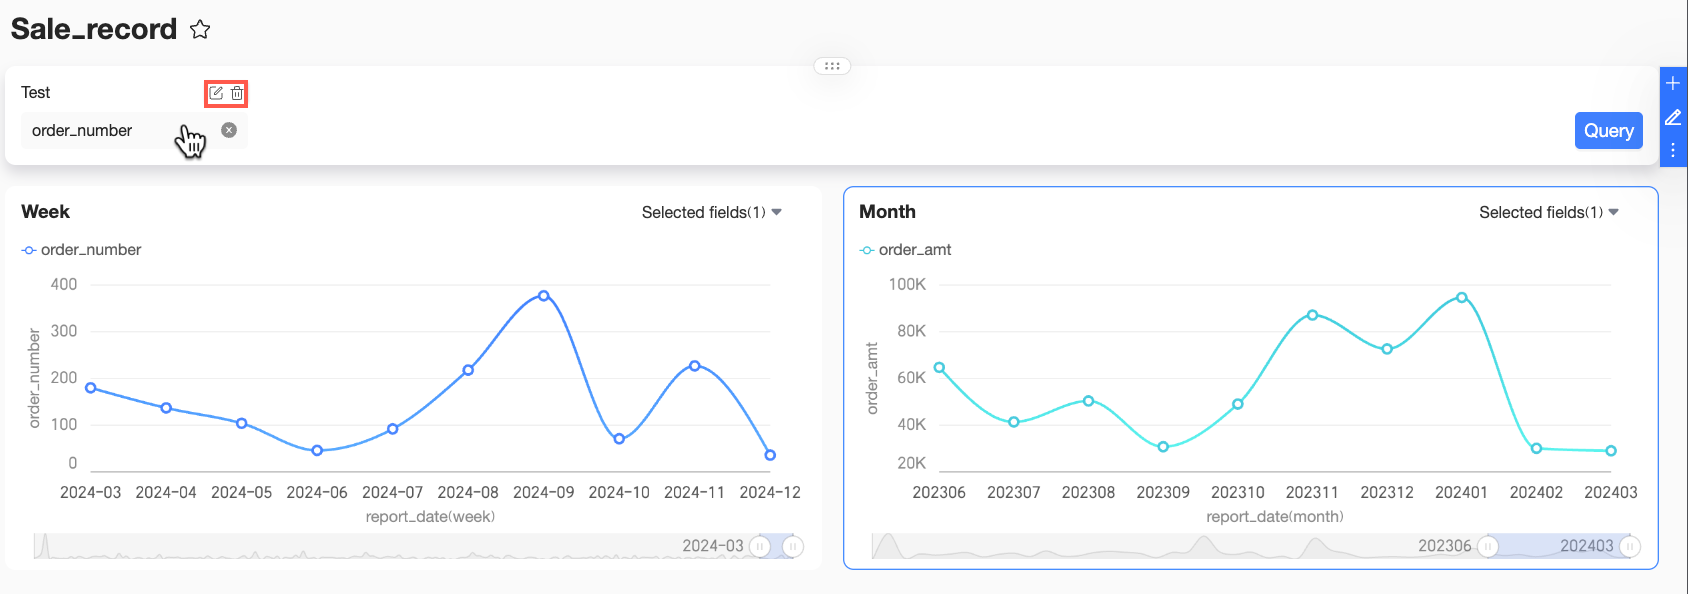
After configuration, click OK to create the control. The final effect is shown below.
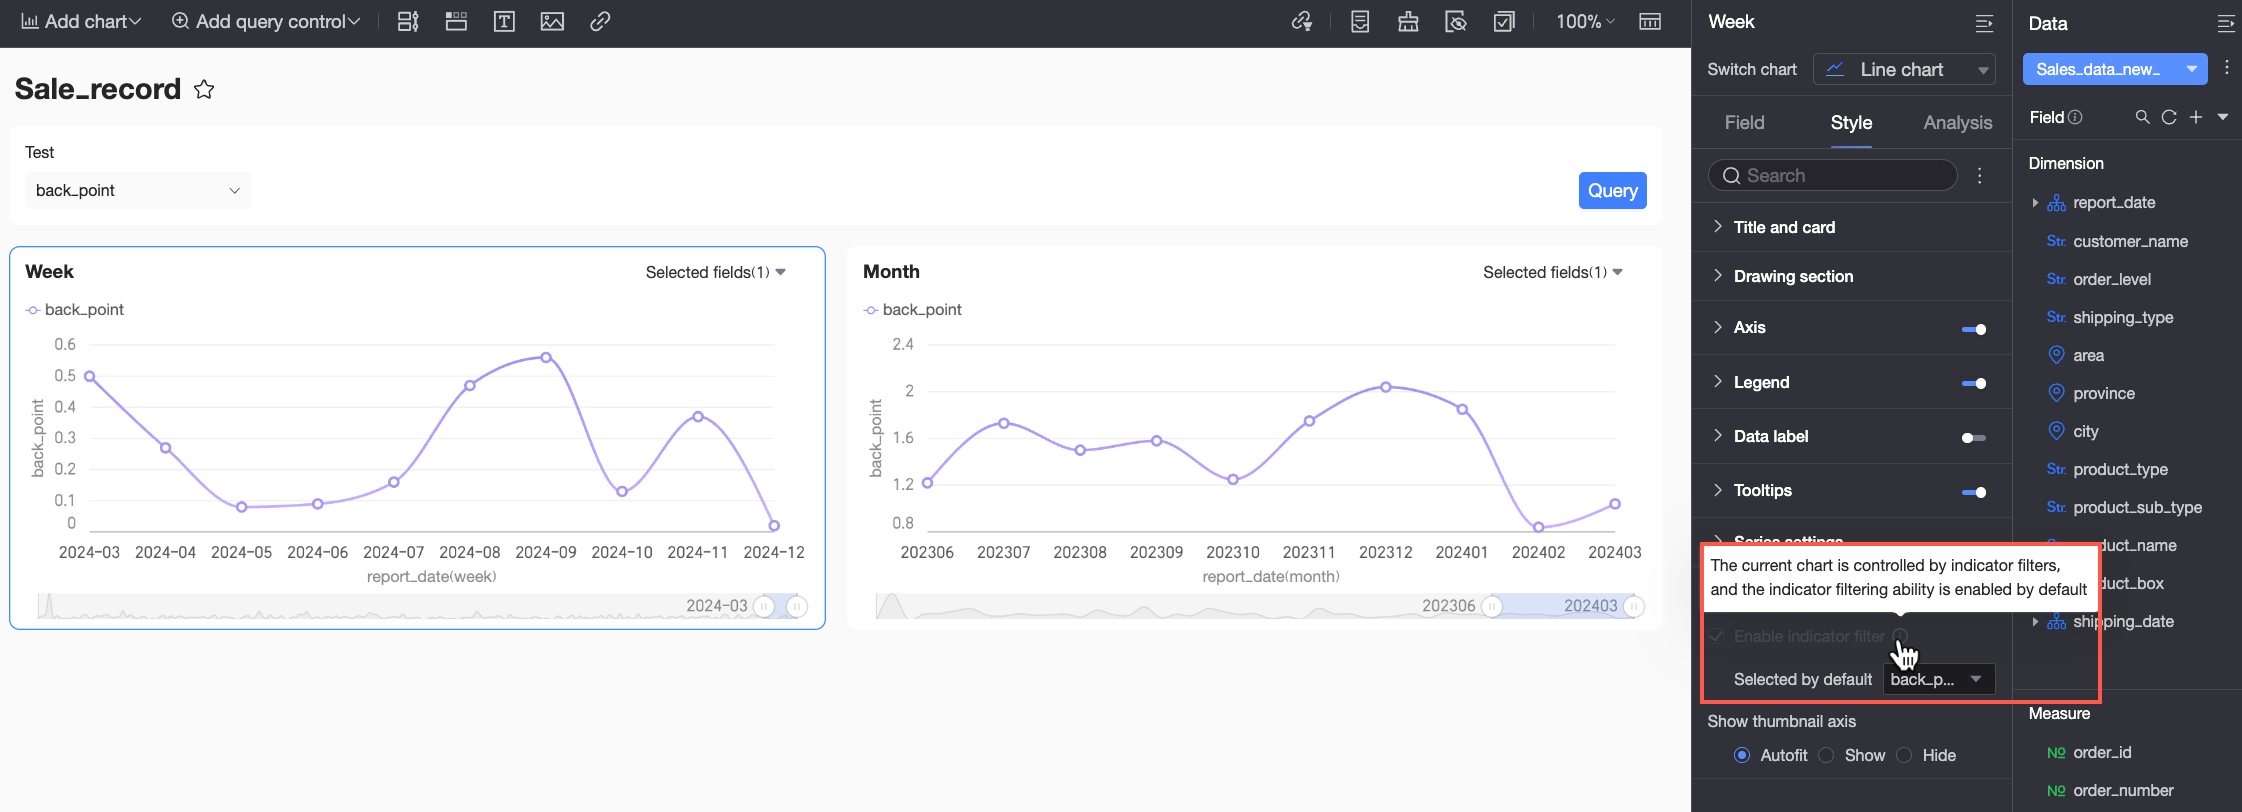
Note-
There are two types of metric filter controls on a dashboard: the global metric filter control described in this article, which is configured through the query control entry point, and the in-chart metric filter control, configured in the chart's style panel. When a chart is associated with a global metric filter control, the in-chart filter is automatically enabled and cannot be deselected.
-
A single chart can be associated with multiple metric filter controls, but their logic follows an override principle: the new filter condition overrides the old one. A chart is only affected by one metric filter control at a time.
-
When a metric is selected in the global metric filter control, the in-chart filter control also syncs with the global filter's condition.
-
After you have filtered the data of associated charts with a global metric filter control, if you want to further analyze a specific chart individually, you can set a filter condition in that chart's upper-right metric filter control. This in-chart filtering does not affect the global metric filter.
-
Note: The metric filter for some charts (e.g., pie, rose, and sunburst charts) only supports single-select. If the global metric filter control is set to Multi-select, the system will only use the first metric from the global selection as the chart's display value. The chart will only show one metric, and the others will not be displayed.
-
-
(Optional) After creating the filter control, you can hover over it to perform the following management actions as needed.
-
Edit: To modify a setting of the metric filter control, click the
icon to open the settings page for editing. -
Delete: To remove the metric filter control, click the
icon to delete it.
-

 icon to open the settings page for editing.
 icon to delete it.