Selection
Selection lets you select multiple data points and cells at once for interactive analysis, including Show Only, Exclude, Annotate, Filter Interaction, and Drill Down. You can drill down on a selected area to change the analysis granularity, or use Filter Interaction to link related charts across a dashboard.
Limitations
Only the following charts support selection:
-
Trend charts: line chart, area chart, stacked area chart, 100% stacked area chart, and combo chart
-
Comparison charts: column chart, stacked column chart, 100% stacked column chart, bar chart, stacked bar chart, 100% stacked bar chart, and leaderboard chart
-
Relationship charts: scatter chart and bubble chart
-
Distribution charts: word cloud and treemap
-
Detail charts (support only Show Only, Exclude, and Copy): pivot table and detail table
Selection operations
-
You can perform the following operations on multiple dimension values at once:
-
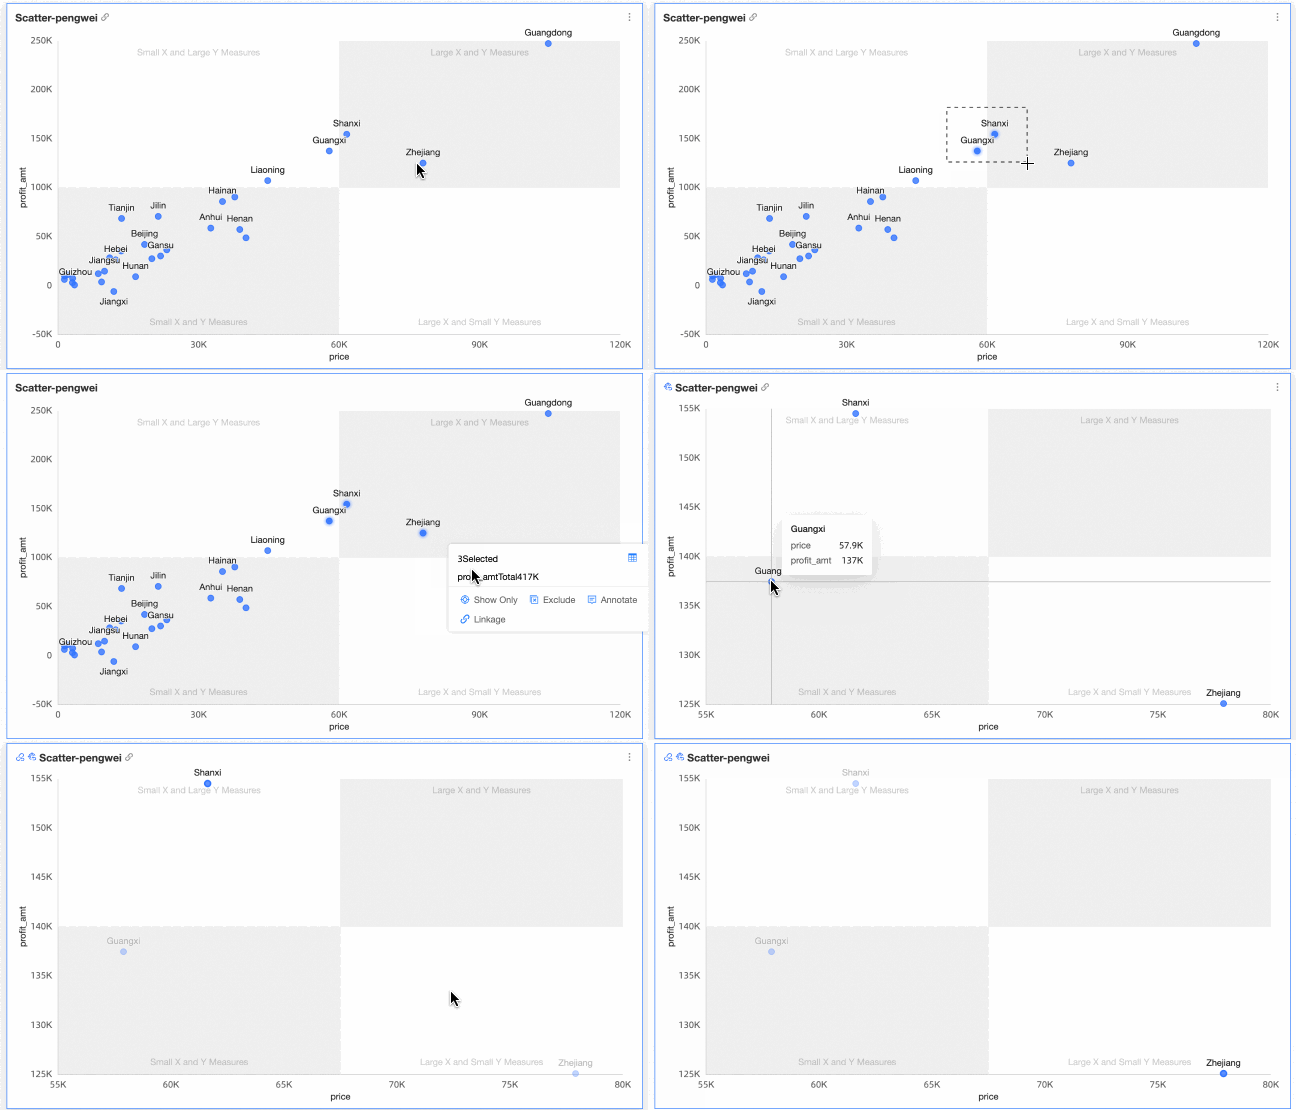
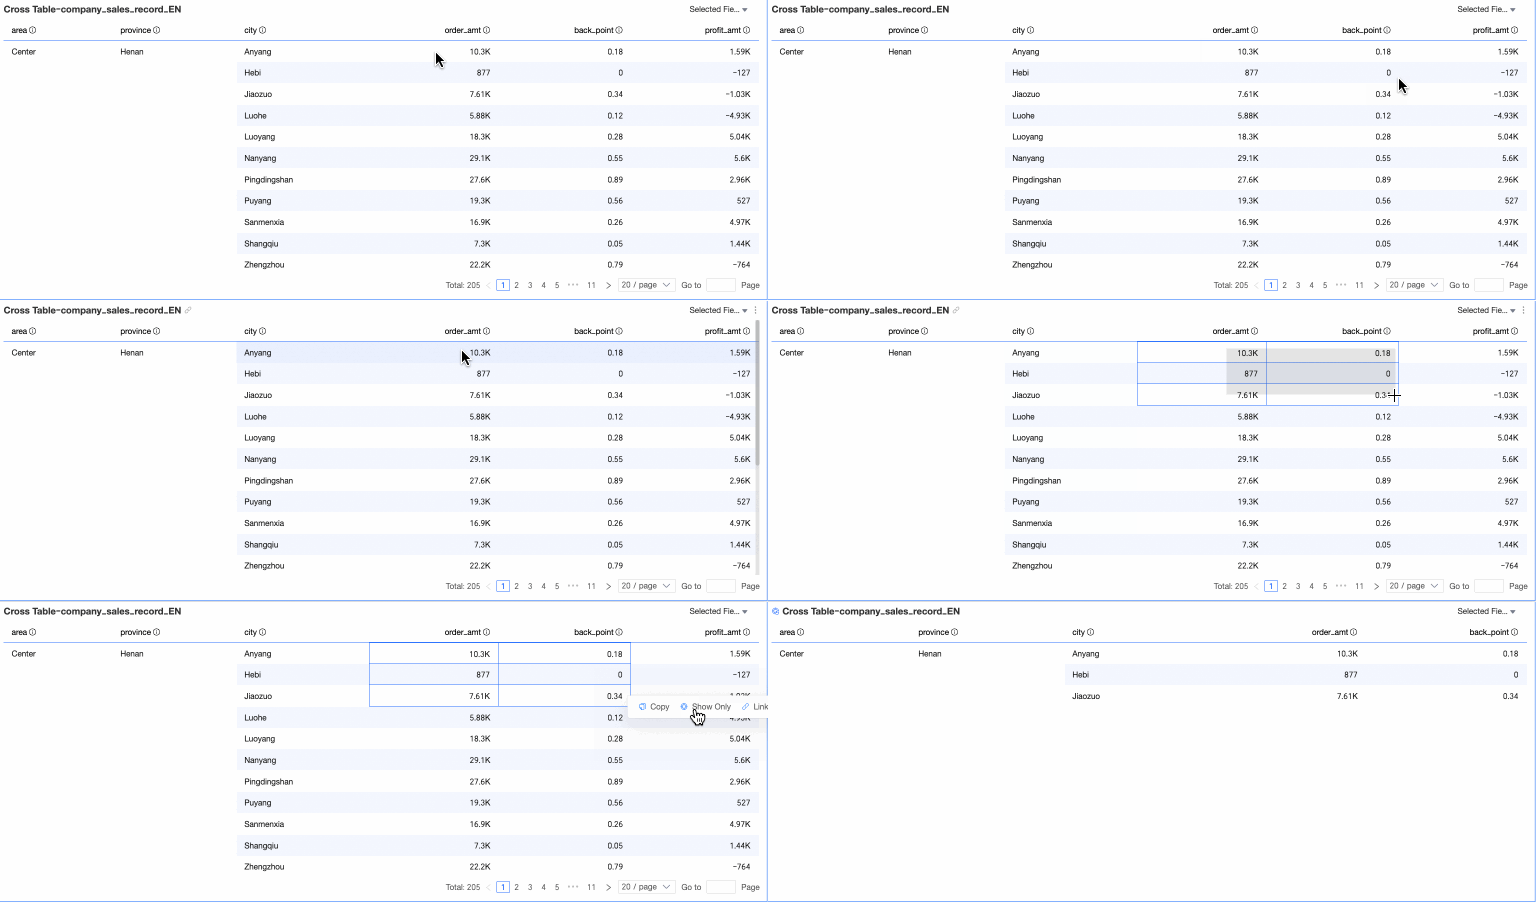
Show Only: Display only the selected data points.
-
Example: scatter chart
-
Example: pivot table
-
-
-
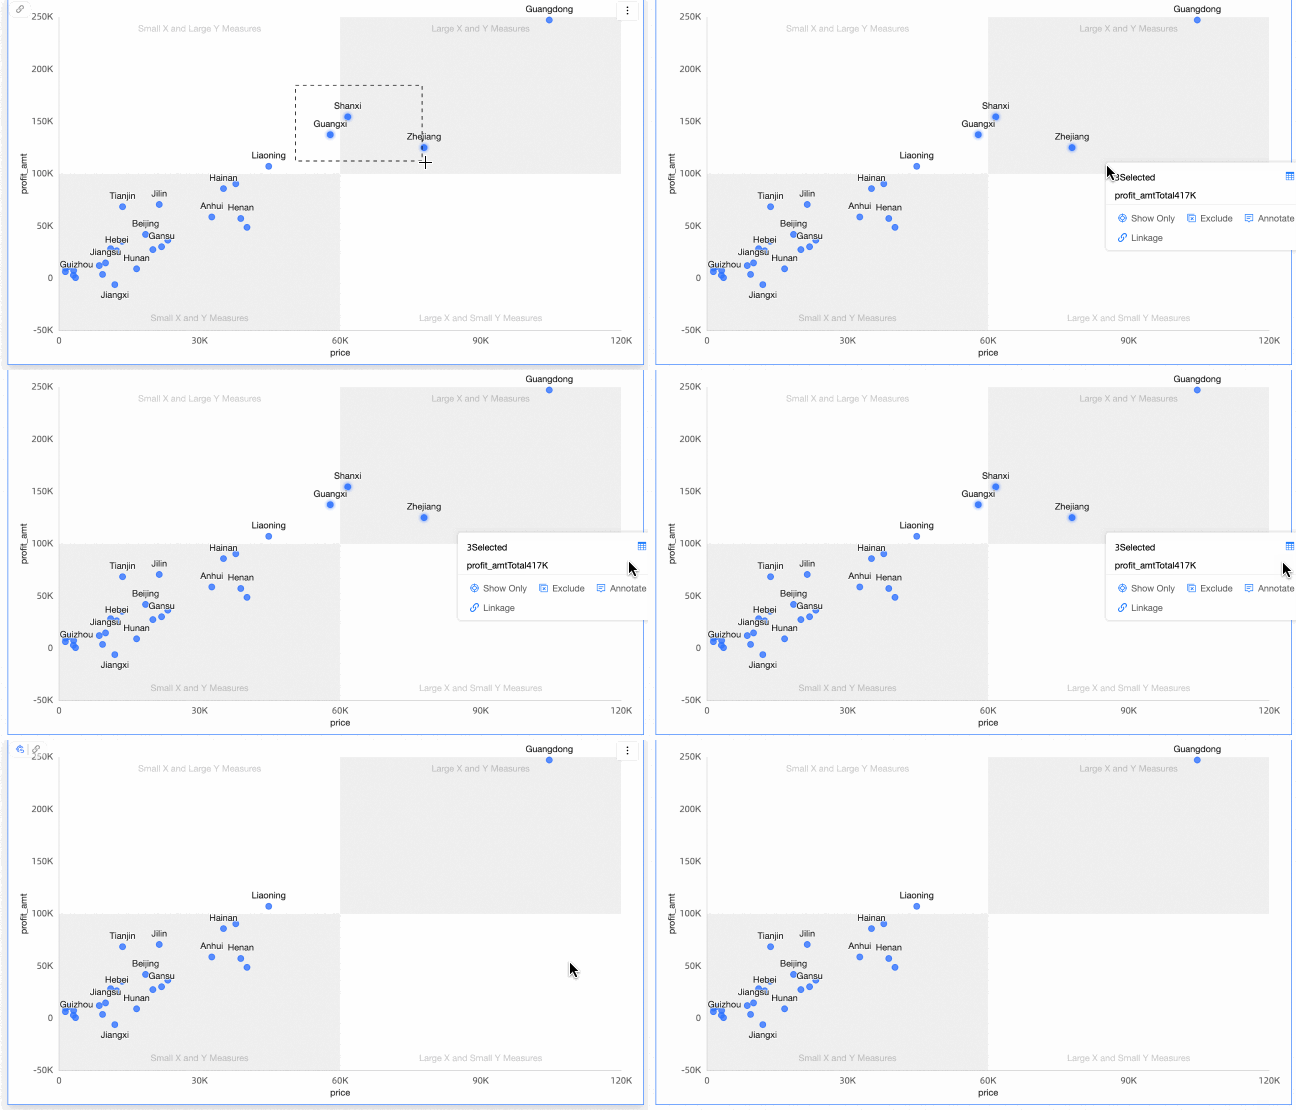
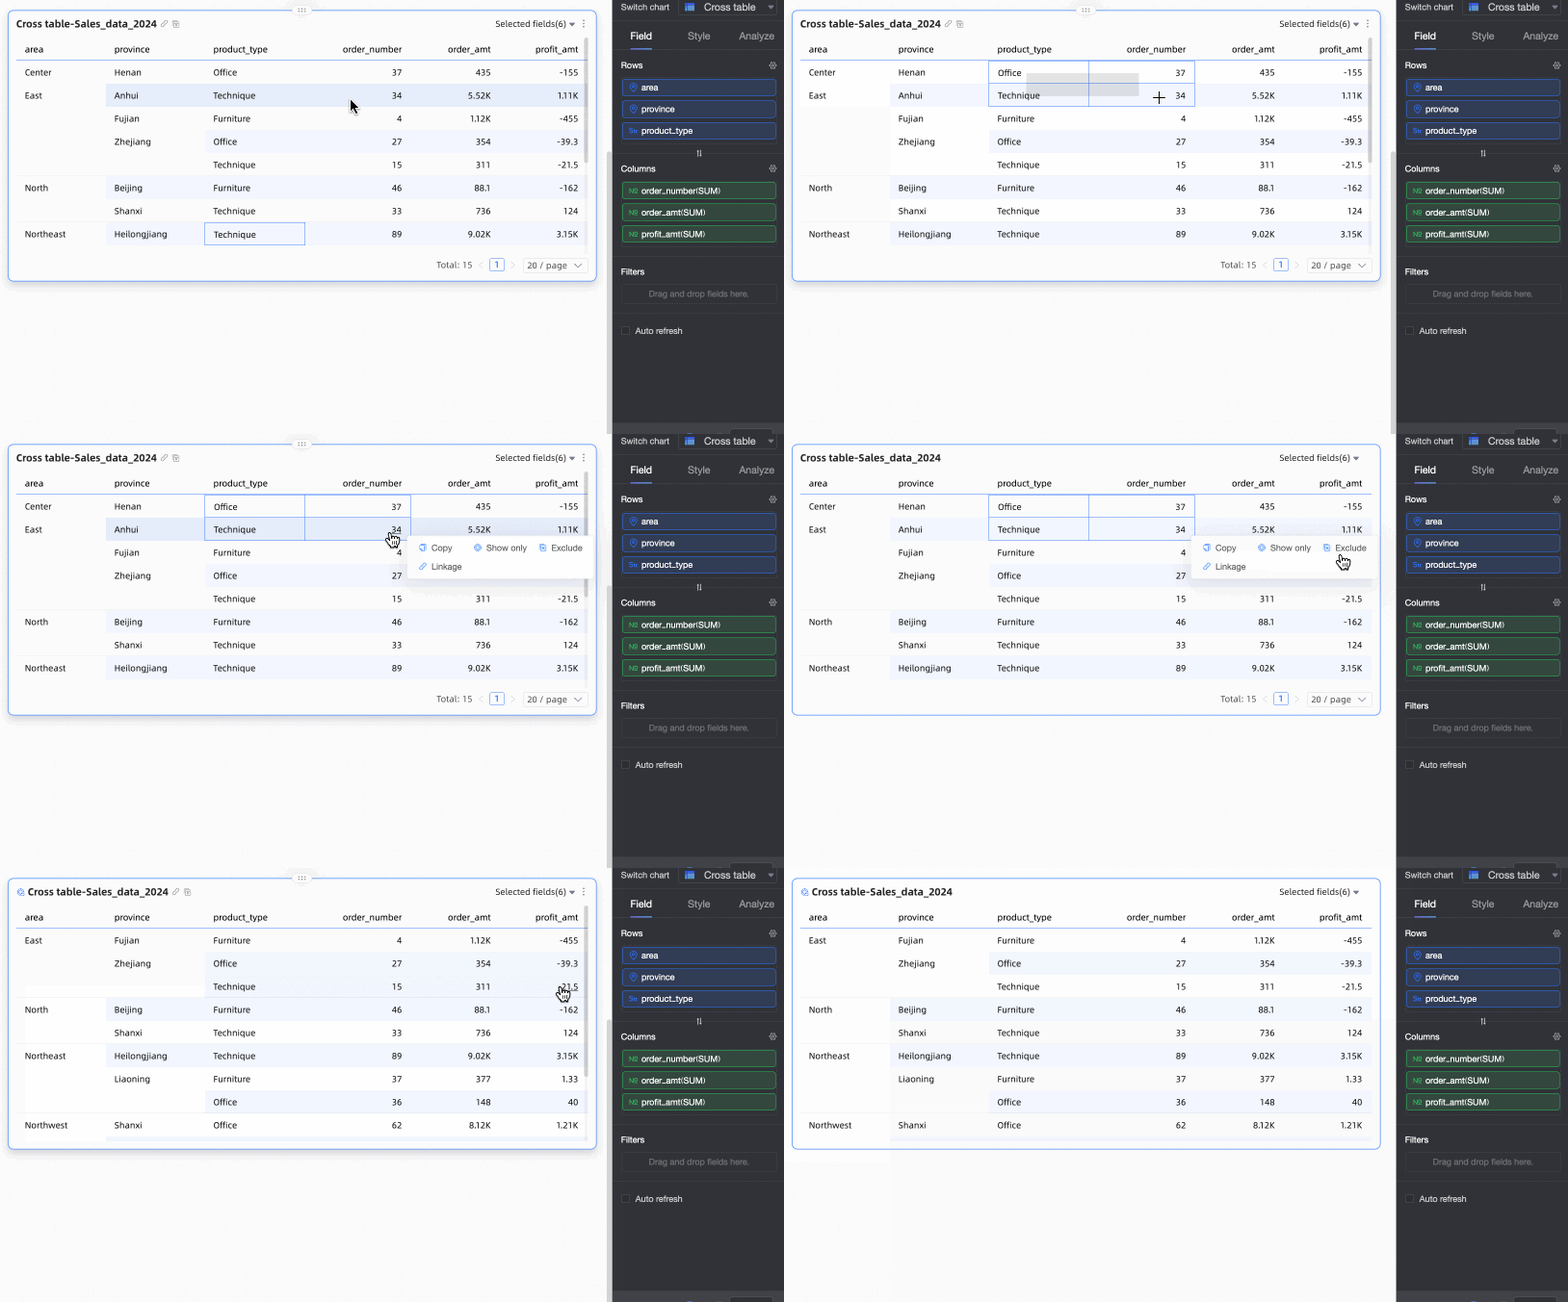
Exclude: Remove selected data points, such as outliers or noise.
-
Example: scatter chart
-
Example: pivot table
-
-
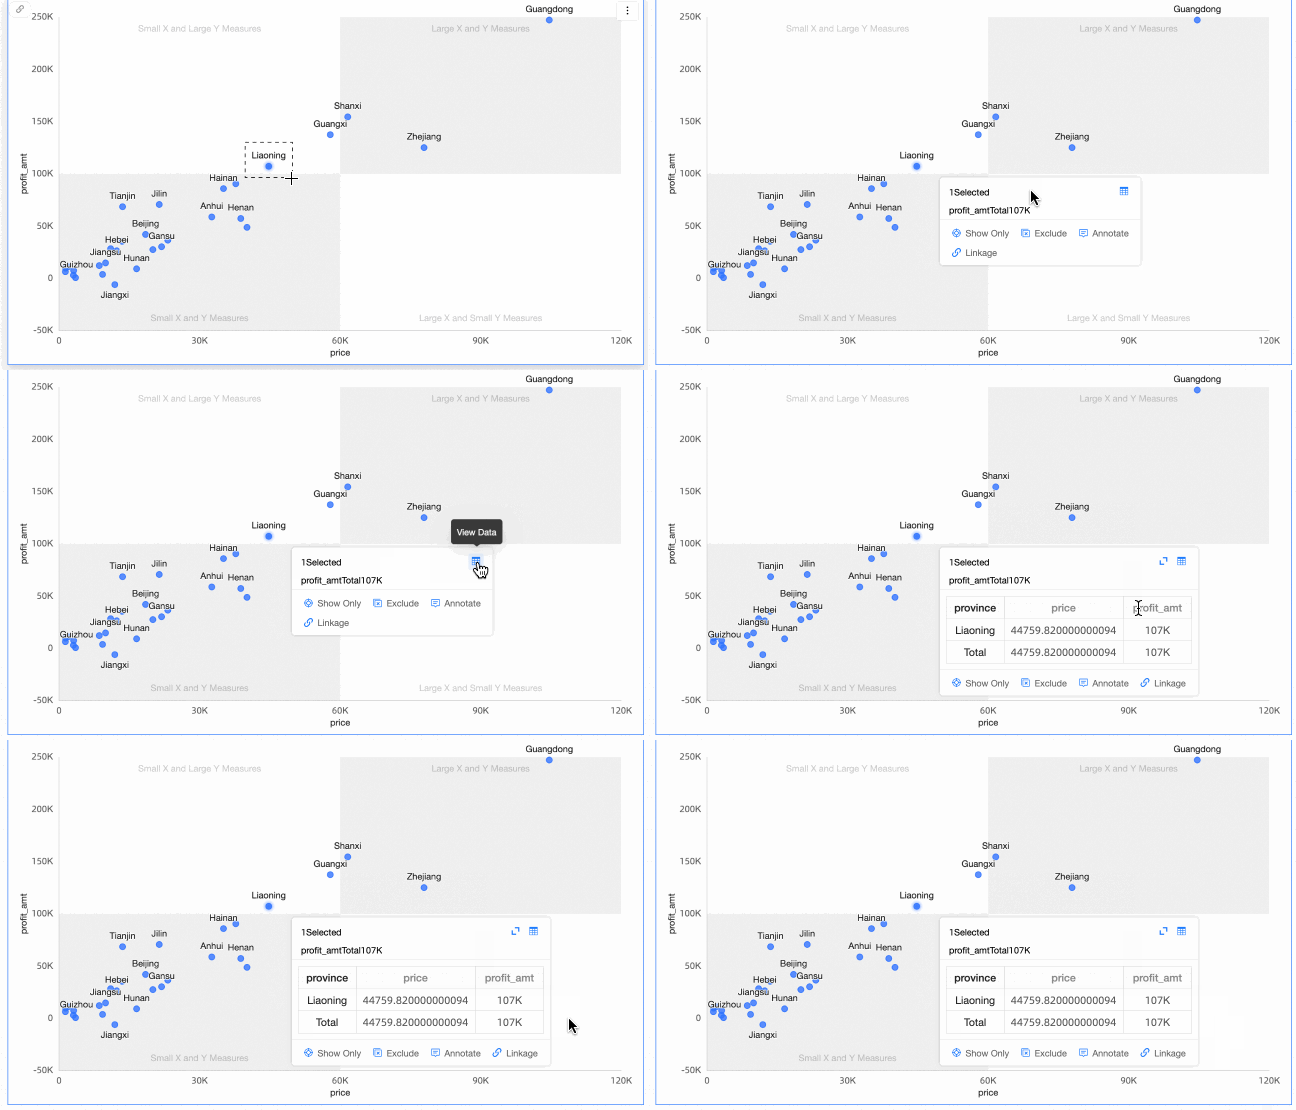
View Data: View the detailed data for a selected area.
-
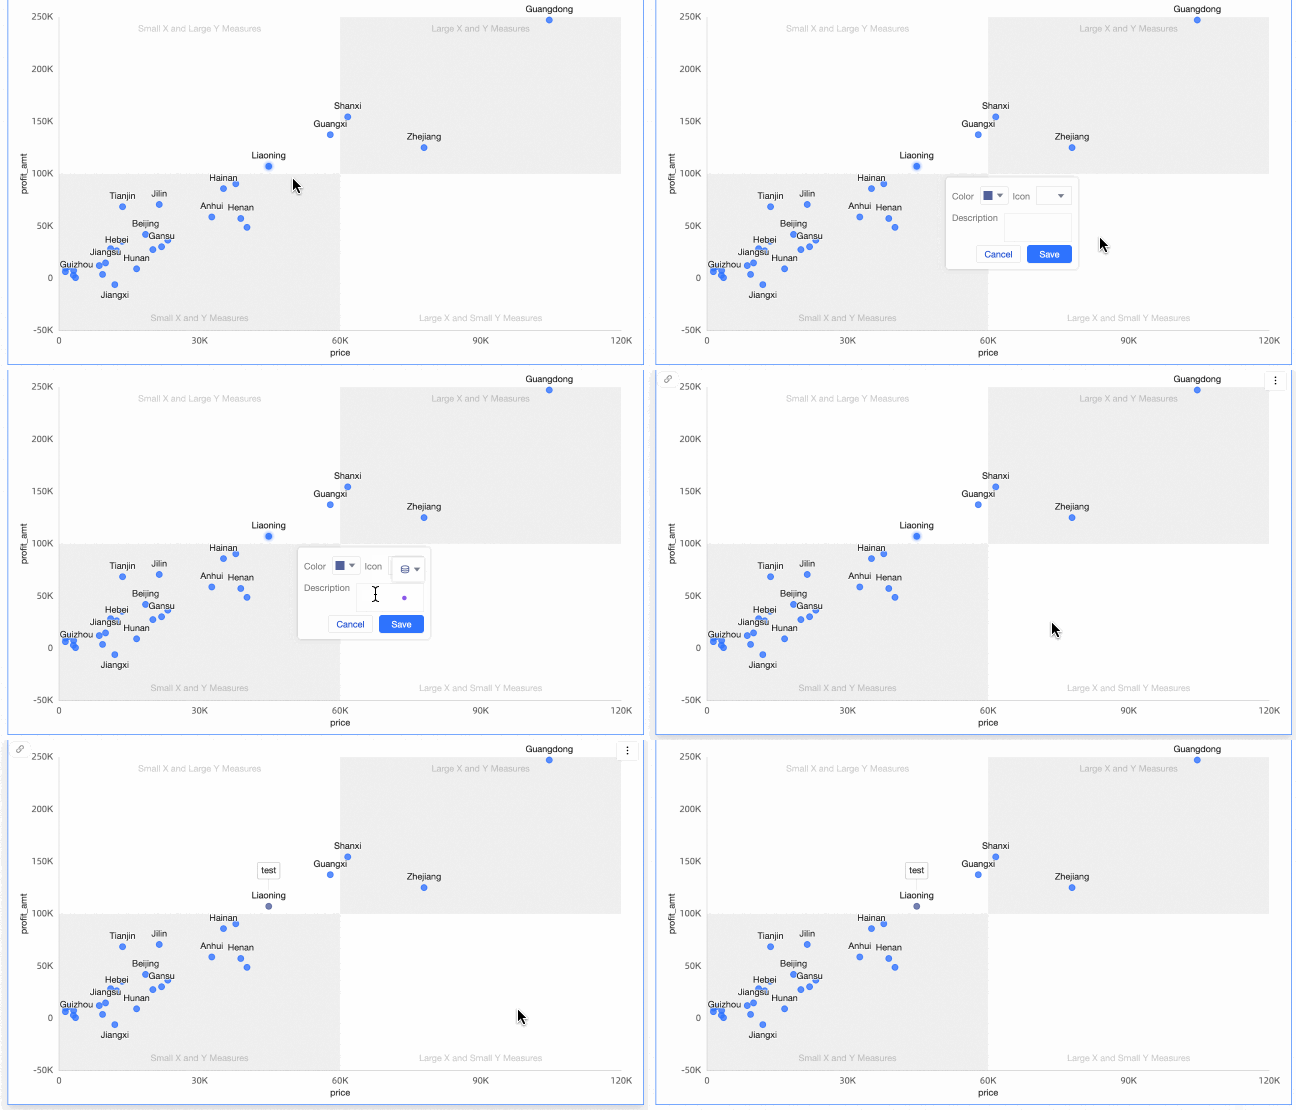
Annotate: Add an annotation to a selected location. For more information, see Annotate.
 Note
NoteAnnotations are supported only for the following charts:
-
Trend charts: line chart, area chart, stacked area chart, 100% stacked area chart, and combo chart
-
Comparison charts: column chart, stacked column chart, 100% stacked column chart, bar chart, stacked bar chart, 100% stacked bar chart, and leaderboard chart
-
Relationship charts: scatter chart and bubble chart
-
Geospatial charts: choropleth map and bubble map
-
Distribution charts: word cloud and treemap
-
-
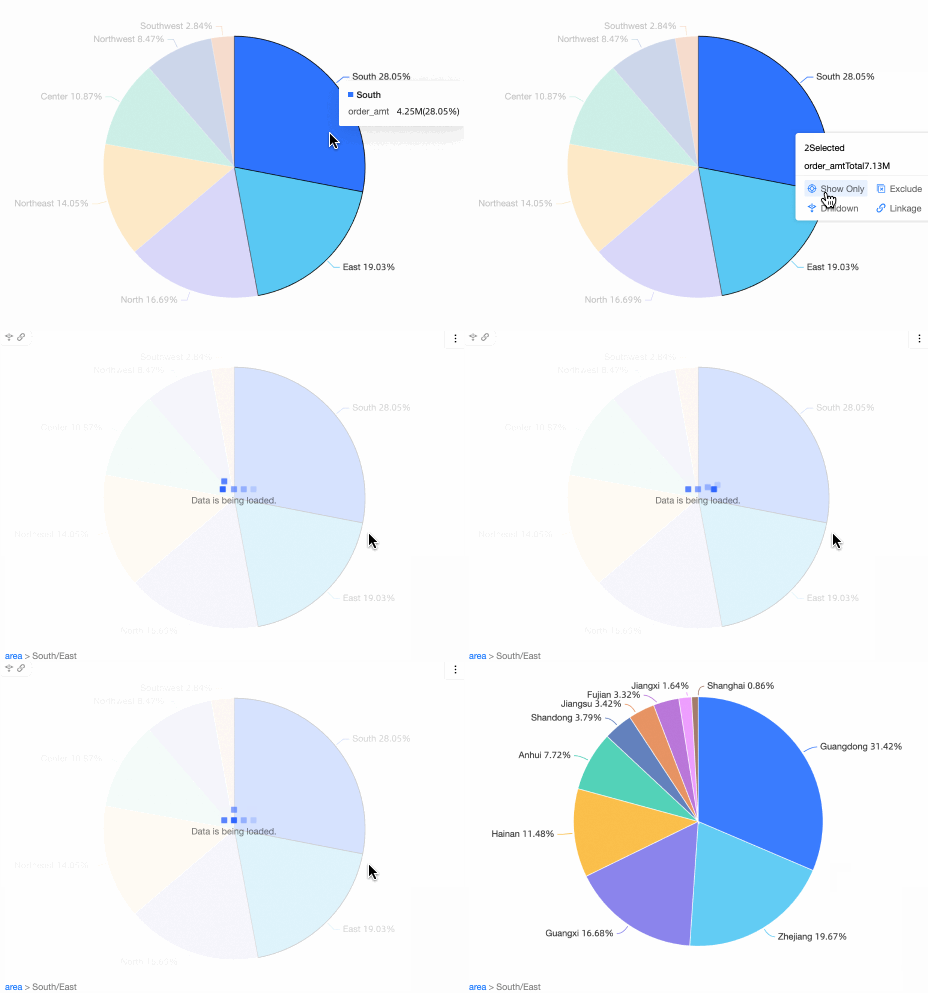
Use Drill Down on a selection of multiple dimension values to view data at deeper levels of the hierarchy.
For an example of configuring drill down on a pie chart with the Sales Data dataset, see Drill Down.
-
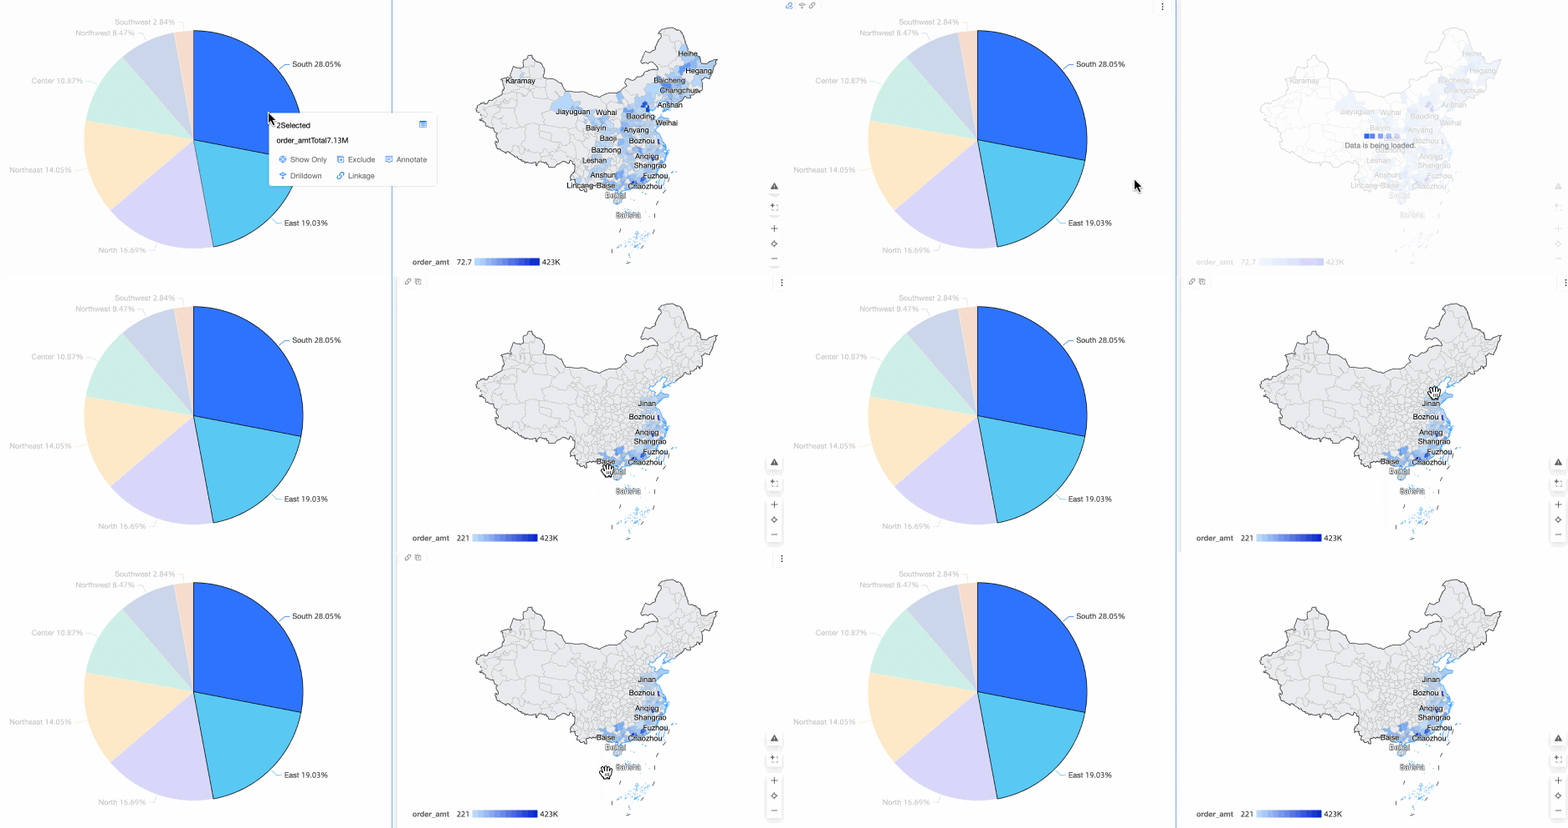
Use Filter Interaction to apply a selection of multiple dimension values as a filter to other charts.
For an example of configuring Filter Interaction between a pie chart and a choropleth map with the Sales Data dataset, see Filter Interaction.
-
Use the hyperlink feature to pass a selection of multiple dimension values to another dashboard.
For an example of configuring a hyperlink from the Company Overview dashboard to the Order Profit Details dashboard with the Sales Data dataset, see Hyperlink.