This topic answers frequently asked questions about dashboards.
Drill down
Can I perform a batch drill down?
No, this feature is not supported.
Enable drill-down for a field
After you enable the drill down feature, drag the dimension fields for your drill down path into the data panel in the desired order.
Dynamic drill-down with third-party embedding
No, you cannot dynamically configure the drill down columns. The drill down dimensions are fixed.
Set alias for next drill-down level
You can set the field name in the dataset.
Linkage
Link two charts
Yes. For more information, see Linkage.
Linkage not working for all charts
The linkage feature is not supported for charts with mixed row and column layouts or when rows and columns are combined.
Meaning of the dimension association message
When linking charts from different data sources, you must associate their corresponding fields.
Set up linkage without dimensions
No, you cannot set up a linkage without a dimension. As a workaround, you can add any dimension to the filter.
Create events on a dashboard
Yes. This is done using the linkage feature. For more information, see Linkage.
Is three-level linkage supported?
No, this feature is not supported.
Jump
Configure global parameters for jump
In a group workspace, you must save your dashboard settings before you can configure global parameters.
On the top menu bar of the dashboard or spreadsheet editing page, configure global parameters.
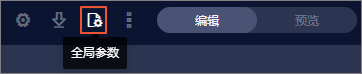
On the dashboard editing page, click the
 icon on the top menu bar, then configure global parameters in the page settings.
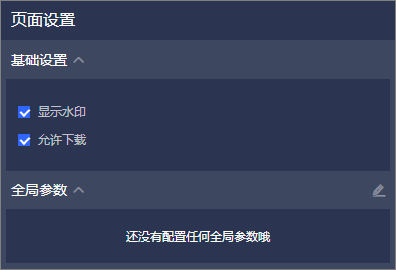
Can query conditions accept external parameters?
No, this feature is not supported.
Can I jump between dashboards?
Yes. For more information, see Jump.
Data visualization and analysis
Map values for a dimension
Scenario: For example, if my source data is 1 and 2, can I display 1 as "Male" and 2 as "Female"?
Yes. You can create a calculated field and use a case when statement to do this. For example, use the expression case when type=1 then 'Male' when type=2 then 'Female' end. For more information, see Create a calculated field.
Sort dates in descending order
Yes. In the data panel, you can set the date field to sort in descending order. For more information, see Sort data.
WoW and MoM comparison
When you use a week or month field as the time field, the corresponding period-over-period comparison options become available. For more information, see YoY and MoM comparison.
Can I display the top N results?
Yes. You can use the sort button next to a field to sort your data. Then, set the number of preview rows as needed. For example, to get the top 10 results, sort a measure and set the number of preview rows to 10.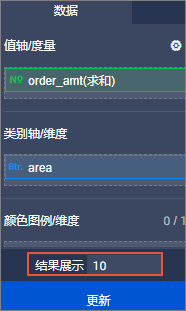
Calculate month difference between dates
Scenario: For example, I want the difference between 2019/8/5 and 2019/7/31 to be 1 month.
You can use the appropriate date function for your database. For example, an ODPS database supports the datediff function. The function you can use depends on your database type.
Display date dimensions in a specific format
To display the full date and time in a single field, convert the field to a string type.
Are row totals supported?
Currently, only column totals are supported. Row totals are not supported.
Are grand totals supported?
Yes. In a crosstab, you can select Show Grand Total for Columns. For more information, see Old crosstab.
Set up period-over-period comparison
Hover over the measure field in the data panel, select YoY and MoM comparison, then choose the desired comparison type. For more information, see YoY and MoM comparison.
Configure YoY and MoM comparison
You can configure a YoY and MoM comparison only if the dataset contains a field of date type.
Cloned date fields show null values
If a date field is converted from a string type, selecting an incorrect format during the conversion in the dataset will cause the data to display as null values. To fix this issue, select the correct format.
"Query execution error" during preview
This can happen if an expression for a calculated field references another calculated field. Calculated field expressions can only reference original fields from the database. Instead of referencing another calculated field, reuse its expression directly.
Customize date format without string conversion
No. Fields of date type are always displayed in the yyyymmdd format. You cannot change the display format.
Reference dimension values in calculated fields
You cannot reference date type fields in a calculated field expression.
Operate on date dimensions in expressions
No. You cannot directly reference a date type field in an expression. First, convert the date field to a string type.
Convert string to date format in a calculated field
Yes. In the dataset, you can right-click a field and convert it directly to a date format.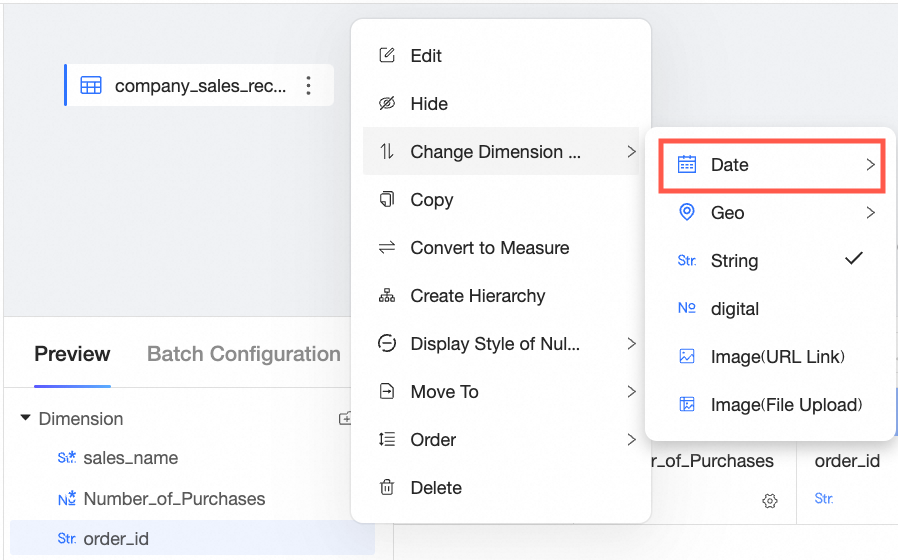
Convert timestamp to time format
For more information, see How do I convert a UNIX timestamp field to a standard date and time field?
PoP metric not displayed with SQL parameters
Scenario: After I pass parameters in an ad hoc analysis SQL query to select data from the last 7 days, the week-over-week comparison is not displayed.
The WHERE clause in your query restricts the data to the last 7 days. Since no data from the previous period is available for comparison, the week-over-week metric cannot be displayed.
Calculate YoY and MoM on total data
No.
Set time range parameter in SQL queries
No, you only need to set one parameter. You can then specify a time range for that parameter in the query control.
Color indicators for actual vs. target
Yes, you can achieve this by creating a calculated field in the dataset. Use a case when statement, such as case when target_value > actual_value then 0 else 1 end. Then, in your crosstab, include the target value, actual value, and the new calculated field. Finally, apply conditional formatting to the calculated field.
Set week start day
Yes. Right-click the week field and select Edit. Set the Week Type to Starts on Monday.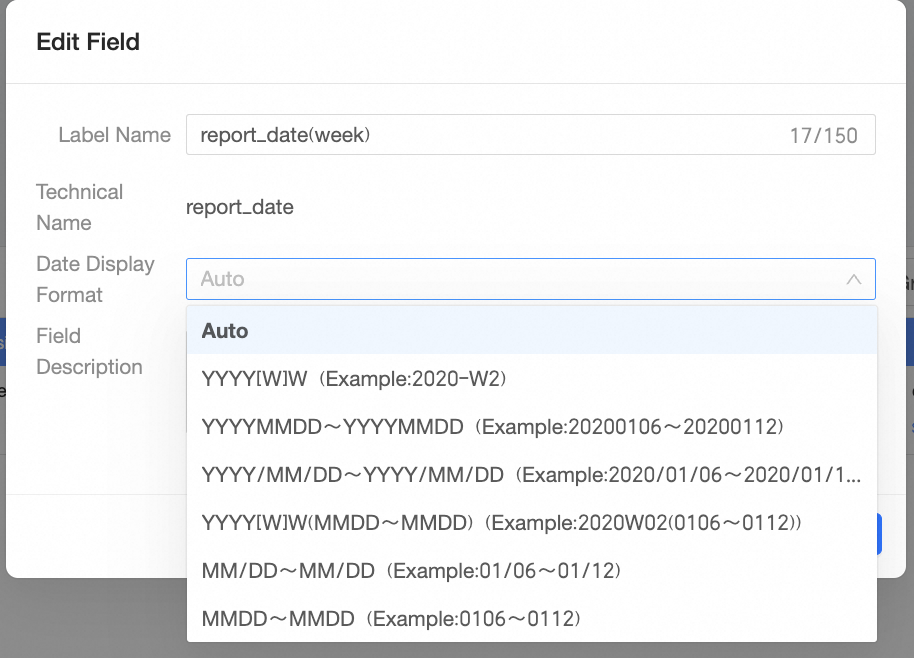
Manually add new enumeration values
Yes.
Convert a time dimension to a measure
You cannot directly convert a time type to a measure. You must first convert it to a string or numeric type, then convert it to a measure.
"Contrast query" error in PoP calculation
When you calculate a YoY and MoM comparison with a query condition, the date dimension in the query condition must match the granularity of the dimension used for the calculation. For example, if you are calculating a week-over-week comparison, the query condition must also use the week field to filter the data.
Group data by age range
If you use the Professional Edition, you can create a grouping field to segment the data into different ranges.
If you use the Personal Edition or Advanced Edition, you can create a calculated field and use a case when statement to assign the age ranges.
For more information, see Create a calculated field.
How do I group results by age range from an AGE field in the source data?
Calculated field error in crosstab
This may be because the calculated field involves a division where the denominator is zero. You can add a filter to exclude the data that causes division by zero.
Date unselectable in query control
This is because a time filter range limit has been set, and October falls outside the maximum query range for a single query. To resolve this, modify the time filter range.
Handle municipalities at the city level
For a municipality, the 'province' and 'city' levels both refer to the municipality itself. The 'district/county' level refers to the specific district or county within it. For example, for Chaoyang District, the province is Beijing, the city is Beijing, and the district is Chaoyang.
Chart shows no data after filtering
Run the generated SQL query directly in your database to check if it returns any data. It is possible that no data matches your selected filter conditions.
Set YoY and MoM for a measure field
To calculate a YoY and MoM comparison, you must first select a date field in the dimensions.
Add a date filter with a calendar picker
In the date filter settings of the query control, select the Relative Time option. This allows you to set a time range relative to the current date, which updates automatically.
Use a field as both dimension and measure
In the dataset, clone the field. Convert one clone to a dimension and the other to a measure. You can then use either the dimension or the measure when building your dashboard.
Count distinct on a string field
Yes. Select the count distinct aggregate function.
Display time in a full format
Only the string type can display the full date and time in a single cell. If you also need to include milliseconds, you must create a new dimension and use a function to truncate the string to the required length.
Reference a calculated field in another
No. An expression for a calculated field cannot reference another calculated field; it can only reference original fields. As a workaround, you can reuse the expression from the other calculated field in your new expression.
Chart shows null values after removing filters
If a chart still shows null values after you have removed all filter and query control constraints, verify that the corresponding data exists in the dataset.
Common errors
Aggregation error in WHERE clause
Problem A chart on the dashboard returns the error: "WHERE clause cannot contain aggregations or window functions".
Cause The dashboard is configured with a composite query control, which does not support filtering by aggregated calculated fields.
Solution
Use a normal query control.
Create the dataset by using custom SQL and include the aggregation logic in the SQL query.
LOD function syntax error in crosstab
Problem Using an LOD function in a crosstab returns a syntax error:
org.postgresql.util.PSQLException: ERROR: syntax error at or near "{" Position: 79Cause The LOD function has an incorrect case format.
Solution Check and correct the format of the LOD function. Ensure that the case is correct.
Refresh error: "Cannot read properties..."
Problem Refreshing a dashboard returns the error:
Uncaught Error: Cannot read properties of undefined (reading 'includes')Cause The data contains positive infinity (+∞) values, which prevents the chart from rendering correctly.
Solution Filter out the positive infinity values from your data.
Percentile aggregation error: "Unsupported type int64"
Problem Selecting the percentile aggregation for a measure field returns the error:
errMsg:[NOX54000004] Datasource executes sql failedCause The original field is of the
int64type, which does not support percentile calculation.Solution Change the data type of the measure field to
float8.
Chart query error: "Decimal math overflow"
Problem A chart query returns the error: "Decimal math overflow".
Cause A decimal overflow error occurred during data conversion. This is often caused by the logic in a calculated field.
Solution Adjust the field length after conversion as indicated by the error message, or submit a ticket to contact database technical support.
Details table error: No aggregations allowed
Problem Refreshing a chart returns the error:
errMsg:Detail queries do not allow aggregations[NOX5300008]Cause A calculated field that contains an aggregate function is used in a details table.
Solution To display aggregated data, use a crosstab.
Dashboard jump error: "AE0130010021 token-bound report mismatch"
Problem A dashboard jump action returns the error:
AE0130010021 The report bound to the token does not match the actual reportCause The secondary jump feature is not supported when accessing a dashboard via a public link.
Solution Use an embedding method that supports data permission control and parameter passing.Collect client-side logs with WebTracking
Chart query error: Field does not exist
Problem A chart query returns the error:
errMsg:Querying a field that does not exist[NOX5200010]Cause A dimension or filter field configured for the chart has been deleted from the dataset.
Solution Check if the deleted field is referenced by other components and remove any invalid fields from filters or field associations.