TopN, also known as a quick filter, selects the top or bottom N records from a dataset based on a numeric value. You can apply this filter to a dimension or a measure to analyze data at different granularities and support decision-making.
Prerequisites
You have created a dashboard. For more information, see Create a dashboard.
You have selected a target dataset and configured the chart fields. For more information, see Configure chart fields.
Limitations
TopN operates on the returned result set, which is limited to 10,000 rows in the public cloud. Consequently, if a query returns more data, the TopN calculation might yield unexpected results.
TopN is supported for the following chart types.
Calculation method
Description
Supported chart types
Overall TopN
Filters the TopN values from the entire result set.
Line/Area charts: Line Chart, Area Chart, Stacked Area Chart, 100% Stacked Area Chart, Combo Chart.
Column/Bar charts: Column Chart, Stacked Column Chart, 100% Stacked Column Chart, Circular Column Chart, Leaderboard, Bar Chart, Stacked Bar Chart, 100% Stacked Bar Chart, Waterfall Chart, Bullet Chart, Box Plot, Histogram.
Bubble/Scatter charts: Bubble Chart, Scatter Plot, Facet Scatter Plot.
Table charts: crosstab, heatmap.
Pie/Donut charts: Pie Chart, Rose Chart, Radar Chart, Treemap.
Geo charts: Choropleth Map, Bubble Map, Heat Map, Flying Line Map, Symbol Map.
KPI charts: KPI Card, KPI Trend Chart.
Funnel/Conversion charts: Funnel Chart, Comparison Funnel Chart.
Other charts: Word Cloud.
In-group TopN
Groups data by a specified dimension and filters for the TopN values within each group.
Line/Area charts: Line Chart, Area Chart, Stacked Area Chart, 100% Stacked Area Chart, Combo Chart.
Column/Bar charts: Column Chart, Stacked Column Chart, 100% Stacked Column Chart, Bar Chart, Stacked Bar Chart, 100% Stacked Bar Chart, Bullet Chart, Box Plot, Histogram.
Bubble/Scatter charts (The X-axis cannot be a measure): Bubble Chart, Scatter Plot, Facet Scatter Plot.
Table charts: crosstab, heatmap.
Access TopN settings
In the chart's Fields panel, find the measure you want to use. Click the  icon next to the measure and select Advanced Calculation > TopN. Then, configure the TopN calculation method based on your business requirements.
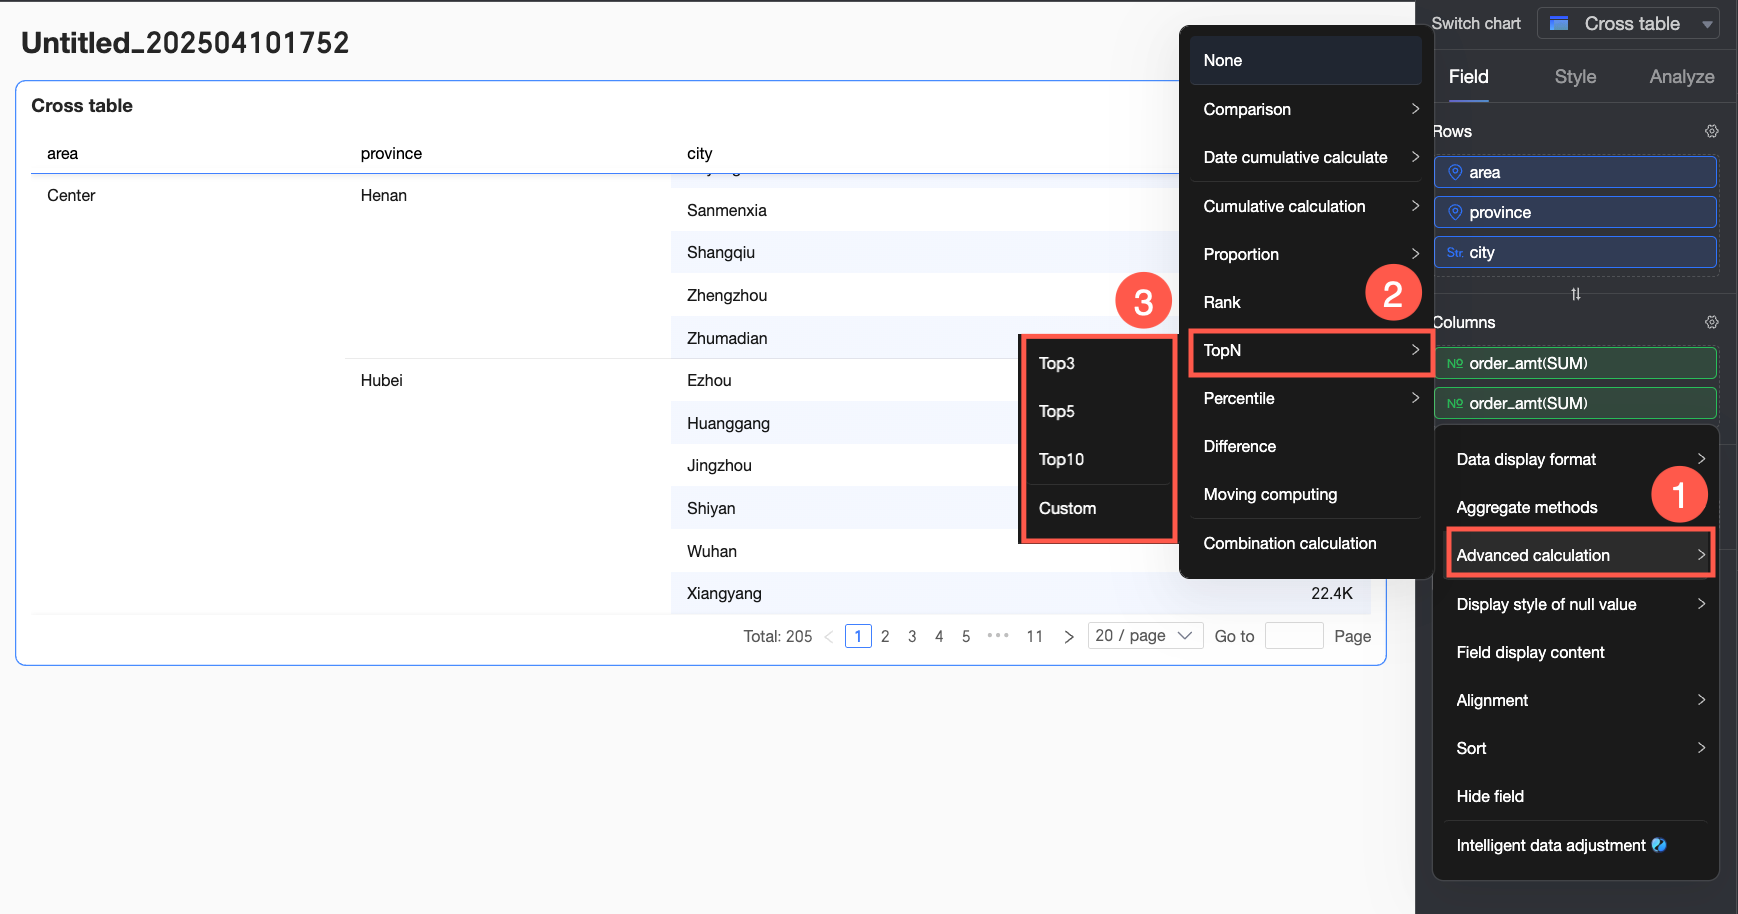
When you select a Custom calculation type, the options for a crosstab differ from those for other chart types, as shown in the table below.
Chart type | Calculation type | Restriction | Calculation logic |
crosstab | TopN by Column | Requires a dimension field in the Rows area. | Treats each column as an independent analysis unit and filters the TopN data within the entire column. |
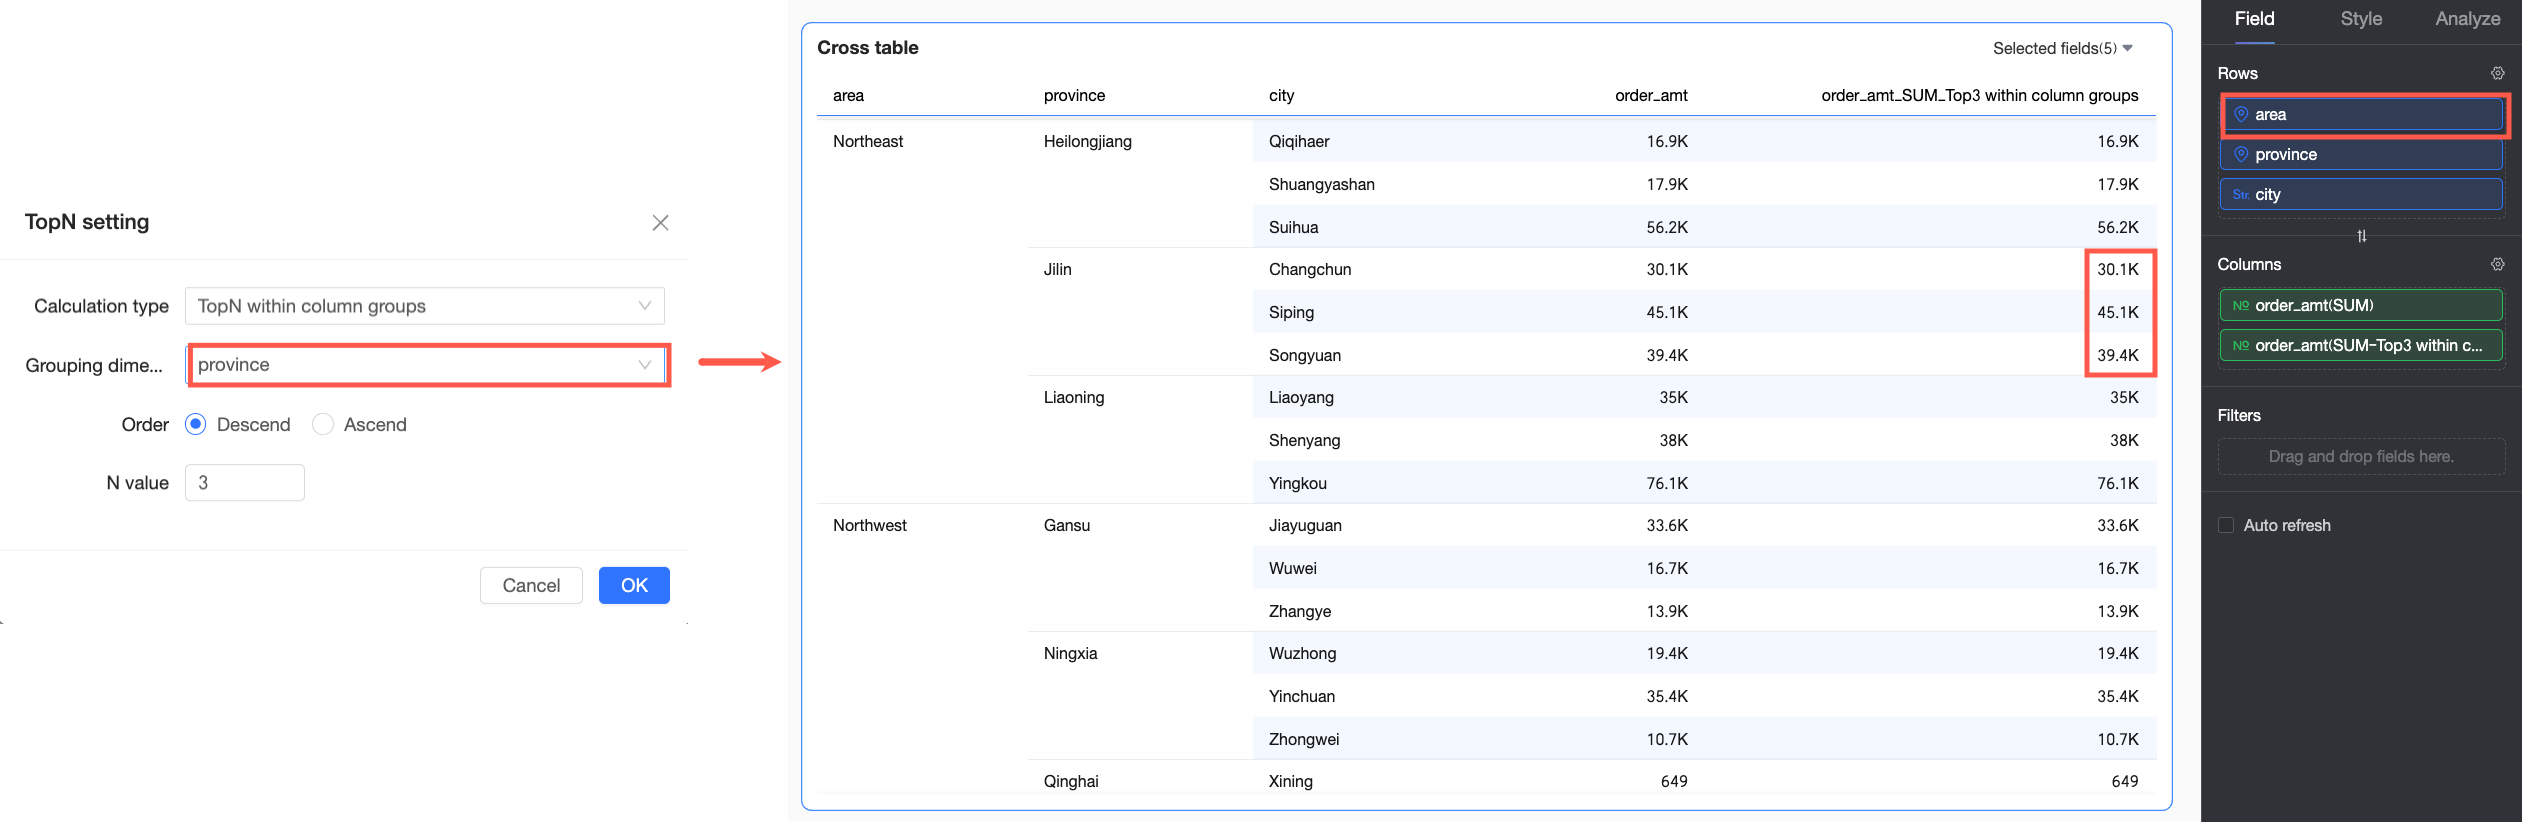
In-group TopN by Column | Requires at least two dimension fields in the Rows area. | Groups data in a single column by a selected dimension and filters for the TopN values within each group. Grouping logic: The grouping key includes all dimensions from the first in the Rows area up to and including the selected Grouping Dimension. For example, in the image below, data is grouped by the region and province fields. | |
TopN by Row | Requires a dimension field in the Columns area. | Treats each row as an independent analysis unit and filters the TopN data within the entire row. | |
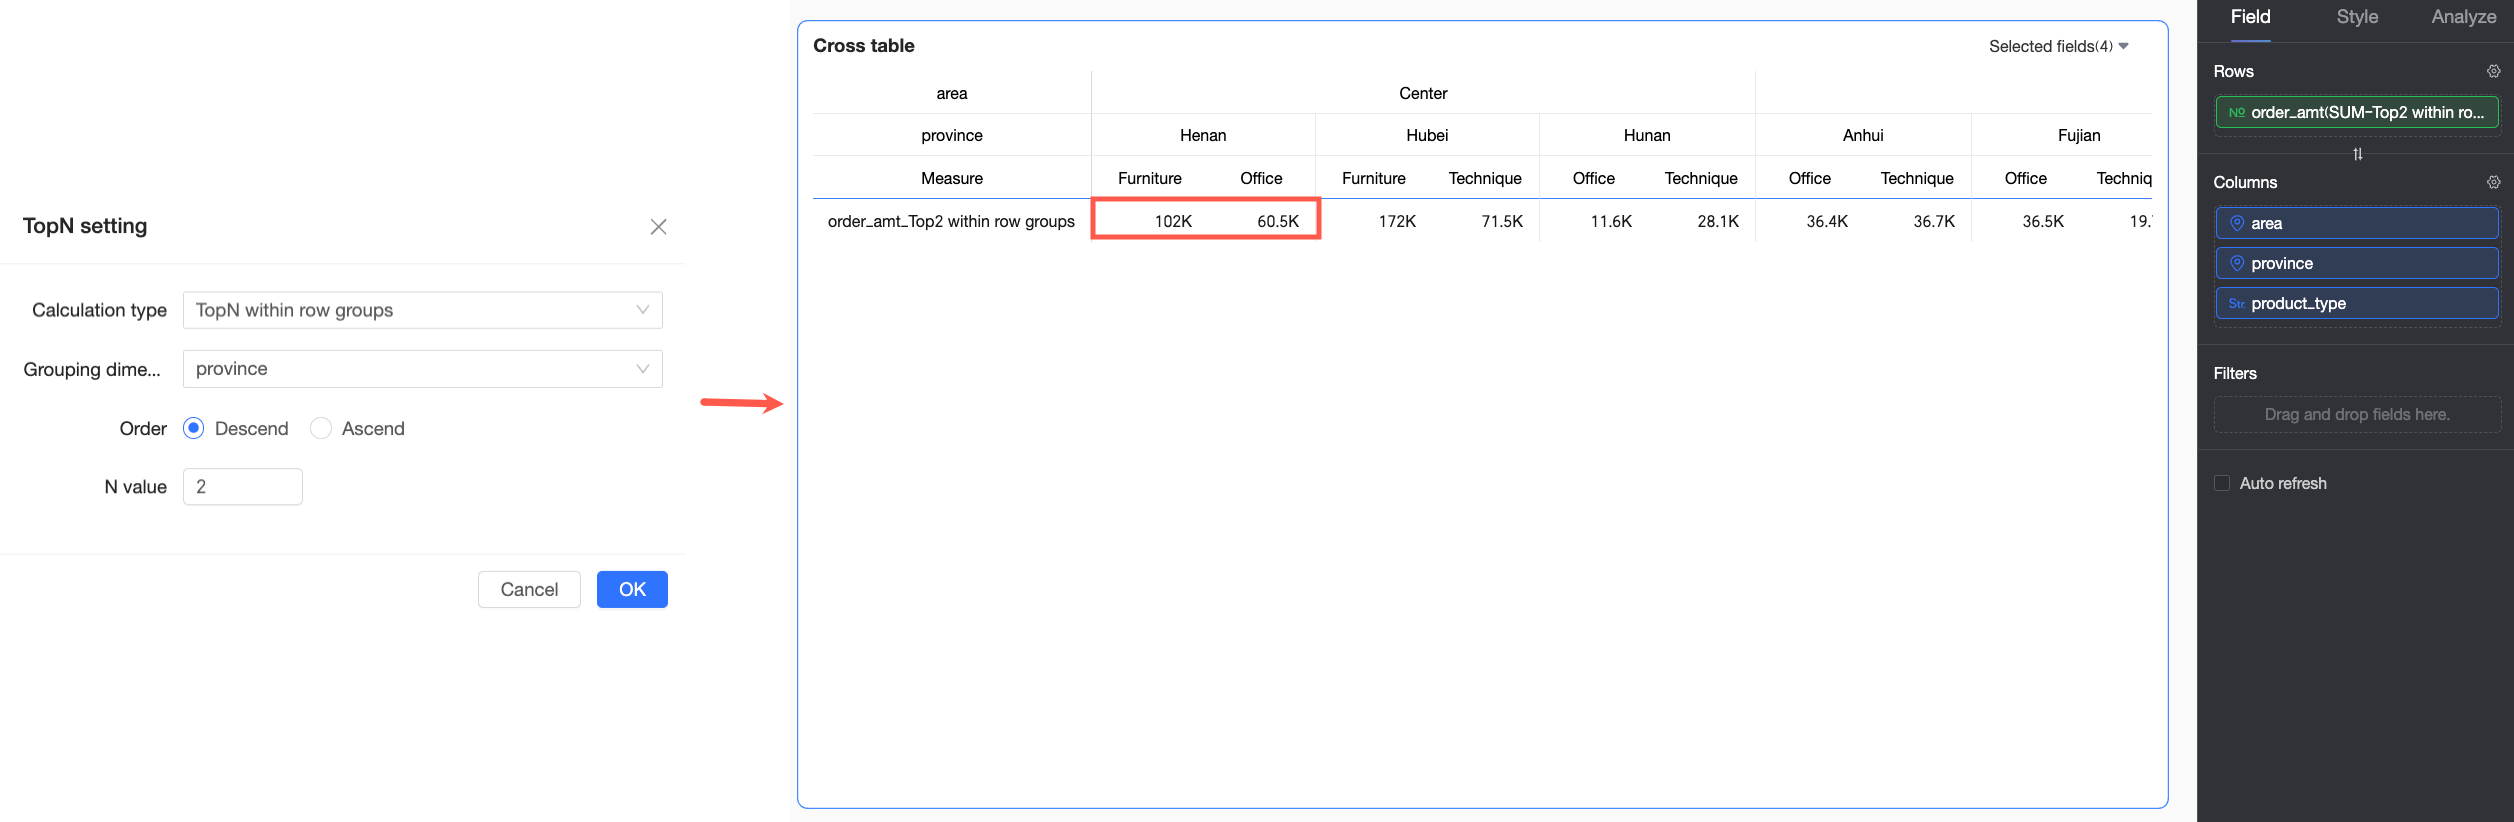
In-group TopN by Row | Requires at least two dimension fields in the Columns area. | Groups data in a single row by a selected dimension and filters for the TopN values within each group. Grouping logic: The grouping key includes all dimensions from the first in the Columns area up to and including the selected Grouping Dimension. For example, in the image below, data is grouped by the region and province fields. | |
Other charts | Overall TopN | / | Filters the TopN values from the entire result set. |
In-group TopN |
| Groups data by dimension fields and then filters for TopN values within each group. The grouping logic is as follows:
|

Examples
You can configure TopN for both measures and dimensions.
Configure TopN for a measure
To view the top three records by order amount, apply a TopN filter to the order amount measure:
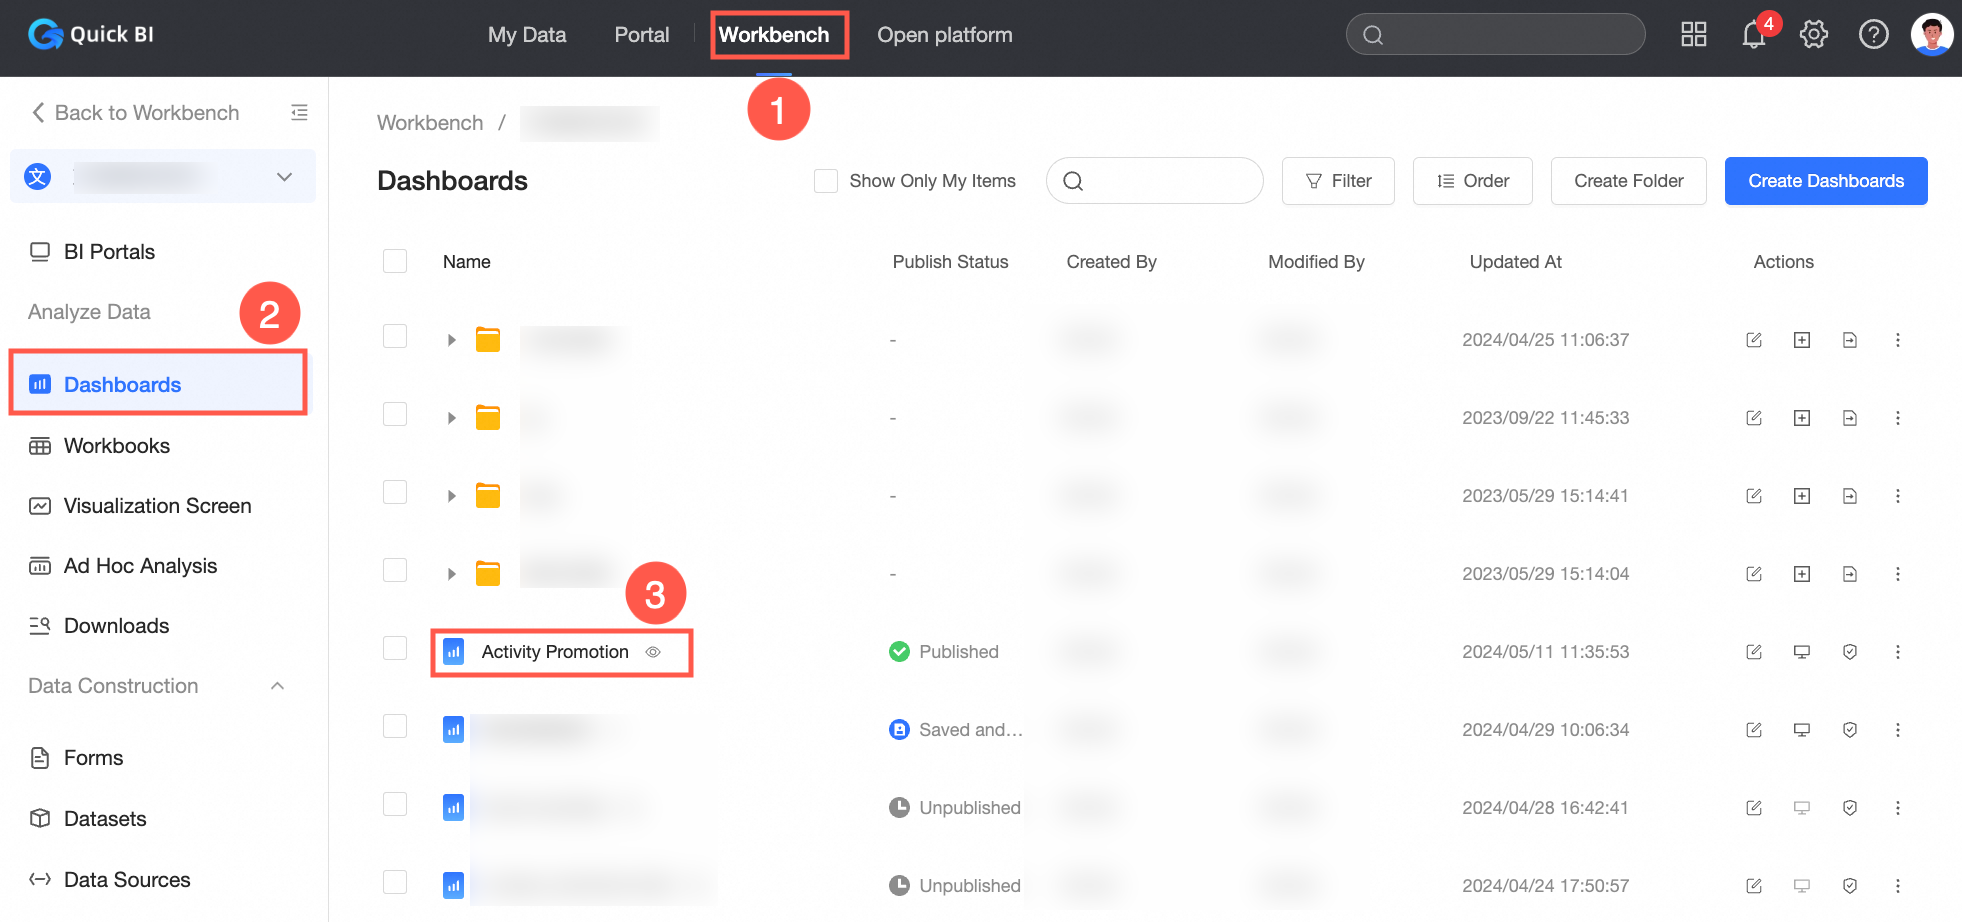
Log in to the Quick BI console.
Follow the steps in the figure below to edit a dashboard.

In the top menu bar, click Add Chart, find the
icon, and create a crosstab.In the Fields tab of the chart design panel, configure the data for the crosstab.
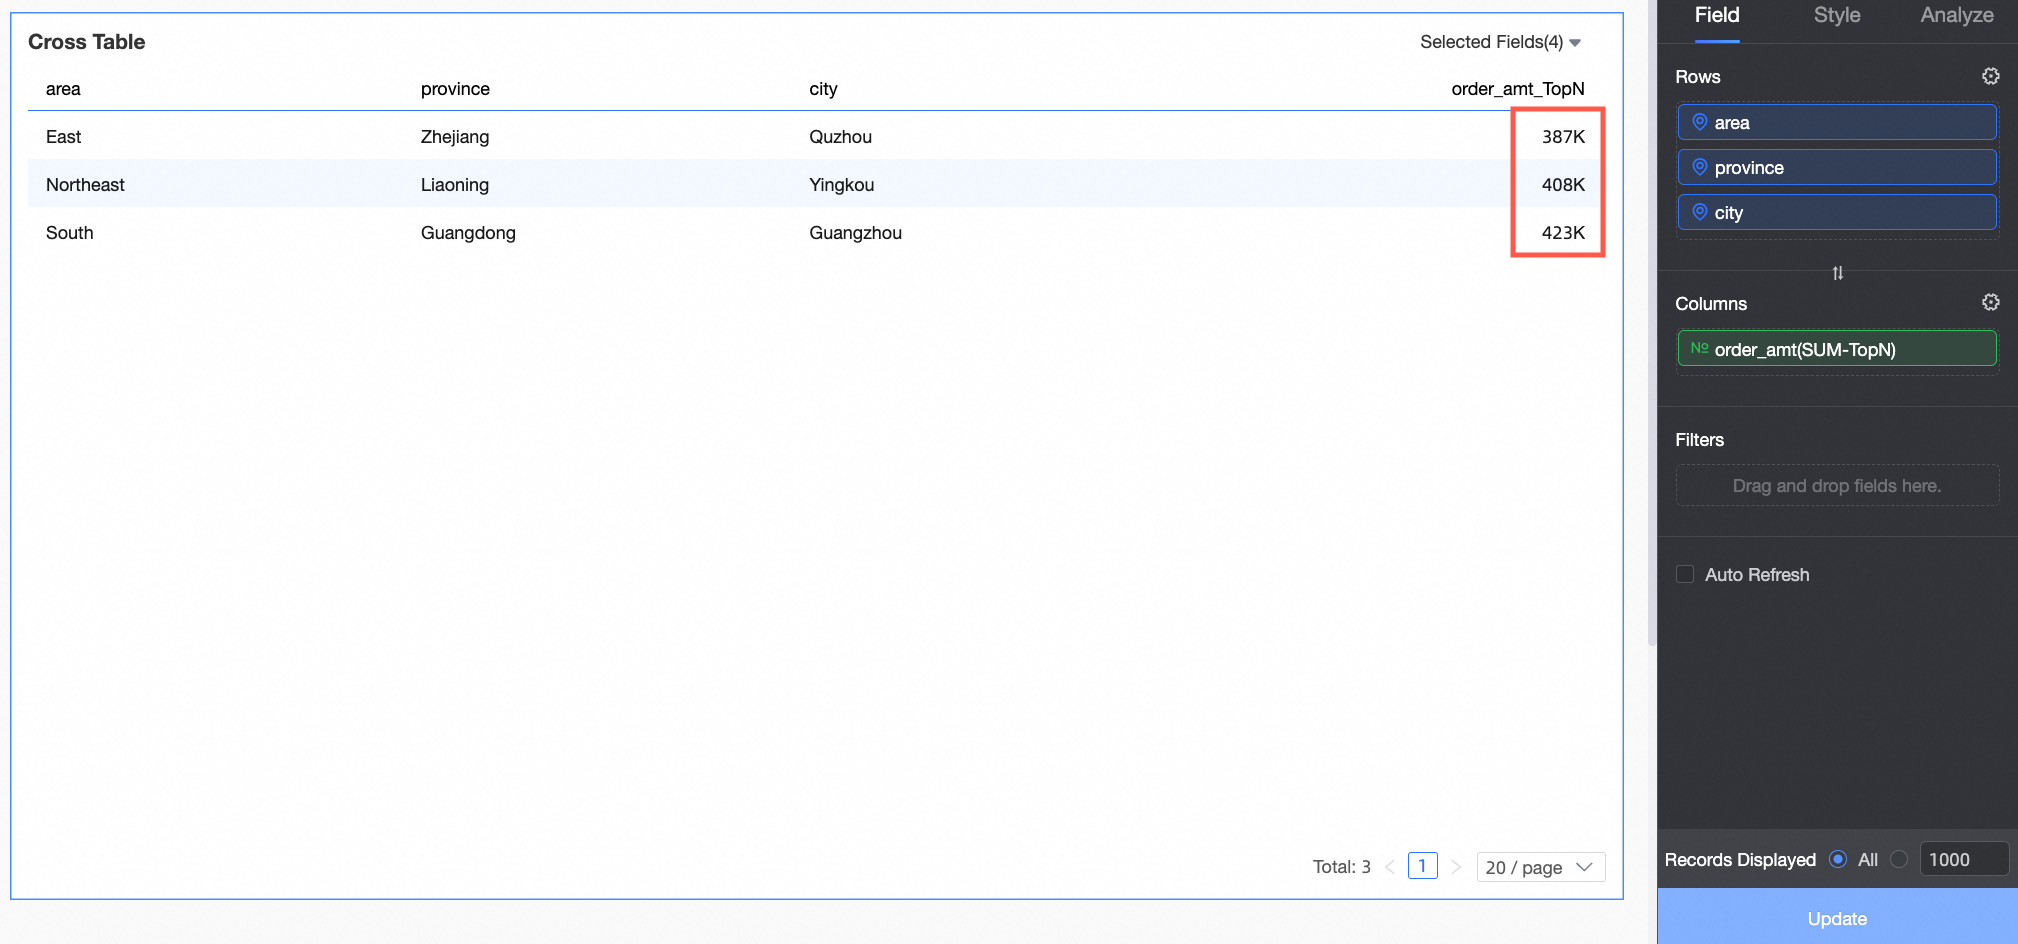
Click the
icon on the right, then select Advanced Calculation > TopN > Top3.Click Update.
The crosstab now displays only the top 3 records, sorted by order amount.
Configure TopN for a dimension
To view the top three records by order amount for each region, apply Advanced Calculation > Single-dimension TopN > Top3 to the region dimension. This filters the top three records within each region, such as Northeast China, North China, and South China.
Custom TopN
You can customize the TopN filter by configuring the Calculation Type, Order, and the number of records (N) to display. The available calculation types for a crosstab differ from those for other charts. For more information, see the comparison table in the Access TopN settings section.
The following table provides examples of different calculation types in a crosstab.
Calculation method
Description
Example
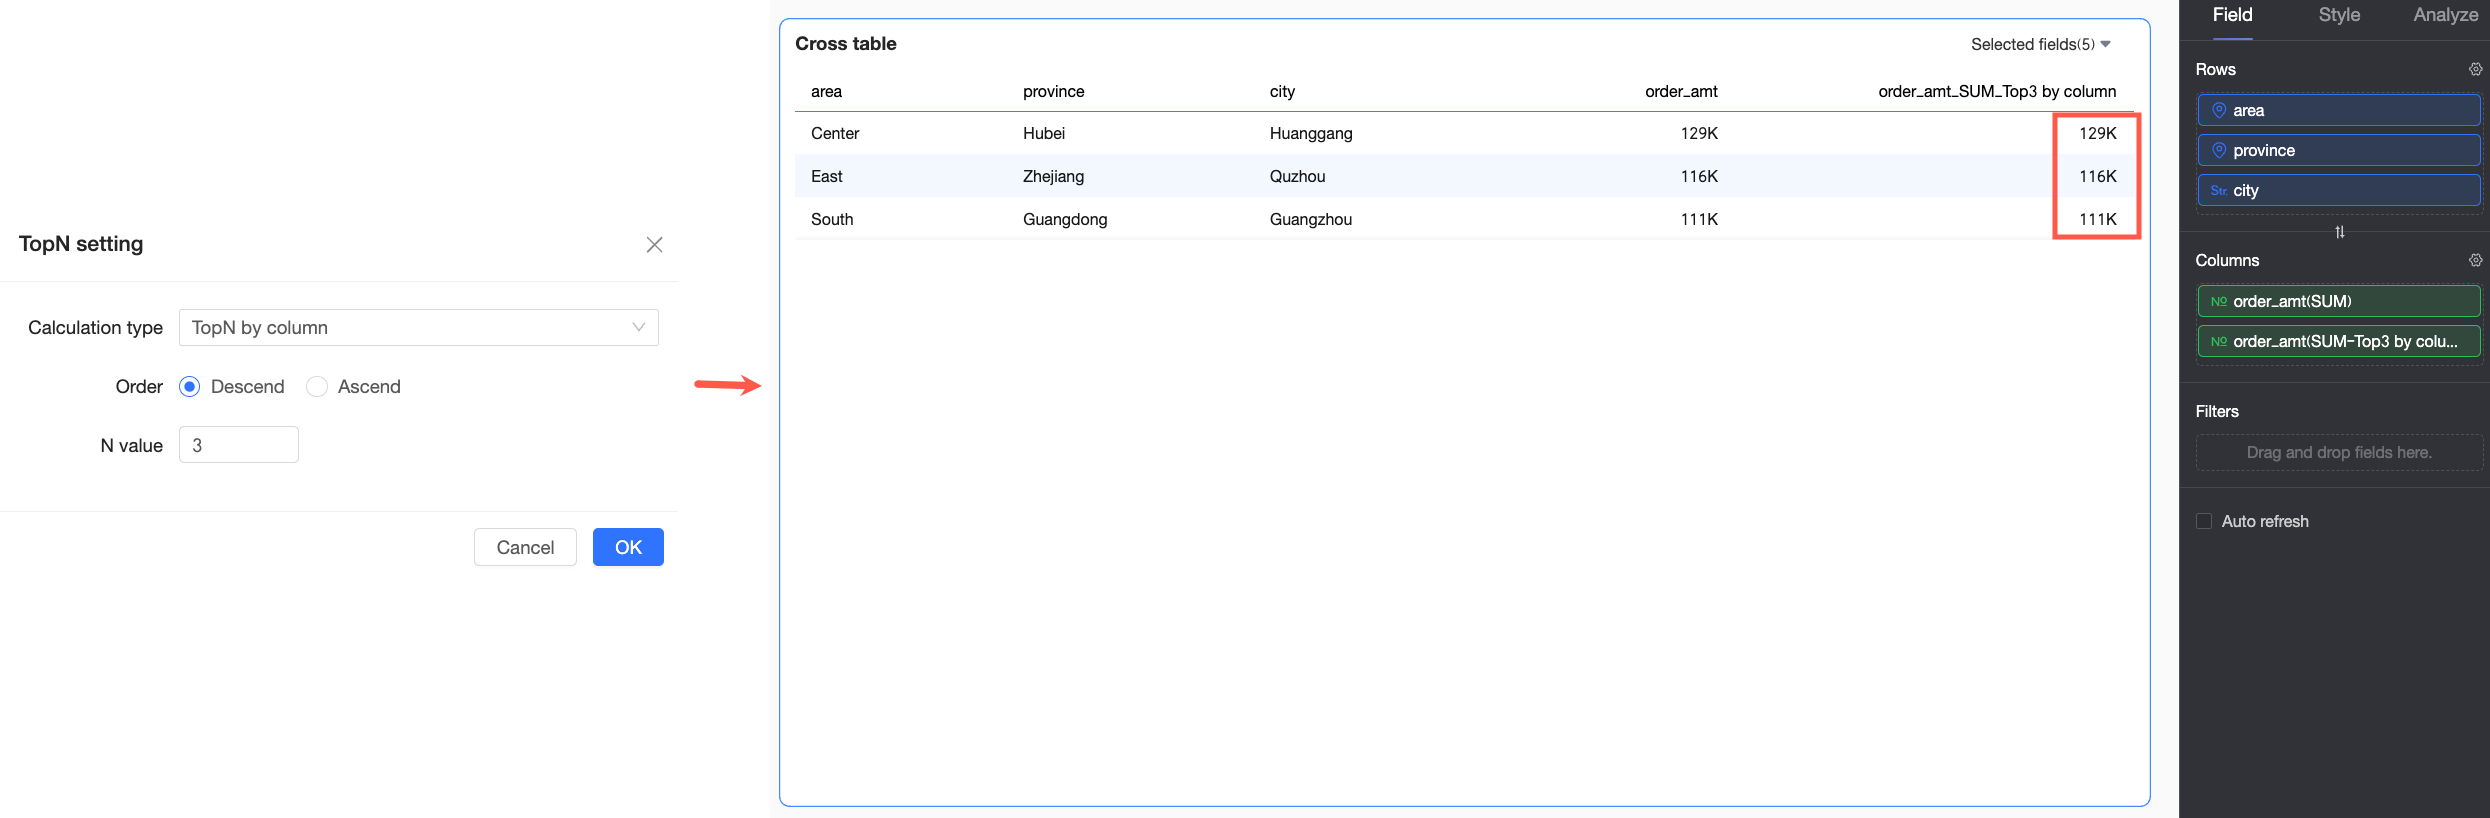
TopN by Column
Treats each column as an independent analysis unit and selects the top 3 records by order amount within the entire column.
In-group TopN by Column
In this example, the first dimension in Rows is region, and the grouping dimension is province. Therefore, the system groups city by its province and region, then displays, for each province, the top 3 cities by order amount and their order amounts.
TopN by Row
Treats each row as an independent analysis unit and selects the top 5 records by order amount within the entire row.
In-group TopN by Row
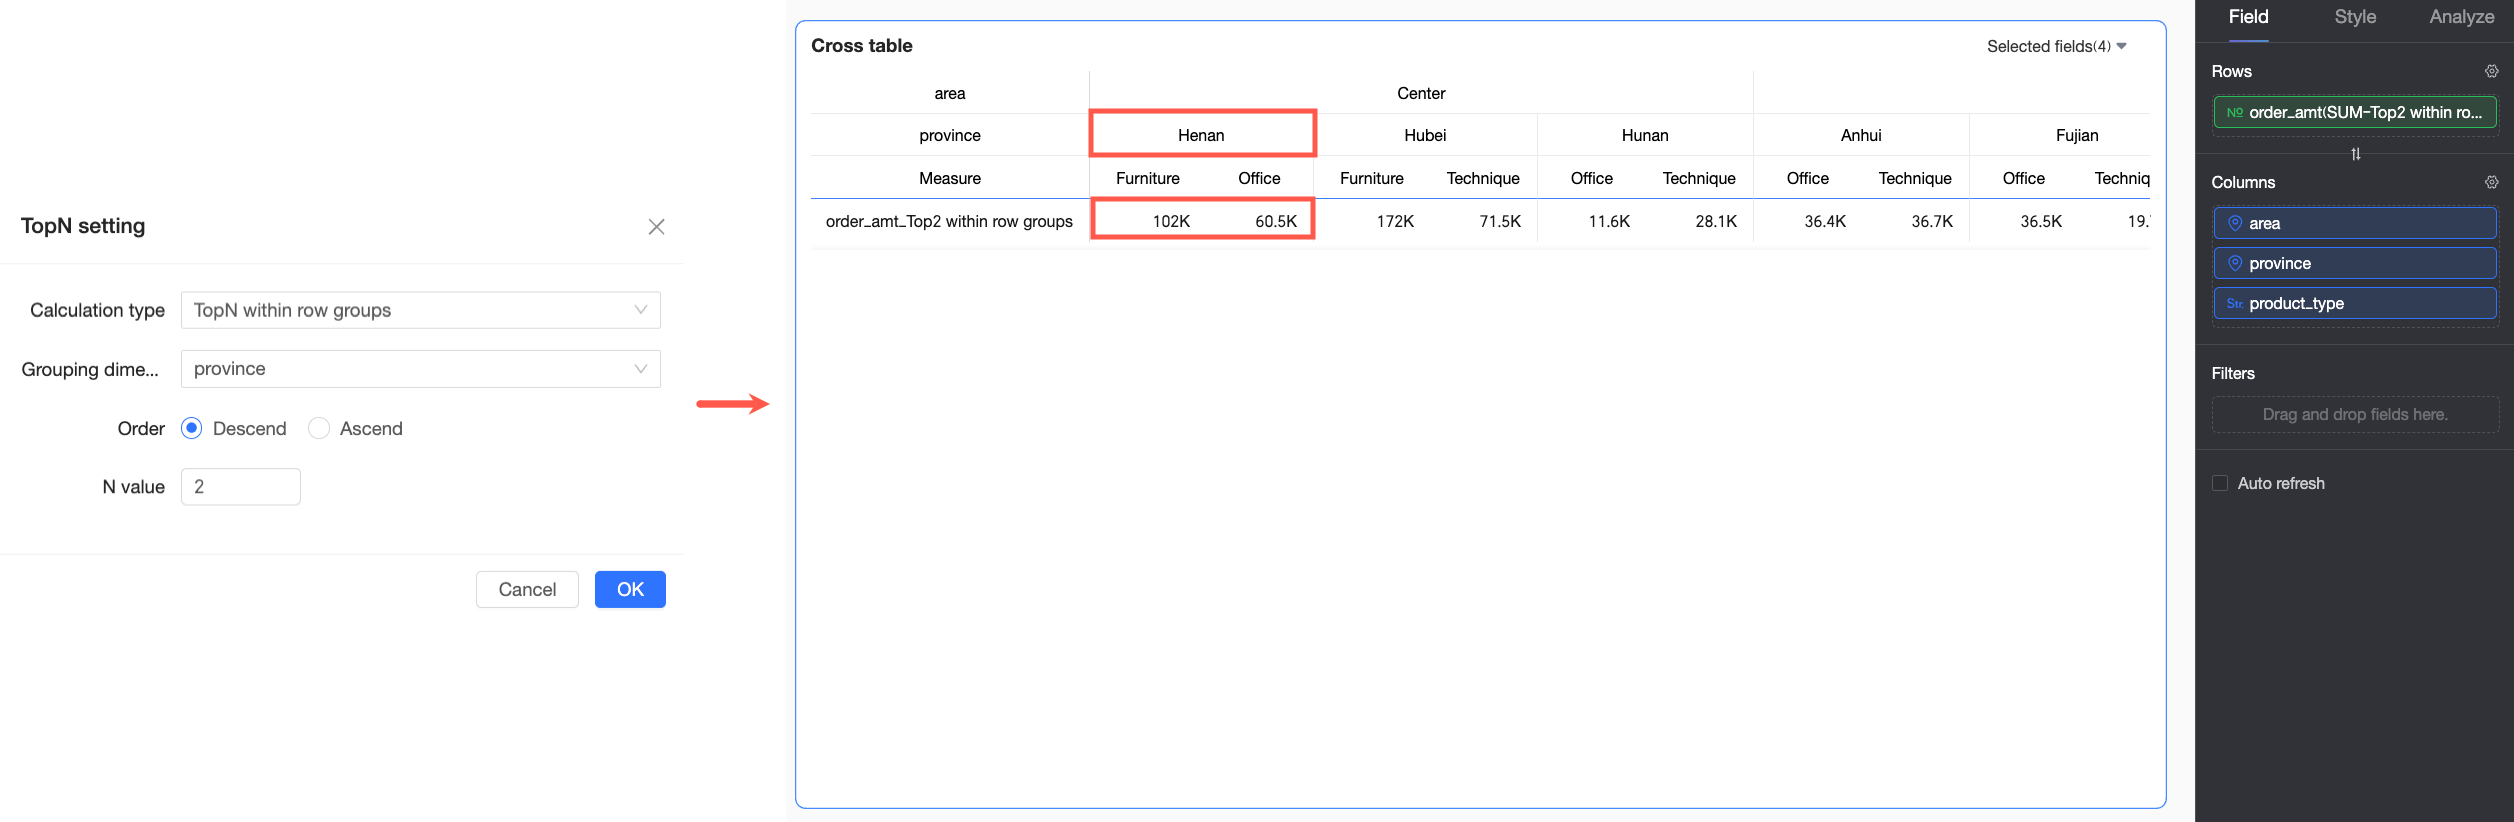
In this example, the first dimension in Columns is region, and the grouping dimension is province. Therefore, the system groups product_type by its region and province, then displays, for each province, the top 2 product types by order amount and their order amounts.
Special cases
Grand totals and subtotals
Grand totals and subtotals are excluded from TopN calculations and are incompatible with this feature. If you apply a TopN filter, existing Grand Total or Subtotal settings are automatically disabled.
Mixed row and column layouts
In a mixed row and column layout, the filter applies to the dimension values in the first column by default. For example, the following figure shows data filtered based on the order amount for 'Northeast'.
Null values
In TopN calculations, null values are treated as the smallest possible value. Therefore, a Top 5 (Descending) filter will exclude nulls, while a Bottom 5 (Ascending) filter will include them.
Multiple TopN filters
Only one TopN filter can be active at a time. Applying a new TopN filter replaces the previous one.
Multiple advanced calculations
A measure can only have one advanced calculation at a time. For example, applying a TopN filter replaces any existing Rank calculation on that measure.