Choropleth layer
The choropleth layer renders regional boundaries on a 3D globe using GeoJSON data and color-coded values.
Chart style
The choropleth layer is a subcomponent of the 3D globe widget. It supports independent style and data configurations and uses GeoJSON data to render regional boundaries and display region-level data on the globe. 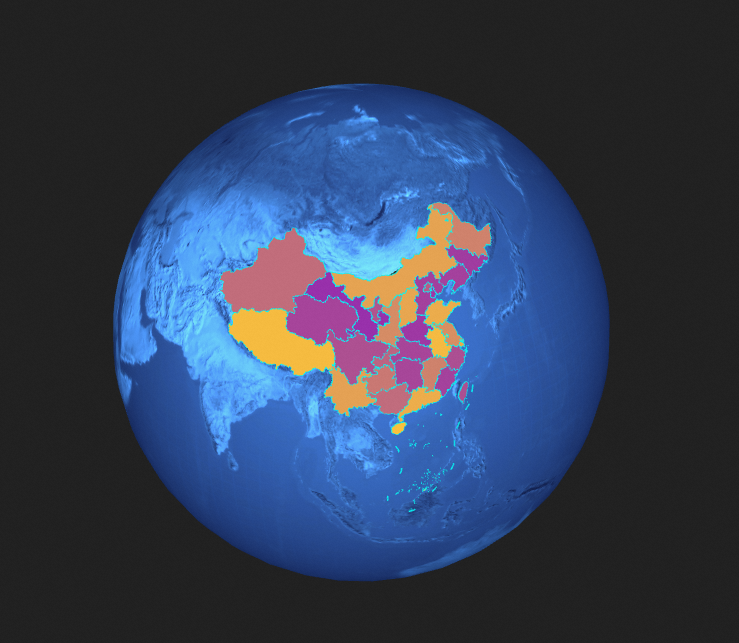
Settings
- Search for Configurations: In the right-side panel of Canvas Editor, click the Settings tab, and click Search for Configurations in the upper-right corner. Enter the required configuration item in the search box, and click the search icon to quickly locate the configuration item. Fuzzy match is supported. For more information, see Search for Configurations.
-
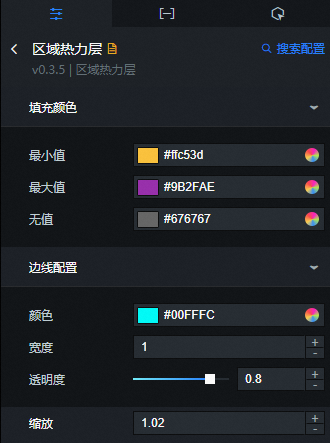
Fill color: the color settings of the choropleth layer.
Parameter
Description
Minimum
The color of the region that has the smallest value on the Data tab . For more information, see Color picker.
Max Value
The color of the region that has the largest value on the Data tab.
No Value
The color of regions that do not have data. If you have not configured the adcode parameter for a region on the Data tab, NoData Color takes effect for this region.
-
Edge Configuration
Parameter
Description
Color
The color of region boundary lines.
Width
The width of region boundary lines.
Transparency
The opacity of region boundary lines.
-
Scale: the ratio of the choropleth layer to the radius of the 3D globe. The larger the value, the farther the choropleth layer is from the center of the 3D globe. Valid value: 0.8 to 1.5. If the value is 1, the choropleth layer is aligned with the surface of the 3D globe.
Data tab
-
Regional heatmap
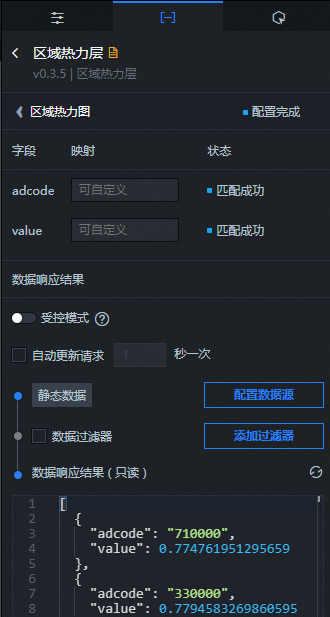
Configuration field description
Parameter
Description
adcodeThe code of a region.
valueThe value of a region. The MaxValue Color, MinValue Color, and NoData Color of the choropleth layer are rendered based on this parameter.
NoteDataV calculates the color gradient from the minimum to the maximum value based on the
valuerange in the data. -
geographical boundaries
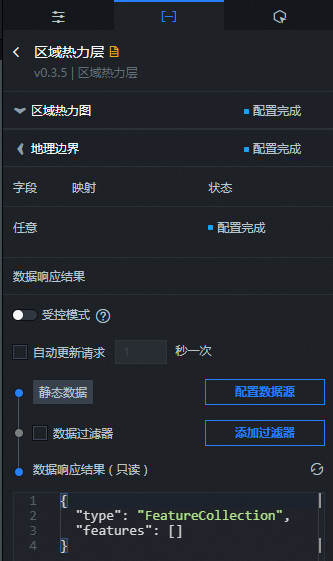
You can call the GeoJSON API to retrieve boundary data and apply it to DataV. The configuration method is the same as that of the Regional Thermal Layer component of the Basic Flat Map component. For more information, see Geo boundary geojson data interface.
| Parameter | Description |
| Controlled Mode | If you turn on the switch, data is not requested when a widget is initialized. Data requests are triggered only based on callback IDs or the method configured in Blueprint Editor. If you turn off the switch, data requests are automatically triggered. By default, the switch is turned off. |
| Auto Data Request | After you select the Auto Data Request check box, you can enable dynamic polling, and manually specify the polling interval. If you do not select this check box, data is not automatically requested. You must manually refresh the page to request data or use Blueprint Editor or callback ID events to trigger data requests. |
| Data Source | In the right-side panel of Canvas Editor, click the Data tab. Click Set next to Static Data. In the Configure Datasource panel, select a data source from the Data Source Type drop-down list. Enter code for data query in the code editor, click Preview Data Response to preview the response of the data source, and then view the response. For more information, see Configure asset data. |
| Data Filter | If you select the Data Filter check box, you can convert the data structure, filter data, and perform simple calculations. If you click the plus sign (+) next to Add Filter, you can configure the script for the data filter in the editor that appears. For more information, see Use the data filter. |
| Data Response Result | The response to a data request. If the data source changes, you can click the  icon next to Data Response Result to view the data response in real time. icon next to Data Response Result to view the data response in real time. |
Interaction tab
This widget does not support interaction events.
Configure interactions in Blueprint Editor
-
In Canvas Editor, click the
 icon next to Region Thermal Layer in the 3D Sphere Map widget.
 -
Click the
icon in the upper-left corner. -
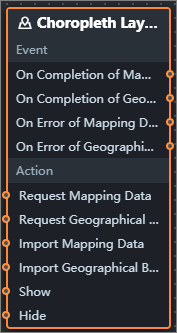
In Blueprint Editor, click the Regional Thermal Layer component in the Added Nodes pane. On the canvas, you can configure the parameters for the regional thermal layer, as shown in the following figure.
-
Event
Event
Description
When the zone heatmap request completes
After the region data is returned by the API and processed by filters, this event is triggered and passes the data in JSON format. For specific data examples, see the Data Response Result section of the Data tab in the right-side configuration panel of the canvas editor.
When a geographic boundary request is completed
After the geographical boundary data is returned by the API and processed by filters, this event is triggered and passes the data in JSON format. For specific data examples, see the Data Response Result section of the Data tab in the right-side configuration panel of the canvas editor.
When a zone heatmap request fails
Triggered when the region heatmap data request fails due to network issues or API errors, after the response is processed by filters. The event passes the processed data in JSON format. For specific data examples, see the Data Response Result section of the Data tab in the right-side configuration panel of the canvas editor.
When a geographic boundary request fails
Triggered when a geographic boundary data request fails due to network issues or API errors, after the response is processed by filters. The event passes the processed data in JSON format. For specific data examples, see the Data Response Result section of the Data tab in the right-side configuration panel of the canvas editor.
-
Policy Action
Policy Action
Description
Request regional heatmap
Requests the server data again, using the data from an upstream data processing node or layer node as a parameter. For example, if the API data source is
https://api.testand the data passed to the request area heatmap is{ id: '1'}, the final request URL ishttps://api.test?id=1.Request geographic boundaries
Requests the server data again, using the data from an upstream data processing node or layer node as a parameter. For example, if the API data source is set to
https://api.testand the data passed to the request geographic boundary action is set to{ id: '1'}, the final request URL ishttps://api.test?id=1.Import Area heatmap
Imports pre-processed widget data in the required drawing format for redrawing, without sending a new server request. For specific data examples, see the Data Response Result section of the Data tab in the right-side configuration panel of the canvas editor.
Import geographic boundaries
Imports pre-processed widget data in the required drawing format for redrawing, without sending a new server request. For specific data examples, see the Data Response Result section of the Data tab in the right-side configuration panel of the canvas editor.
Display Widget
Shows the widget. No parameters are required.
Hide components
Hides the widget. No parameters are required.
-
 icon next to Region Thermal Layer in the 3D Sphere Map widget.
  icon in the upper-left corner.