RFM analysis examines the RFM metrics of users within an RFM dataset. It shows the distribution of users across various RFM types, as shown in the following figure.
Procedure
You can open the RFM Analytics page in one of the following ways:
Navigate to Workspace > User Insights > User Analysis > RFM Analytics. This opens the RFM Analytics page, as shown in the preceding figure.
Navigate to Workspace > Configuration Management > Data Center > Dataset. In the dataset list, click the
 icon for the target RFM dataset to open the RFM Analytics page.
From the drop-down list in the upper-right corner, select the RFM dataset to analyze. The corresponding analysis charts appear below.
NoteIf you open the RFM Analytics page from an RFM dataset, that dataset is selected by default.
The analysis results include the following sections:
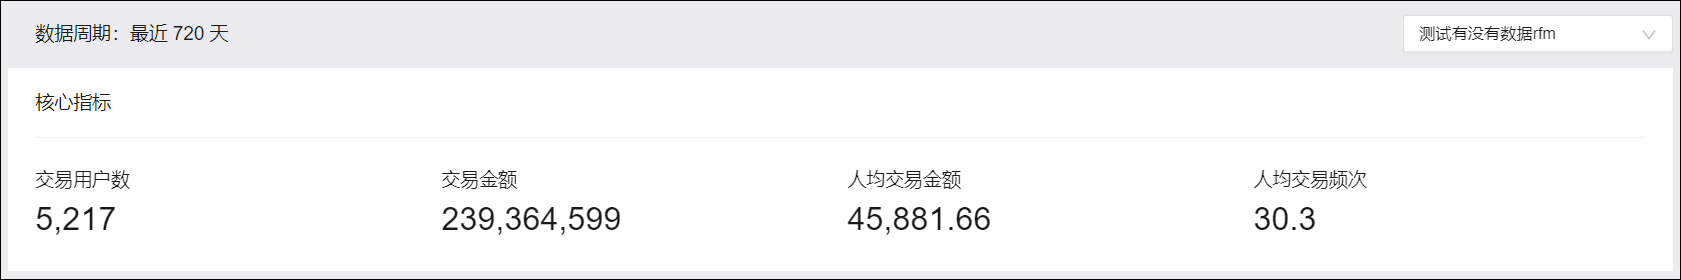
Core metrics
If the selected RFM dataset is the customer data type, the page displays the values for the number of transacting users, total monetary value, average monetary value per user, and average transaction frequency per user.
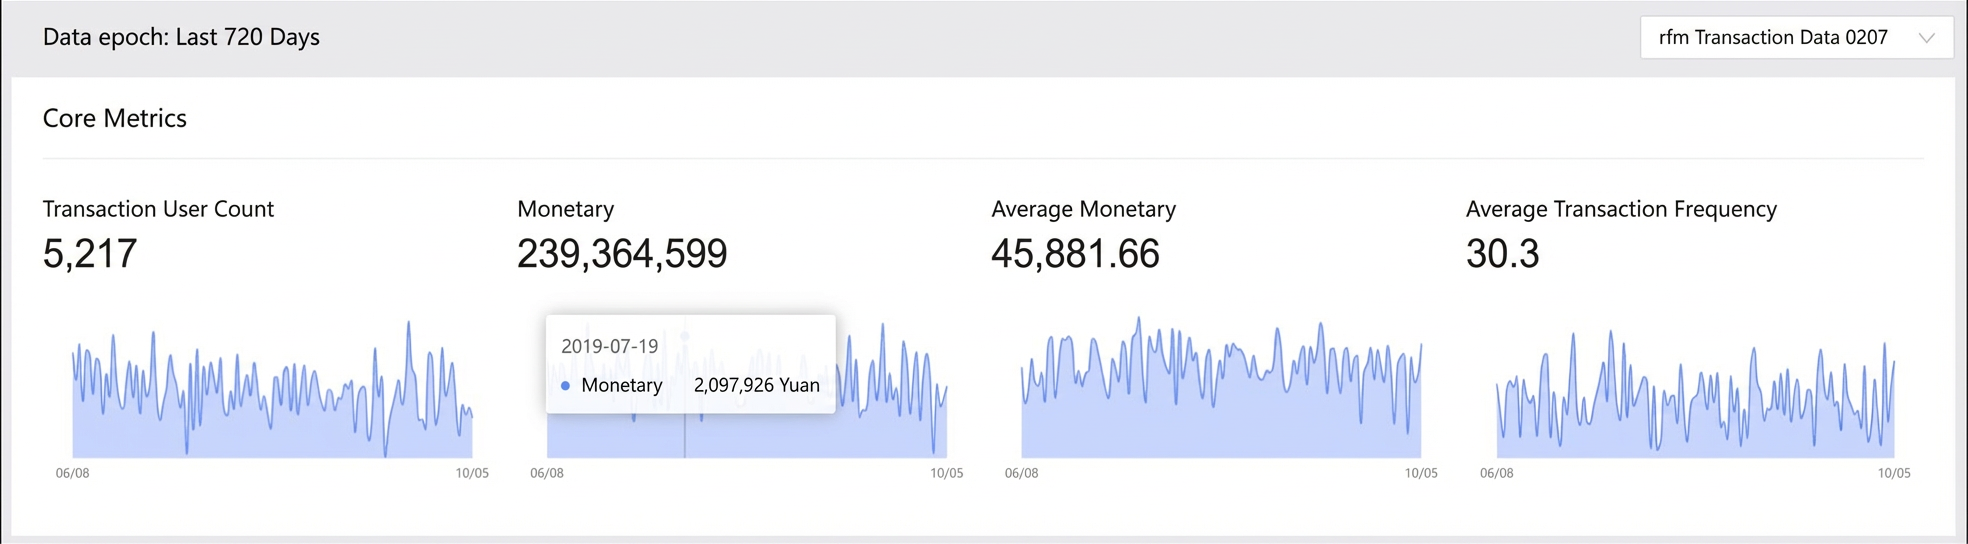
If the selected RFM dataset is the transaction data type, the page displays the values and trend charts for the number of transacting users, total monetary value, average monetary value per user, and average transaction frequency per user.
RFM user composition (by user type)
This section shows the user type distribution of the audience based on the user classification defined in the RFM dataset. For more information about the RFM user type definitions, see the RFM user type classification rules section below.
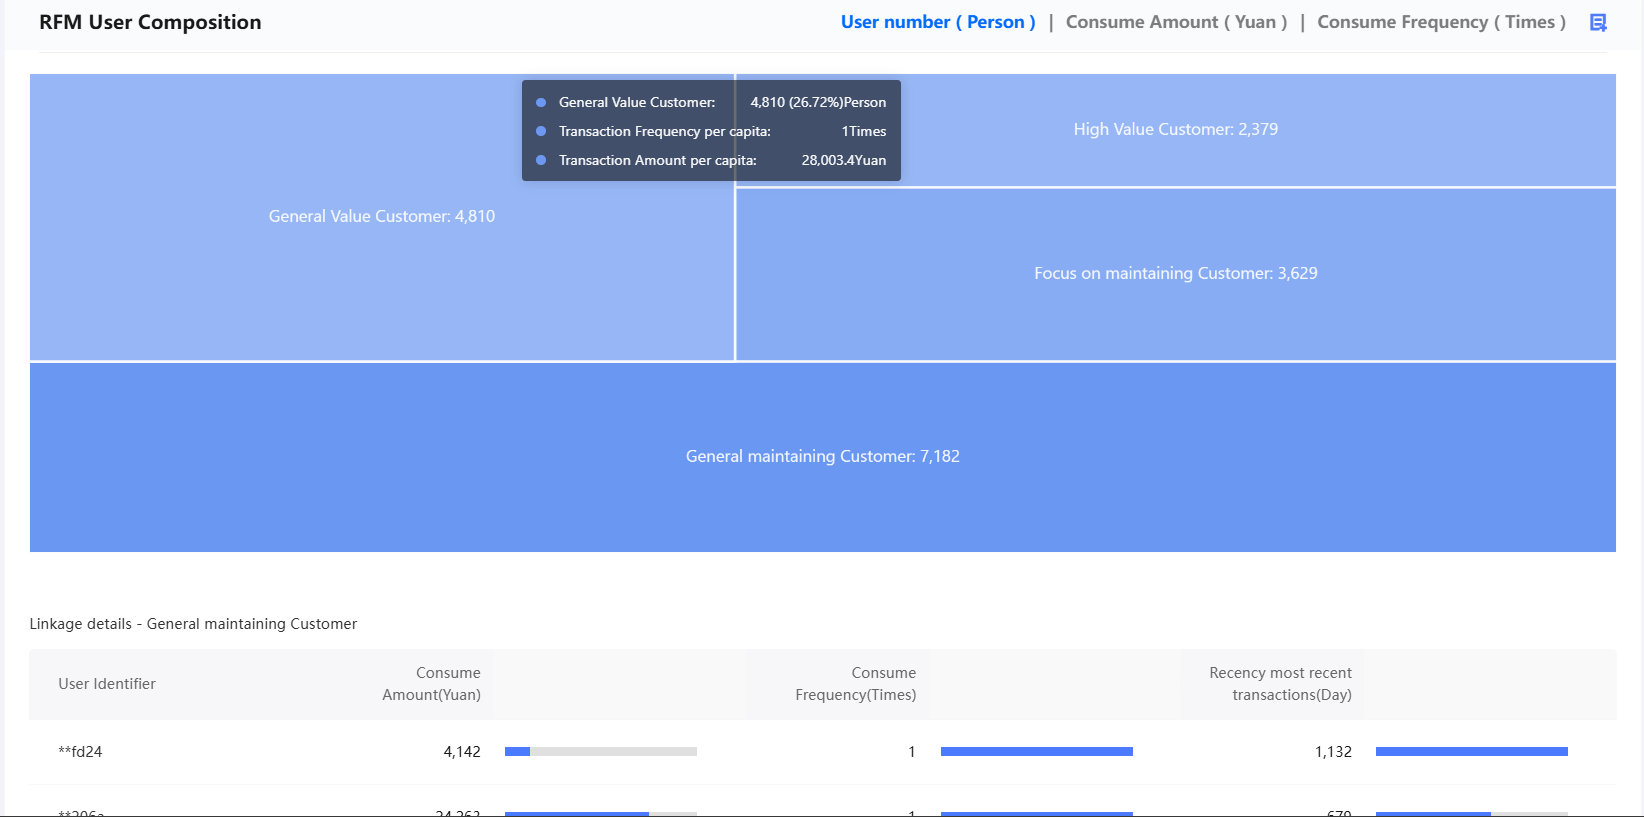
In the upper-right corner of the chart, select a dimension to view the user type distribution: Number of Users, Monetary Value, or Frequency.
Hover over a user type graphic to display the number and percentage of users, average monetary value per user, and average transaction frequency per user for that segment.
Click a user type graphic to display the transaction information for five sample users of that type below the chart.
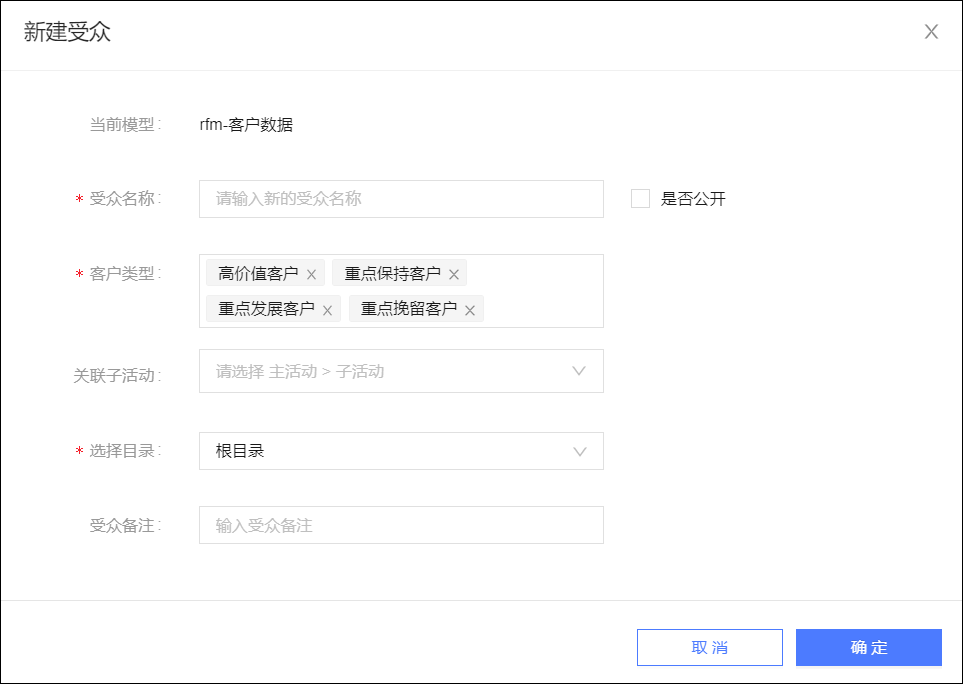
To create an audience from specific user types, click the
 icon in the upper-right corner of the chart. In the dialog box, select one or more user types, enter a name and description, select a folder and an associated sub-campaign (for more information, see the Marketing Campaign document), and specify whether the audience is public. Then, click OK.
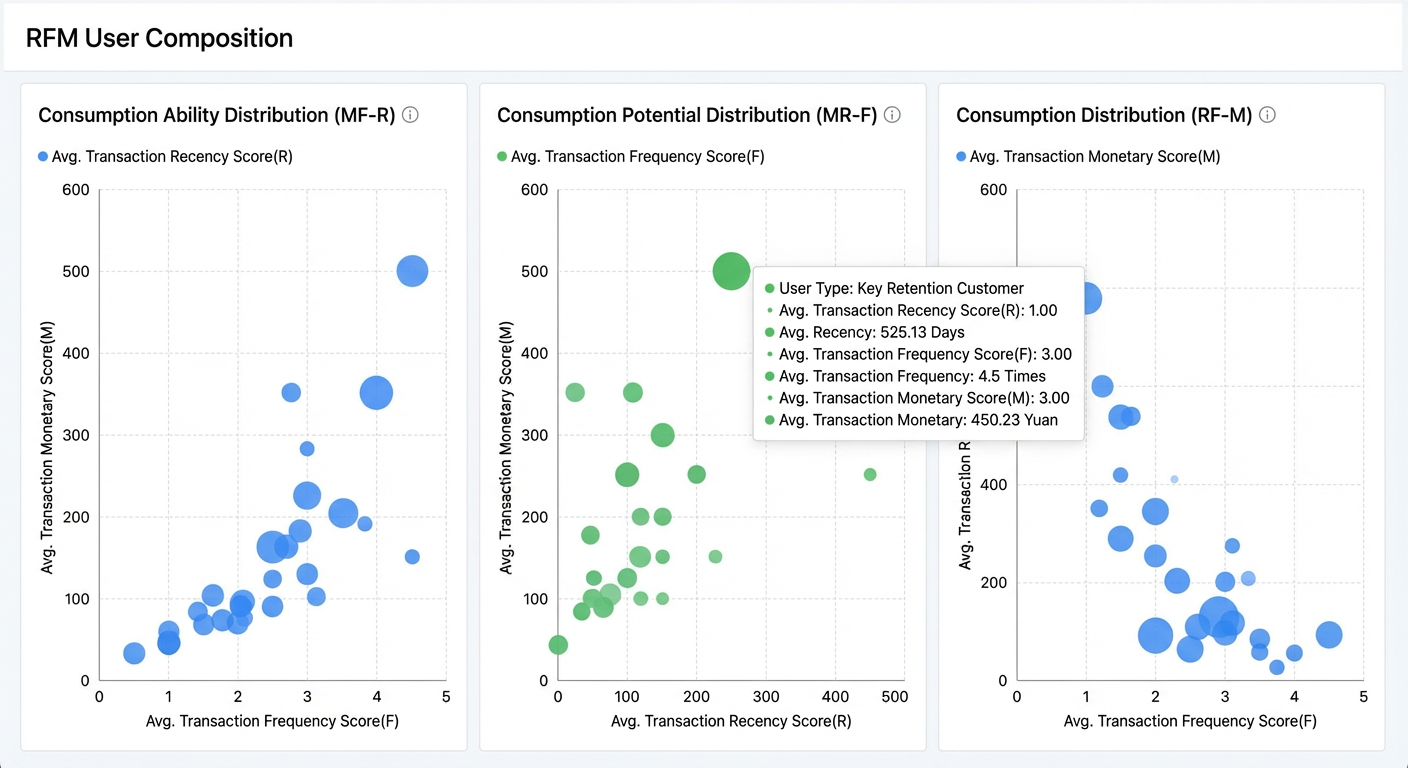
RFM user composition (by consumption distribution)
Consumption capacity distribution (MF-R): The horizontal axis represents F (Frequency), the vertical axis represents M (Monetary), and the point size represents R (Recency). The MF distribution visually shows the consumption capacity of customers. The size of R helps identify which customers are more loyal. A larger point indicates higher customer loyalty.
Consumption potential distribution (MR-F): The horizontal axis represents R (Recency), the vertical axis represents M (Monetary), and the point size represents F (Frequency). The MR distribution visually shows the consumption potential of customers. The size of F helps you discover customers with more value. A larger point indicates that the customer has more potential value.
Consumption distribution (RF-M): The horizontal axis represents F (Frequency), the vertical axis represents R (Recency), and the point size represents M (Monetary). The RF distribution visually shows changes in customer consumption behavior. The size of M helps determine which customers are more important to retain. The larger the point, the more critical it is to retain the customer.
Hover over a user type graphic to display the average transaction data for that user segment.
RFM user type classification rules
A user's RS, FS, and MS scores are compared with the RS, FS, and MS comparison values, respectively. This comparison determines the user's relative value within the group:
If a user's score is higher than the comparison value, their value is high.
If a user's score is lower than the comparison value, their value is low.
A user's value in each of the R, F, and M dimensions is classified as either high or low. Based on their combined performance across all three dimensions, users are divided into eight types. The following figure shows the detailed types and classification rules.
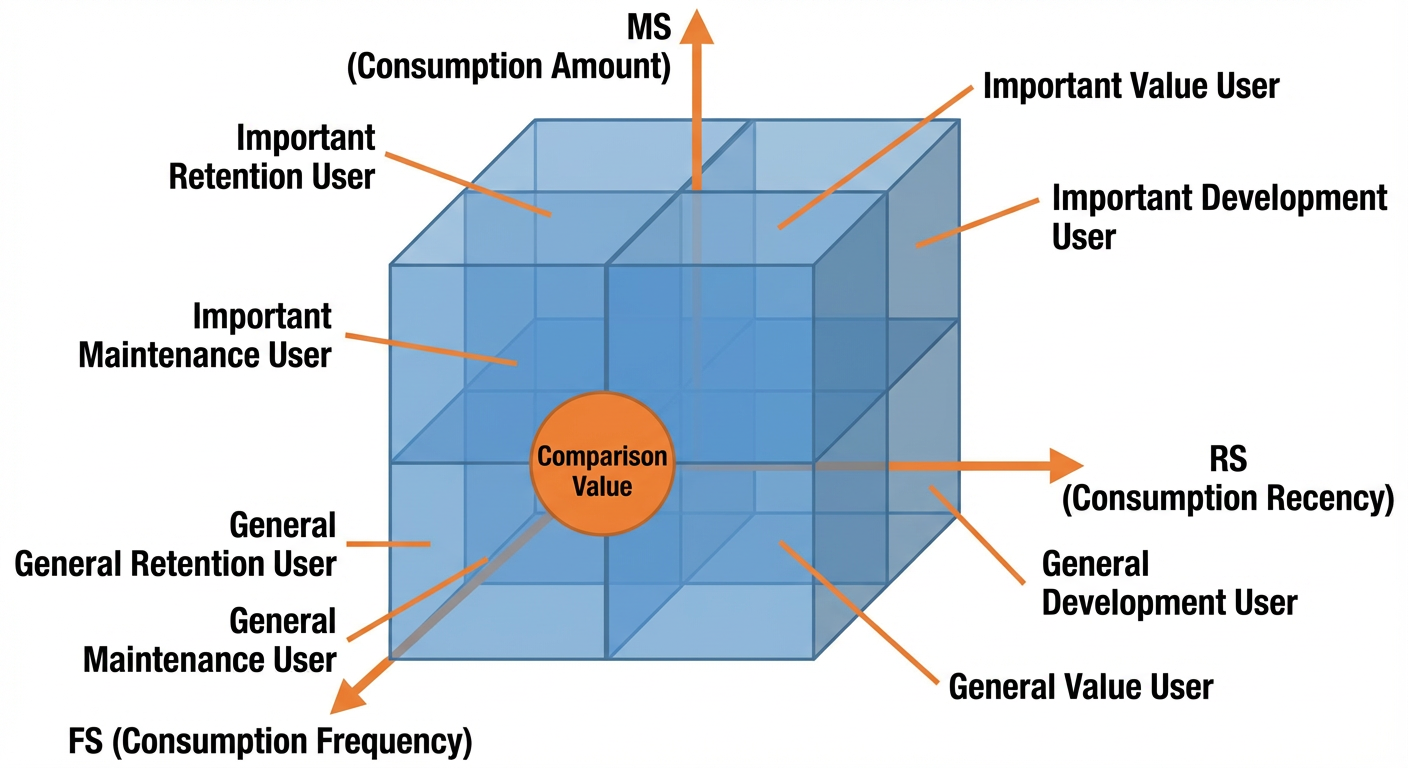
RS, FS, and MS are the user's scores for Recency, Frequency, and Monetary value, respectively.
The RS, FS, and MS comparison values are the average scores (weighted average) for Recency, Frequency, and Monetary value of all users in the RFM dataset, or they can be custom values.
The scoring rules and comparison values are set in the RFM dataset. For more information, see Create an RFM dataset.
RFM user type |
RS |
FS |
MS |
Description |
High-value Customers |
Greater than or equal to the RS comparison value |
Greater than or equal to the FS comparison value |
Greater than or equal to the MS comparison value |
Users who have purchased recently, purchase frequently, and spend a large amount are defined as high-value customers. |
Key Customers to Retain |
Less than the RS comparison value |
Greater than or equal to the FS comparison value |
Greater than or equal to the MS comparison value |
Users who have not purchased recently but purchase frequently and spend a large amount are defined as key customers to retain. |
Key Customers to Develop |
Greater than or equal to the RS comparison value |
Less than the FS comparison value |
Greater than or equal to the MS comparison value |
Users who have purchased recently and spend a large amount but do not purchase frequently are defined as key customers to develop. |
Key Customers to Win Back |
Less than the RS comparison value |
Less than the FS comparison value |
Greater than or equal to the MS comparison value |
Users who have not purchased recently and do not purchase frequently but spend a large amount are defined as key customers to win back. |
General Value Customers |
Greater than or equal to the RS comparison value |
Greater than or equal to the FS comparison value |
Less than the MS comparison value |
Users who have purchased recently and purchase frequently but do not spend a large amount are defined as general value customers. |
General Customers to Retain |
Less than the RS comparison value |
Greater than or equal to the FS comparison value |
Less than the MS comparison value |
Users who have not purchased recently and do not spend a large amount but purchase frequently are defined as general customers to retain. |
General Customers to Develop |
Greater than or equal to the RS comparison value |
Less than the FS comparison value |
Less than the MS comparison value |
Users who have purchased recently but do not purchase frequently and do not spend a large amount are defined as general customers to develop. |
Potential Customers |
Less than the RS comparison value |
Less than the FS comparison value |
Less than the MS comparison value |
Users who have not purchased recently, do not purchase frequently, and do not spend a large amount are defined as potential customers. |
References
For audiences created during the analysis: