Quick Start
This topic uses a money transfer application as an example to demonstrate the features of the operations management components. The example shows you how to publish, modify, and monitor an application.
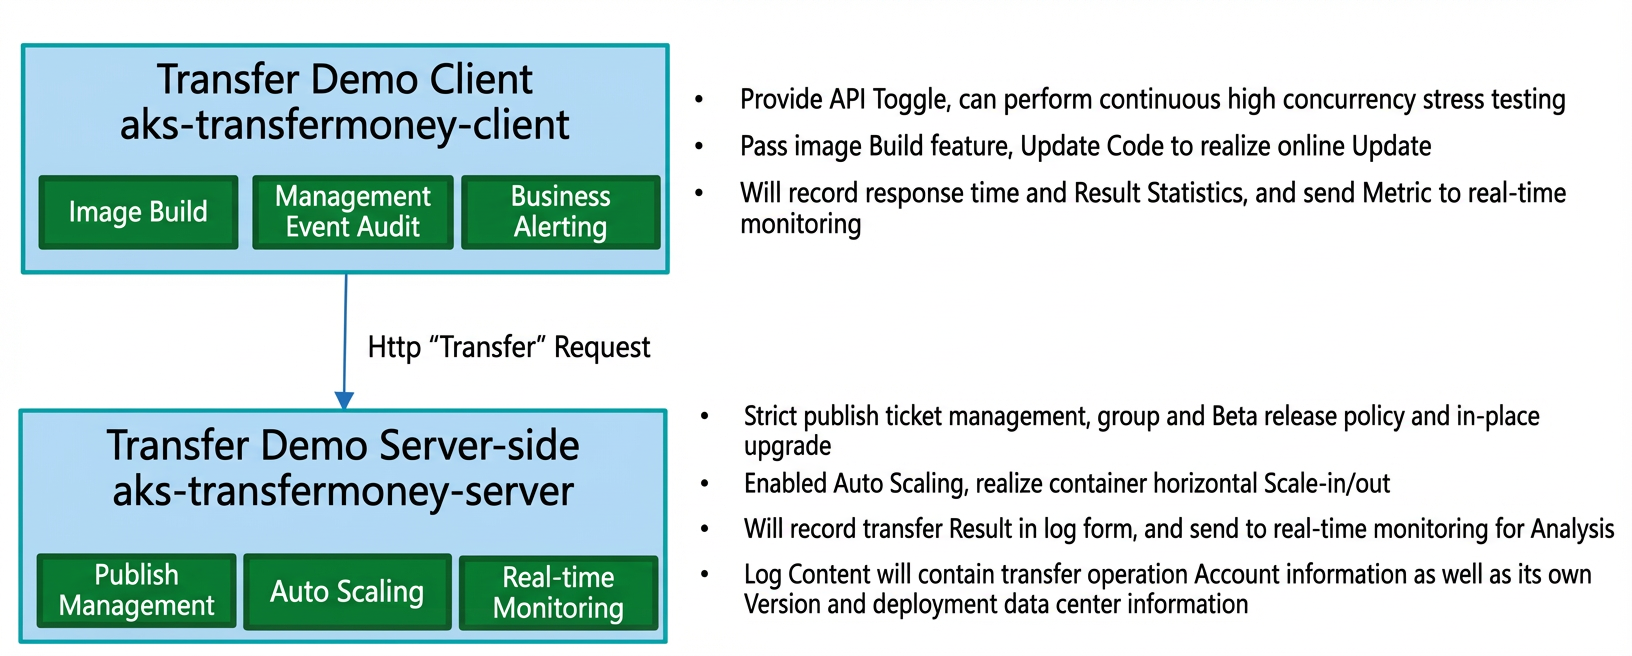
Prerequisites
Step 1: Create the money transfer application
In Application Management, create an application named Transfer Money. For Technology Stack, select SOFABoot 2.0. For more information, see Create an application.
Step 2: Create application services
In Containerized Application Service, create the following two application services. For more information, see Create an application service.
Create an application service for the money transfer server named aks-transfermoney-server.
The configuration details are as follows:
Basic information and pod template:
CPU: 200m Core - 500m Core, Memory: 512 MB - 1 GB.
Image:
Use the sample image `aks-transfermoney-server`. The Registry Address is
registry-vpc.cn-shanghai.aliyuncs.com/sofa-samples/aks-transfermoney-server:20190726095608708-master.40215e87.Environment variables: Set
APPSVC_VERSION = V1andANTCLOUD_SOFA_PROFILE = prod.Health check: For the Readiness Probe, set the check method to HTTP GET, the path to
/health/readiness, and the port to8080. Configure the remaining parameters as prompted.Simple Log Service: Select an existing Logstore or create a new one. Set the log path to
/home/admin/release/run/logs/aks-transfermoney-server/digest/*.log.Business real-time monitoring: Set the monitoring directories to
/home/admin/release/run/logsand/home/admin/release/run/logs/aks-transfermoney-client/digest/transfermoney.log.
Scaling: Enable auto scaling for the server replicas. Set the minimum number of replicas to 1 and the maximum to 4. Configure the auto scaling rule to trigger when CPU utilization reaches 50%. This rule ensures that the CPU utilization (actual usage/requested resources) remains below the 50% threshold within the specified replica limits. You can add other metrics, such as memory. The scaling action is based on the metric that requires the highest number of replicas.
Access: The server uses a ClusterIP Service to allow access within the cluster. Set the port mapping to the TCP protocol, with Service port 80 and container port 8341. Record the Service Name. You will need this name to configure an environment variable for the client application.
Publish: Keep the default settings.
NoteAfter you configure and submit the application service, add a version note to distinguish between versions. For other settings, see Create an application service.
Create an application service for the money transfer client named aks-transfermoney-client.
The configuration details are as follows:
Basic information and pod template:
CPU: 200m Core - 500m Core, Memory: 512 MB - 1 GB.
Image: Use the sample image `aks-transfermoney-client`. The Registry Address is
registry-vpc.cn-shanghai.aliyuncs.com/sofa-samples/aks-transfermoney-client:20190815134744553-master.5ea6278b.Environment variable: Set the
SERVER_TM_ADDRESSvariable to the Service Name of the server.Business real-time monitoring: Set the monitoring directory to
/home/admin/release/run/logs.
Scaling: Set the number of replicas to a fixed value of 1. Each client can handle a maximum of 1,000 concurrent requests for stress testing.
Access: Attach the client to a public-facing SLB Service. Set the frontend port to 80 and the backend port to 8341. Use the default values for the other settings.
Publish: Keep the default settings.
After you configure and submit the application service, add a version note to distinguish between versions. For other settings, see Create an application service.
Step 3: Create a release ticket to publish the application
Select the two application services and publish them in series. In the advanced configuration, set `aks-transfermoney-client` to depend on `aks-transfermoney-server`.
Step 4: Trigger batch operations from the client
On the product page for the client application service, go to the Service tab to obtain the public IP address of the SLB Service.
Run the following curl command locally to start the client and invoke the service in batches with 1,000 concurrent requests.
NoteIf you have multiple client instances, run the command several times. By default, SLB uses a polling method for load balancing. This example uses one client instance.
# Start, max concurrency 1000
# If the money transfer client instance goes down due to high concurrency (max 1000), the system automatically restarts the containerized application
 curl -X POST "http://$Money_Client_SERVICE_IP/webapi/transferclient/start?concurrency=1000&minamount=100&maxamount=100"

# Statistics
 curl http://$Money_Client_SERVICE_IP/webapi/transferclient/gauges

# Stop
 curl -X PUT "http://$Money_Client_SERVICE_IP/webapi/transferclient/stop"
Step 5: Create a business monitoring dashboard
On the Custom Monitoring page of Real-time Monitoring, create metrics with the following dimensions:
NoteAfter you configure the metrics, the monitoring data becomes available in about 2 to 3 minutes. In the navigation pane on the left, click Custom Monitoring, and then click the new metric to view its statistics. For more information, see Create custom monitoring.
Container cell that responds to server-side requests:
NoteFor more information, see Second-level statistics_Multi-key.
Monitoring type: Second-level statistics/Multi-key.
Monitoring configuration name: Enter a name for the metric, such as `transferserver_cell`.
Application: Select the server application service created in this tutorial.
Log file to collect: Select the log path specified in the server application service. For example:
/home/admin/release/run/logs/aks-transfermoney-server/digest/transfermoney.log.Group by column value: Specify the grouping column as `Cell`.
Statistical method: Count the number of rows.
Application version:
NoteFor more information, see Second-level statistics_Multi-key.
Monitoring type: Second-level statistics/Multi-key.
Monitoring configuration name: Enter a name for the metric, such as `transferserver_Version`.
Application: Select the server application service created in this tutorial.
Log file to collect: Select the log path specified in the server application service. For example:
/home/admin/release/run/logs/aks-transfermoney-server/digest/transfermoney.log.Group by column value: Specify the grouping column as `Version`.
Statistical method: Count the number of rows.
Client-side HTTP status code:
NoteFor more information, see Second-level statistics_Multi-key.
Monitoring type: Second-level statistics/Multi-key.
Monitoring configuration name: Enter a name for the metric, such as `transferclient_httpstatus`.
Application: Select the client application service created in this tutorial.
Log file to collect: Select the log path of the client application service. For example:
/home/admin/release/run/logs/aks-transfermoney-client/digest/transfermoney.log.Group by column value: Specify the grouping column as `HttpStatus`.
Statistical method: Count the number of rows.
Top transfer-out accounts by minute:
NoteFor more information, see Minute-level Top statistics.
Monitoring type: Minute-level Top statistics.
Monitoring configuration name: Enter a name for the metric, such as `transfer_top_From`.
Application: Select the server application service created in this tutorial.
Log file to collect: Select the log path specified in the server application service. For example:
/home/admin/release/run/logs/aks-transfermoney-server/digest/transfermoney.log.Group by column value: Specify the grouping column as `From`.
Statistical method: Set the maximum rank to 10 and count the number of rows.
Top transfer-in accounts by minute:
NoteFor more information, see Minute-level Top statistics.
Monitoring type: Minute-level Top statistics.
Monitoring configuration name: Enter a name for the metric, such as `transfer_top_To`.
Application: Select the server application service created in this tutorial.
Log file to collect: Select the log path specified in the server application service. For example:
/home/admin/release/run/logs/aks-transfermoney-server/digest/transfermoney.log.Group by column value: Specify the grouping column as `To`.
Statistical method: Set the maximum rank to 10 and count the number of rows.
Minute-level client invocation statistics:
NoteFor more information, see Minute-level statistics_Multi-key.
Monitoring type: Minute-level statistics/Multi-key.
Monitoring configuration name: Enter a name for the metric, such as `transferclient_status_minutes`.
Application: Select the client application service created in this tutorial.
Log file to collect: Select the log path of the client application service. For example:
/home/admin/release/run/logs/aks-transfermoney-client/digest/transfermoney.log.Group by column value: Specify the grouping column as `status`.
Statistical method: Calculate the average of the column values.
Column for averaging: `latency`.
On the Custom Monitoring page, create a new dashboard named `TransferMoney` and configure it as follows:
Name: TransferMoney dashboard.
Dashboard layout: Click Add Report and add the metrics you created in the previous step. For more information about the configuration parameters, see Dashboard.
You can add the custom `TransferMoney` dashboard to the Key Business Dashboard to easily view statistical information from various dimensions:
Step 6: Monitoring and alerts
Set alert rules and alert subscriptions for a specific metric or for all metrics.
For example, you can set an alert rule for the `transferclient_status_minutes` metric. An alert is triggered if the average latency or the rate of non-200 HTTP codes exceeds a specified threshold within one minute.
Step 7: Verify the auto scaling capability of the application service
Run the following curl command locally to start the client and invoke the service in batches with 1,500 concurrent requests.
curl -X POST "http://$Money_Client_SERVICE_IP/webapi/transferclient/start?concurrency=1500&minamount=100&maxamount=100"Check the scale-out status of the server application service instances.
The scaling configuration for the server application service was previously set to 1 to 4 replicas. After the client starts the stress test, the number of server instances quickly scales out to the maximum of 4. The real-time dashboard also shows the relevant data trends. When the concurrency reaches a certain upper limit, it triggers an out-of-memory (OOM) error.
On the product page for the server application service, click Quick Operations > Scaling, scale out to 10 instances, and click Submit. After you submit, a release ticket is automatically generated. Click Publish All to publish the changes.
This release ticket takes effect quickly because it only involves a change to the scaling configuration.
Run the following curl command locally to stop the client invocations.
curl -X PUT "http://$Money_Client_SERVICE_IP/webapi/transferclient/stop"Check the scale-in status of the server application service instances.
The number of server instances quickly scales in to the minimum of 1. The real-time dashboard also shows the relevant data trends.