You can search for, edit, delete, and view the performance of activity units.
Search for an activity unit
To find an activity unit, search by its name or ID.
Enter the name or ID of the activity unit in the search box in the upper-right corner of the list.
Click Search to find matching activity units.
Edit an activity unit
You cannot edit an activity unit if it contains a live activity. In this case, the Edit option is not available in the Actions column.
You can edit an activity unit's name and conversion metrics. To do so:
In the list, find the activity unit and click Edit in the Actions column.
In the Modify Activity Unit dialog box, update the activity unit information. For parameter descriptions, see Create an activity unit.
Click OK to confirm your changes.
Delete an activity unit
You cannot delete an activity unit if it contains a live activity. In this case, the Delete option is not available in the Actions column.
To delete an activity unit:
In the list, find the activity unit and click Delete in the Actions column.
In the confirmation dialog box that appears, click OK.
View activity performance
In the list of activity units, click Performance in the Actions column for a unit to view its performance data. You can choose to view the performance of all activities within the unit or focus on a specific one.
When viewing a specific activity, you can also filter the performance data to see results from all marketing channels or a single marketing channel.
The activity performance dashboard displays performance information in two sections: Activity Overview and Activity Retention. This topic describes the statistical metrics that are displayed in each section.
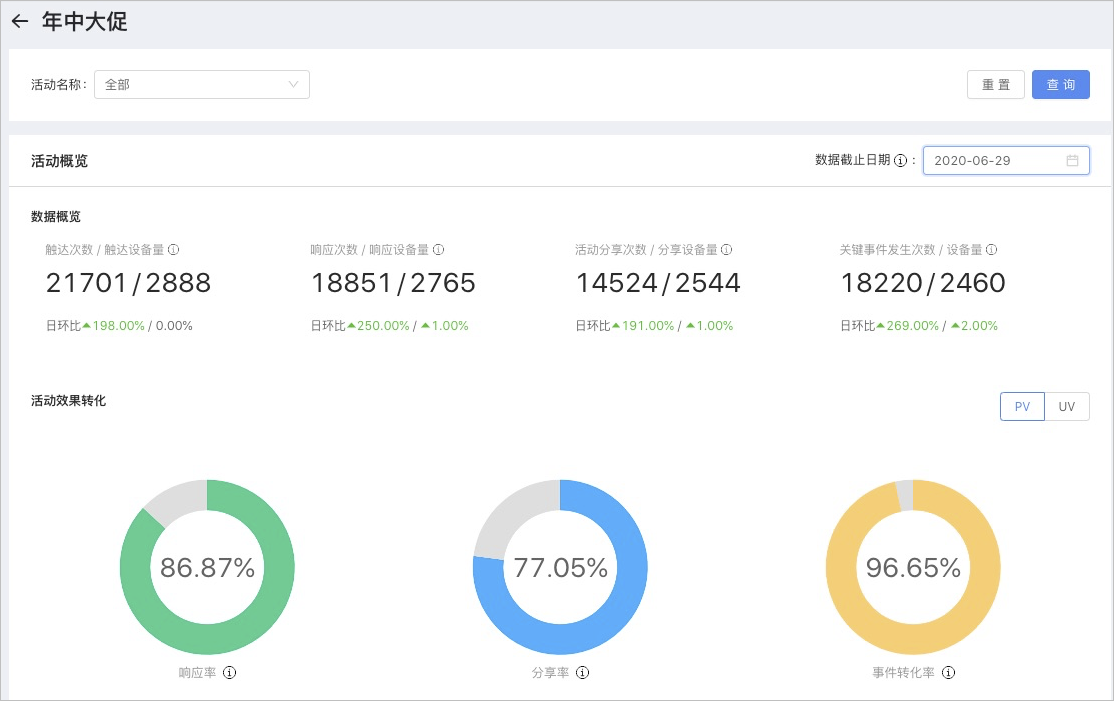
Activity overview
The Activity Overview provides information in three main areas: Data Overview, Activity Performance Conversion, and Activity Performance.
Data overview: All metrics in this section include day-over-day (DoD) information, which shows the percentage change in data compared to the previous day.
Metric
Description
reach count
The sum of display ad exposures and successful push notification deliveries within a specified period.
reached devices
The total number of unique devices that were exposed to any ad creative or successfully received a push notification within a specified period.
response count
The total number of ad clicks and push notification clicks within a specified period.
responding devices
The total number of unique devices that clicked an ad or a push notification within a specified period.
share count
The number of times the share button was clicked on the activity's landing page within a specified period. This metric depends on accurate client-side event tracking and requires that the landing page supports sharing and has the corresponding event tracking implemented.
sharing devices
The number of unique devices that clicked the share button on the activity's landing page within a specified period. This metric also depends on accurate client-side event tracking.
key event occurrences
The number of times the associated Mobile Analysis Service (MAS) key event occurred after a user clicks the activity's ad within a specified period.
key event devices
The number of unique devices that triggered the associated MAS key event after clicking the activity's ad within a specified period.
Activity conversion: The following metrics can be viewed from both Page View (PV) and Unique Visitor (UV) perspectives.
Metric
Description
response rate
The percentage of reached devices that responded to the activity. Calculated as responding devices / reached devices.
share rate
The percentage of responding devices that shared the activity. Calculated as sharing devices / responding devices.
event conversion rate
The percentage of responding devices that triggered the key event. Calculated as key event devices / responding devices.
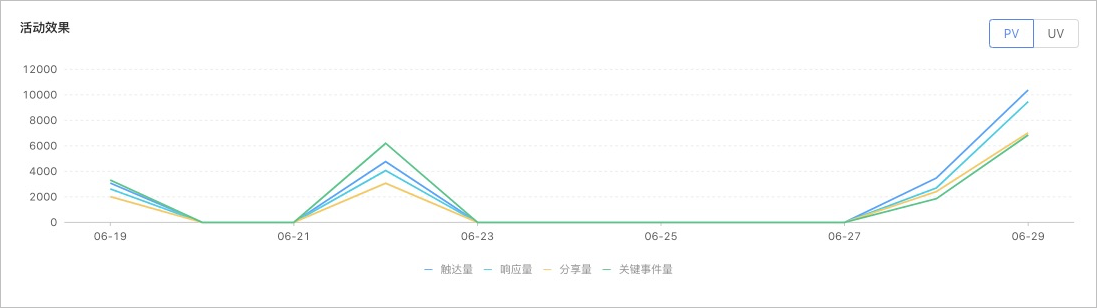
Activity performance: This chart shows the trend of reach counts, response counts, share counts, and key event occurrences since the activity went live. You can view the data from both PV and UV perspectives.
Activity retention
The Campaign Retention feature provides retention data for users after a campaign is launched. Intelligent Delivery allows you to view retention data daily for the first week after the launch, as well as on day 15 and day 30. By default, the retention period displayed is the total number of days from the start of the campaign to the current date, up to a maximum of 30 days.