Cost Analysis
If you want to understand and analyze the fees, compute usage, and storage usage incurred while using MaxCompute, MaxCompute provides a cost analysis feature. This feature lets you drill down from costs to detailed usage data, giving cost-focused managers a more convenient way to analyze expenses and supporting future cost optimization. This topic describes how to use MaxCompute’s cost analysis feature to examine details, proportions, or trends in your costs and usage.
Background information
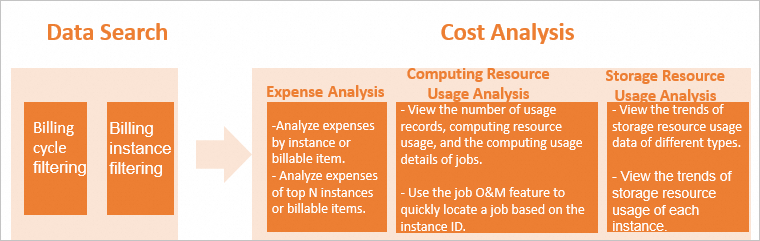
The cost analysis workflow is shown in the following figure:
-
Data search: Select a billing cycle and (optionally) a billing instance to search for data.
-
Perform cost analysis across the following three dimensions:
-
Cost analysis: In a specified billing cycle, analyze total costs by instance or billing item. View cost proportions for each instance or billing item, daily cost trends, and detailed per-cycle costs. This data helps you quickly identify the specific billing cycle, instance, or billing item responsible for unexpected cost spikes and simplifies cost auditing and verification.
-
Compute usage analysis: View the number of usage records, total usage volume, and detailed job compute metrics for one or more instances in a specified billing cycle. For example, if an instance’s (project’s) costs spike unexpectedly, check whether the number of usage records increased sharply. If not, compare compute usage trends to determine if higher usage caused the increase. Then, inspect job-level details (Instance details) to identify which specific job drove the cost growth.
-
Storage usage analysis: View daily trends in storage size (by type) for one or more instances during a billing cycle, along with daily storage trends per instance. This feature lets you quickly see storage volume trends by type and review the average daily storage size for the cycle. Daily storage is calculated as the sum of hourly metered values for each instance divided by 24, so it does not reflect real-time storage volume.
-
Notes
-
This feature currently supports cost analysis only for pay-as-you-go compute and storage. Cost data reflects raw usage details (original prices calculated directly using billing formulas). Due to rounding or precision limitations, reported costs may slightly differ from actual bill amounts. For usage details, see Usage Details. Data for the current day may be incomplete or lower than expected due to metering delays or pending data collection.
-
For billing rules on pay-as-you-go compute costs, see Compute costs (pay-as-you-go). For billing rules on pay-as-you-go storage costs, see Storage costs.
-
Billing item names in cost analysis differ from those on your bill because they are based on metering data classifications. For the mapping, see Cost analysis.
-
Access to the cost analysis feature is controlled through RAM authentication. By default, RAM users and RAM roles have no access. You must grant permissions in RAM. For details, see RAM permissions.
Data search
You can view data from the past 12 months. Records start from May 7, 2023.
-
Log in to the MaxCompute console and select a region in the upper-left corner.
-
In the navigation pane on the left, choose Cost Management > Cost Analysis.
-
On the Cost Analysis page, select a Billing Cycle.
By default, cost analysis shows data for the last 7 days (including today). You can customize the billing cycle, with a maximum span of 31 days.
-
(Optional) In the Billing Instance selector, choose one or more Billing Instance.
Billing Instance refers to the unit used for billing charges—that is, the instance (usually the project name) in the billing details for expenses and costs. By default, if none is specified, all instances are included. You can customize the Billing Instance you want to view and select multiple instances.
NoteInstances with zero total cost during the selected billing cycle do not appear in the list.
Cost analysis
-
On the Cost Analysis page, click Expense Analysis.
-
On the Expense Analysis tab, analyze costs using the following dimensions:
-
By Instance
-
Total Costs in Billing Cycle: A pie chart shows total costs for the selected billing cycle. Hover over the chart to see cost proportions for the top N instances (up to Top 7 + Others). Note that minor discrepancies may occur due to rounding or precision limits.
-
Daily Billing Statistics: A stacked bar chart displays daily costs from the start to end of the billing cycle. Hover over any bar to see the top N instances (up to Top 7 + Others) by cost and proportion, sorted from highest to lowest by default. Use this chart to quickly spot daily cost trends for specific instances.
-
Usage details list: Displays daily fees for each instance and total fees for the billing cycle in a list format. You can click the Details column's View Details for a specific instance to view the fees and cost proportions for each billing item, and quickly identify the billing item with the highest cost.
-
-
By Billable Item
-
Total Costs in Billing Cycle: A pie chart shows total costs for the selected billing cycle. Hover over the chart to see cost proportions for the top N billing items (up to Top 7 + Others). Note that minor discrepancies may occur due to rounding or precision limits.
-
Daily Billing Statistics: A stacked bar chart displays daily costs from the start to end of the billing cycle. Hover over any bar to see the top N billing items (up to Top 7 + Others) by cost and proportion, sorted from highest to lowest by default. Combined with your selected instance(s) in the header search, this chart helps you track daily cost trends by billing item for specific instances.
-
Usage details list: Displays the daily fees for each billing item and the total fees for the billing cycle in a list format. You can also click View Details in the Details column of a billing item to see which instances contributed to the cost of this billing item, along with each instance's fee and cost proportion, helping you quickly locate the instance with the highest cost.
NoteThe Specifications Type values in the details list include the following:
-
OdpsStandard: Pay-as-you-go Standard Edition. For details, see Pay-as-you-go Standard Edition.
-
OdpsSpot: Pay-as-you-go Spot Edition. For details, see Pay-as-you-go Spot Edition.
-
OdpsPlusStandard: Subscription Standard compute resource. For details, see Subscription Standard Edition.
-
Cost analysis uses billing item names from metering usage details, which differ from those in the Fee Hub detailed bill. The mapping is as follows:
Cost Analysis Billing Item Name
Fee Hub Detailed Bill Billing Item Name
Fee Hub Detailed Bill Billing Item Code
ComputationSql
-
SQL job compute
-
Spot SQL job compute
-
odps_computation
-
odps_computation_sql_spot
ComputationSqlOTS
-
OTS external table (pay-as-you-go)
-
Spot OTS foreign table job compute
-
mc_external_table_ots
-
odps_external_table_ots_spot
ComputationSqlOSS
-
OSS external table (pay-as-you-go)
-
Spot OSS foreign table job compute
-
mc_external_table_oss
-
odps_external_table_oss_spot
spark
-
Spark job compute
-
Spot Spark job compute
-
odps_computation_spark
-
odps_computation_mars_spot
mars
-
Data science (Mars) pay-as-you-go
-
Spot Mars job compute
-
odps_computation_mars
-
odps_computation_mars_spot
MapReduce
-
MR job compute
-
Spot MapReduce job compute
-
CUUsage
-
odps_computation_mr_spot
Storage
-
Storage
-
Storage
RecycleBinStorage
-
Backup and recovery storage
-
RecycleBinStorage
-
-
Compute usage analysis
-
On the Cost Analysis page, click Computing Resource Usage Analysis.
-
On the Expense Analysis tab, perform compute usage analysis:
-
Metering types included in compute usage data are:
-
ComputationSql: Metering data for SQL jobs operating on internal tables.
-
ComputationSqlOTS: Metering data for SQL jobs operating on OTS foreign tables.
-
ComputationSqlOSS: Metering data for SQL jobs operating on OSS foreign tables.
-
MapReduce: Metering data for MapReduce jobs.
-
spark: Metering data for Spark jobs.
-
mars: Metering data for Mars jobs.
-
-
Number of Usage Records:
A line chart shows trends in the total number of records per data type in the usage details. Usage record count equals job count. A single job that processes both internal and foreign tables generates two usage records.
-
Computing Resource Usage:
A line chart shows compute volume trends by job type. Usage volume falls into two categories:
-
Scanned data volume (unit: GB): Includes ComputationSql, ComputationSqlOTS, and ComputationSqlOSS. These are billed by scanned volume. Compute usage =
scanned volume × complexity. Complexity is fixed at 1 for ComputationSqlOTS and ComputationSqlOSS. -
CU-hour volume (unit: CU-hour): Includes MapReduce, spark, and mars. These are billed by CU-hour.
-
-
Usage details list:
A table shows detailed job usage, sorted by usage volume from high to low by default, letting you quickly identify top-consuming jobs. You can view job information from either the Instance or Signature perspective (jobs from the same script share the same Signature).
-
By Instance ID:
The table includes: Instance ID, Specifications Type, Metering Type, Job Owner, Project, Submitted At, End Time, Signature, Computing Resource Usage.
Click a target Instance ID to go to Jobs for more job information.
Specifications Type maps to sale specifications as follows:
-
OdpsStandard: Corresponds to Pay-as-you-go Standard Edition. For details, see Pay-as-you-go Standard Edition.
-
OdpsSpot: Pay-as-you-go Spot Edition. For details, see Pay-as-you-go Spot Edition.
-
OdpsPlusStandard: Subscription Standard compute resource. For details, see Subscription Standard Edition.
-
-
By Signature:
The table includes: Signature, Included Instance IDs, Total Compute Usage Volume.
Hover over the Included Instance IDs column for a Signature to see all associated Instance IDs. Click any ID to go to Jobs for more job information.
-
-
Storage usage analysis
-
On the Cost Analysis page, click Storage Resource Usage Analysis.
-
On the Storage Resource Usage Analysis tab, perform storage usage analysis:
-
Storage type trends (GB):
A line chart shows daily trends in storage size (total, Standard, and backup) for one or more instances during the selected billing cycle.
-
Per-instance storage usage (GB):
A stacked bar chart shows daily trends in storage size by type for each instance.
-
Details list:
A table shows daily storage size details by type.
-
References
For details on cost optimization and improving resource utilization, see Compute resource configuration optimization.