In addition to adding content while editing a Q Report, you can add dashboard charts, Q Chat Data results, and Q Insights results directly from their respective pages without regenerating them.
Prerequisites
-
You have edit permissions for the Q Report to which you want to add content.
-
You have the required permissions for related modules:
-
To add a dashboard chart to a Q Report, you need preview permissions for that dashboard.
-
To add a Q Chat Data result to a Q Report, you need Q Chat Data permissions.
-
To add a dashboard Q Insights result to a Q Report, you need dashboard Q Insights permissions.
-
Limits
-
A report supports a maximum of 20 dashboard chart components.
-
You cannot add metric decomposition trees, metric relationship graphs, or custom components.
Add Dashboard Charts
Add dashboard charts to a Q Report from the dashboard preview page.
You cannot add metric decomposition trees, metric relationship graphs, or custom components.
Add a Single Chart
-
On the dashboard management page, click the Preview (
 ) icon or the View in New Window (
 ) icon next to the desired dashboard to open the dashboard preview page.
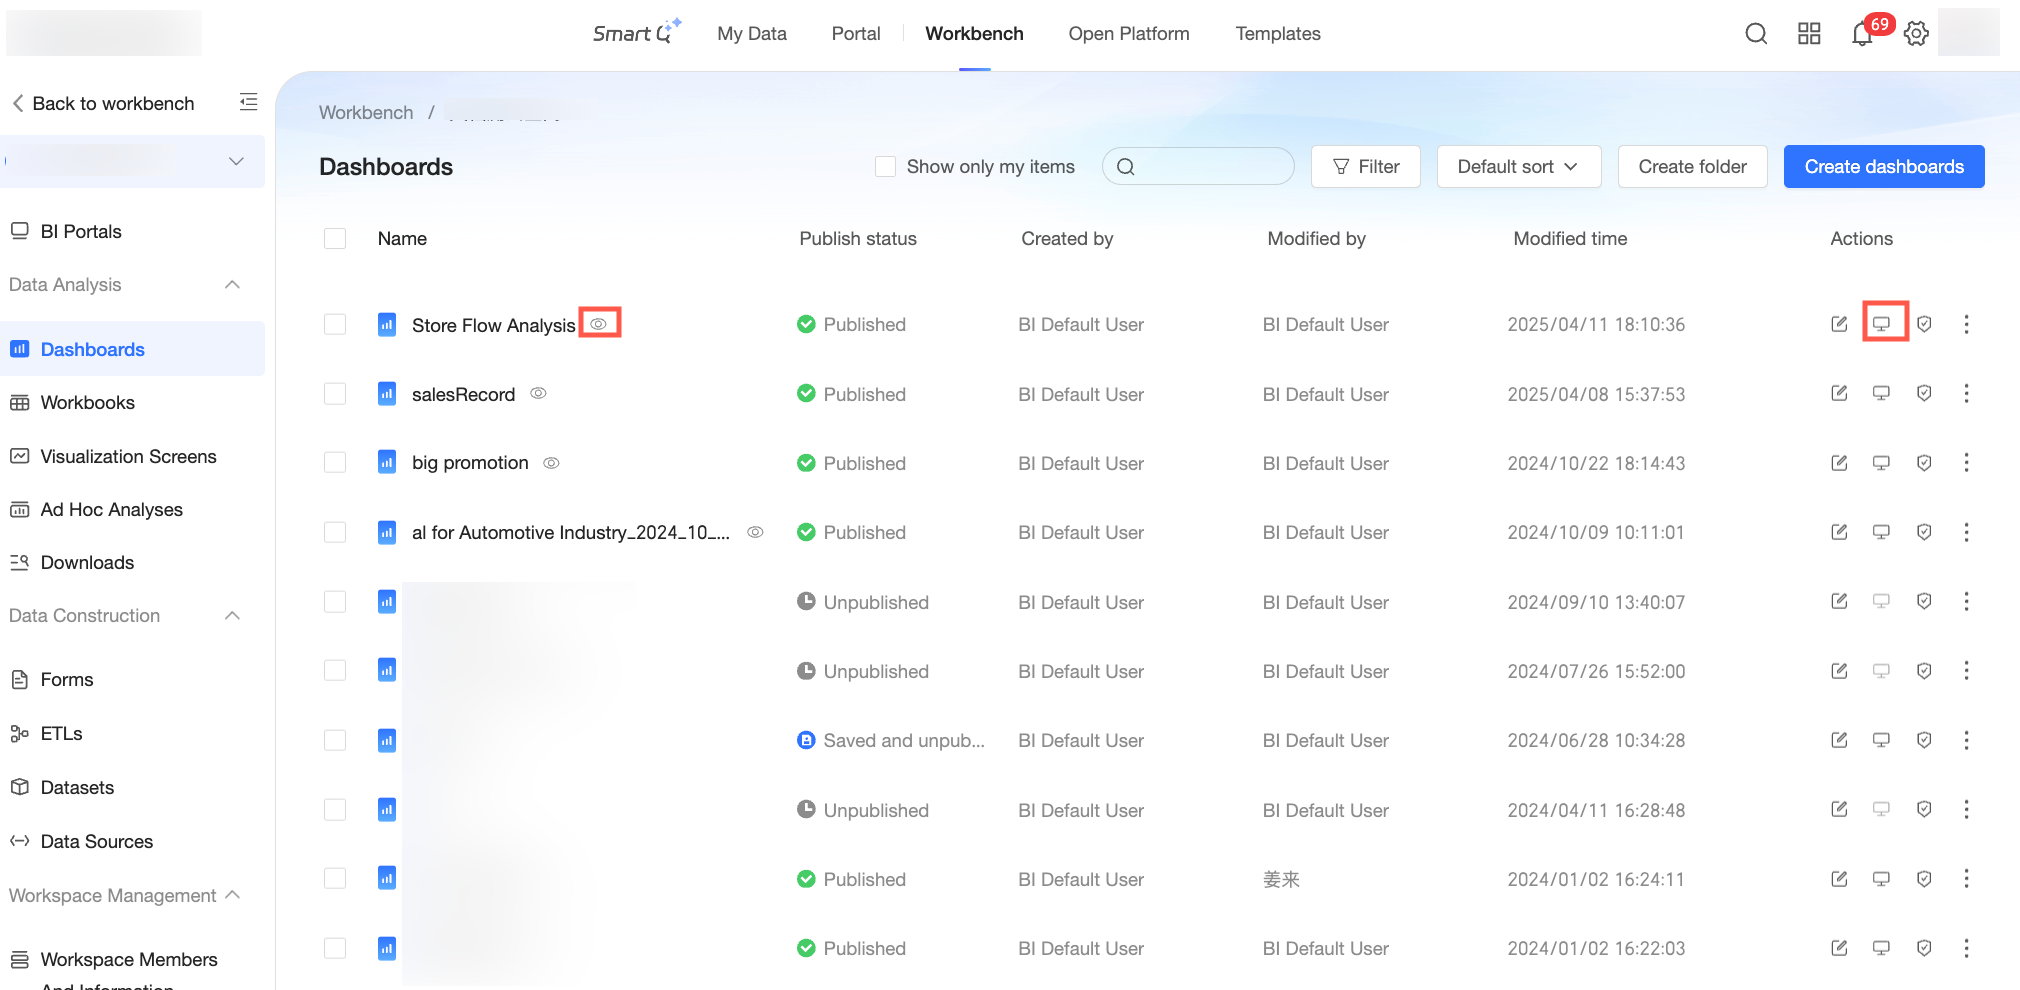
-
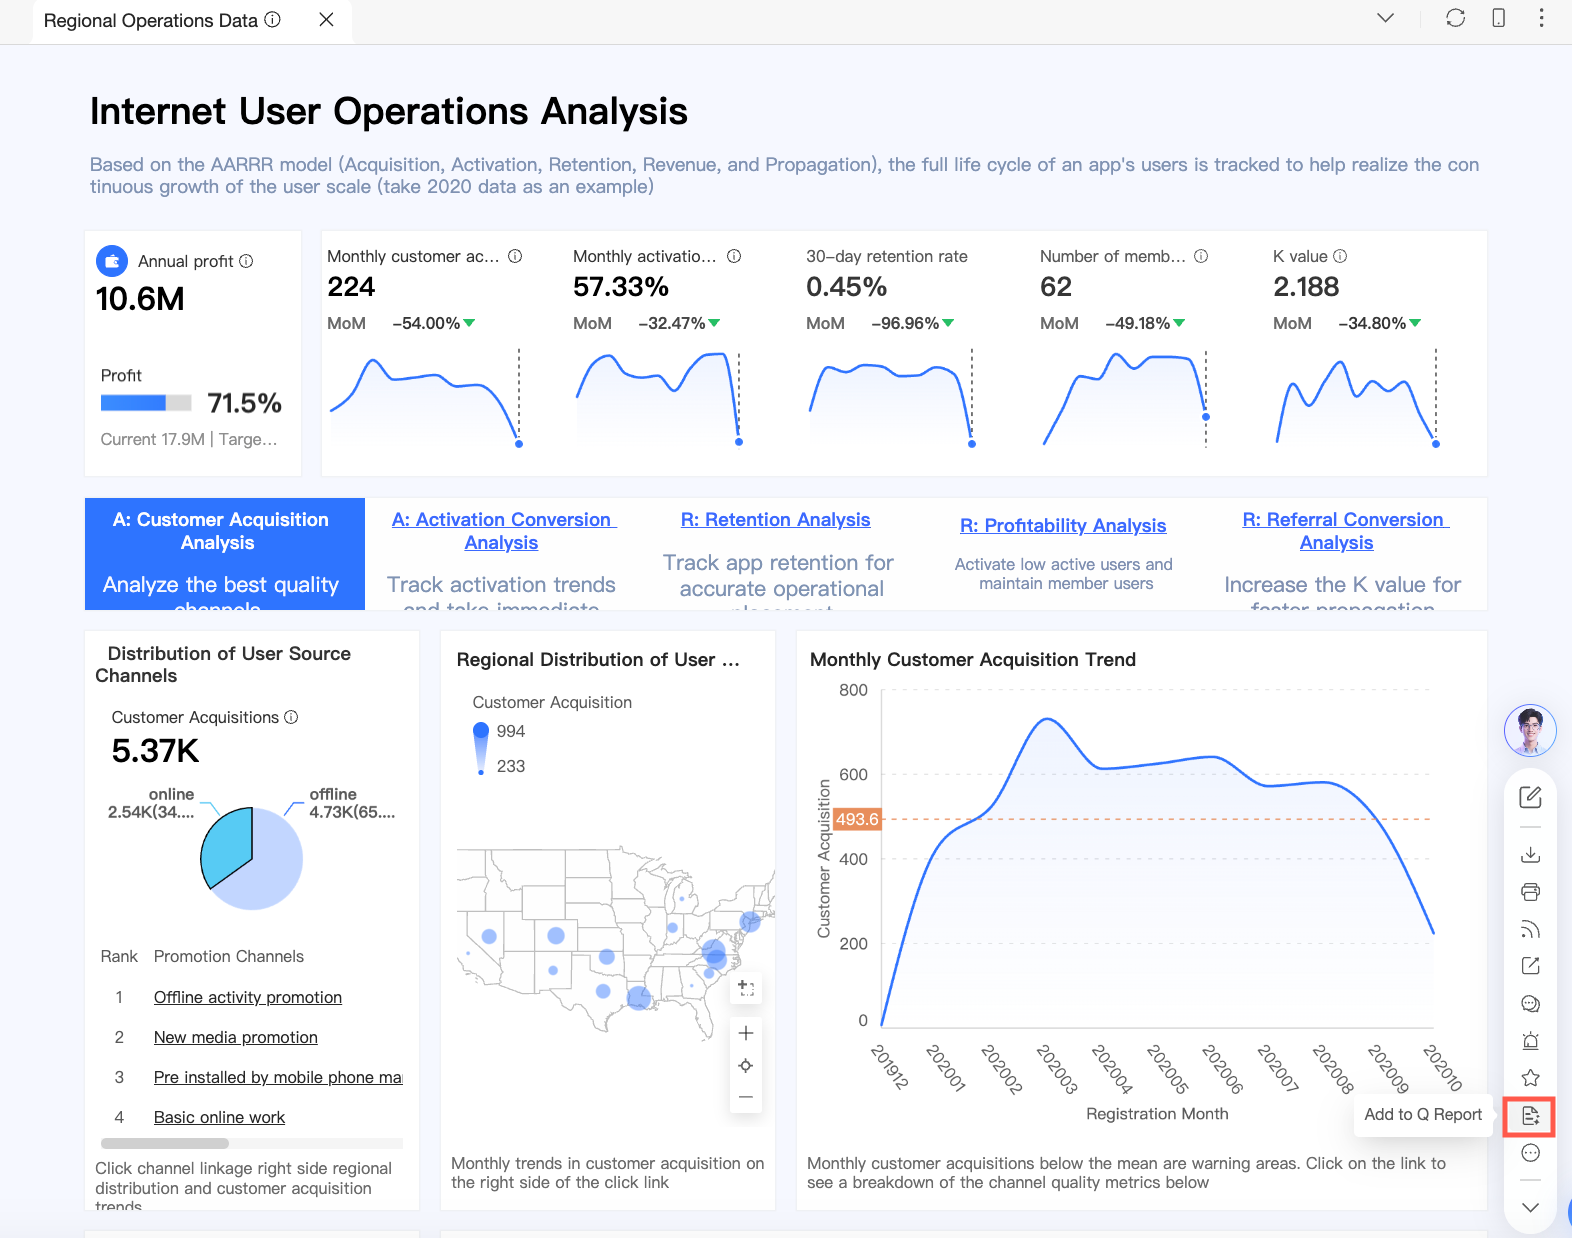
On the dashboard preview page, click the
 icon in the top-right corner of the desired chart and select Add to Q Report.
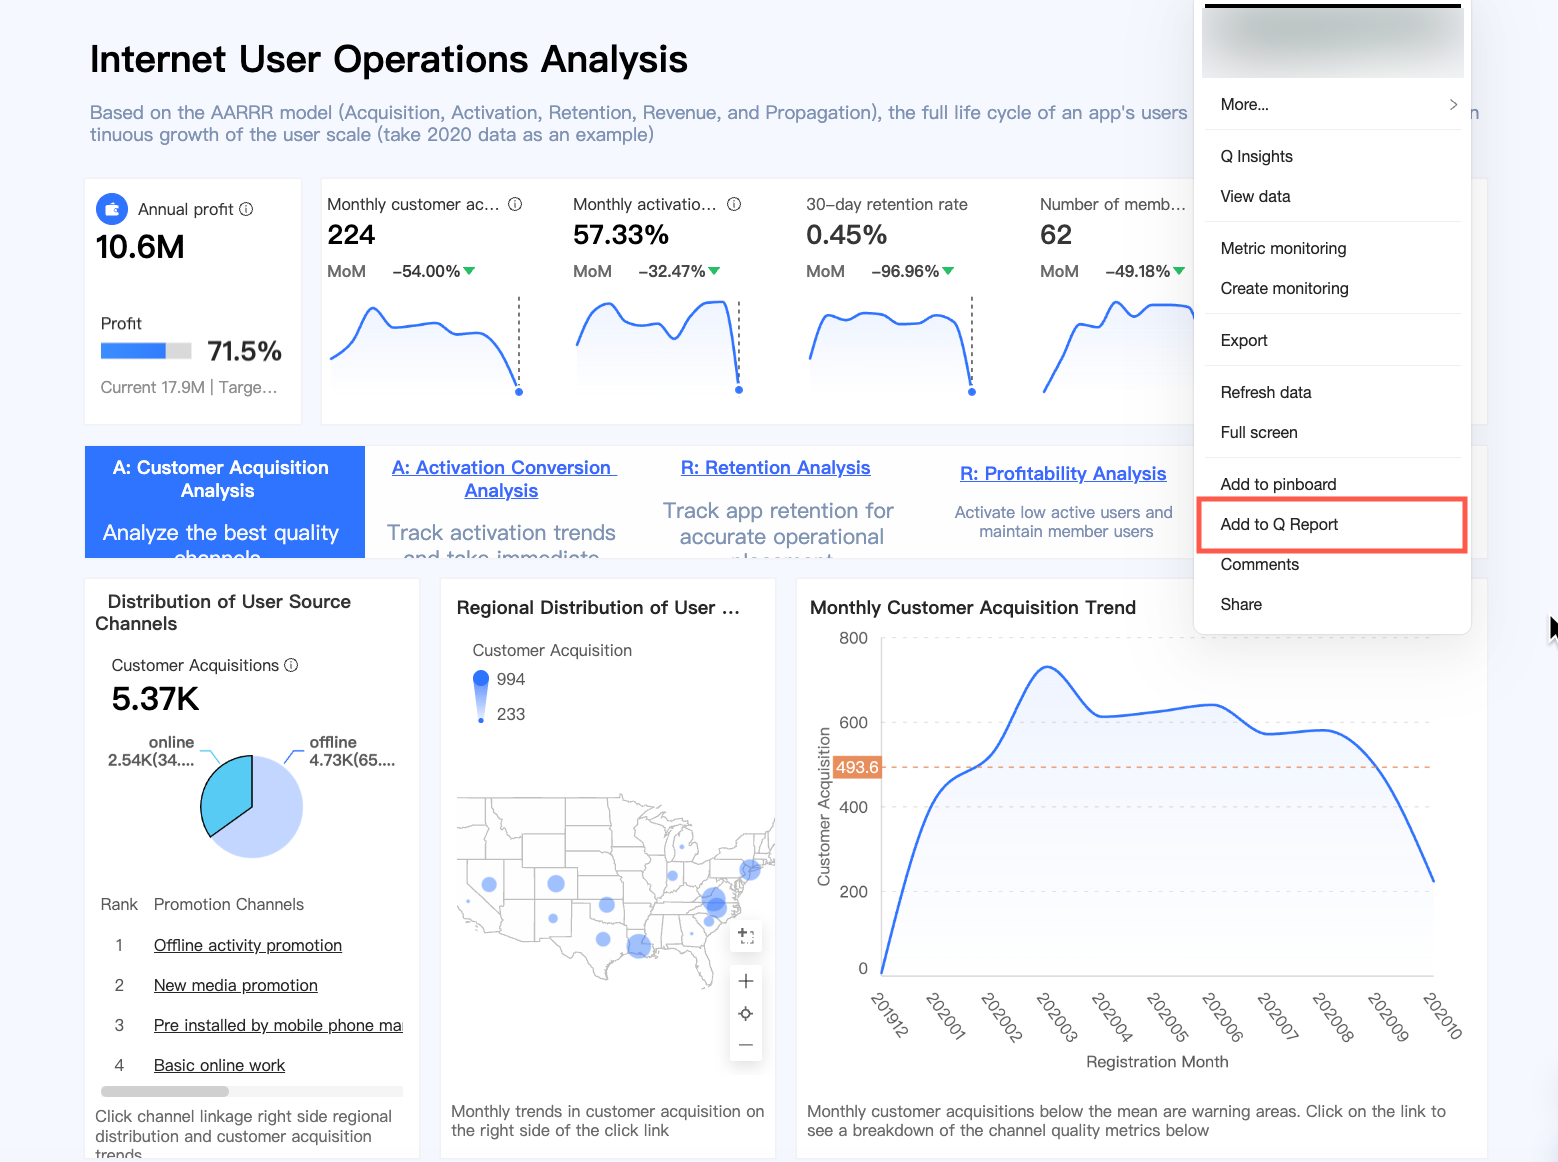
You can also apply filter values before adding a chart.
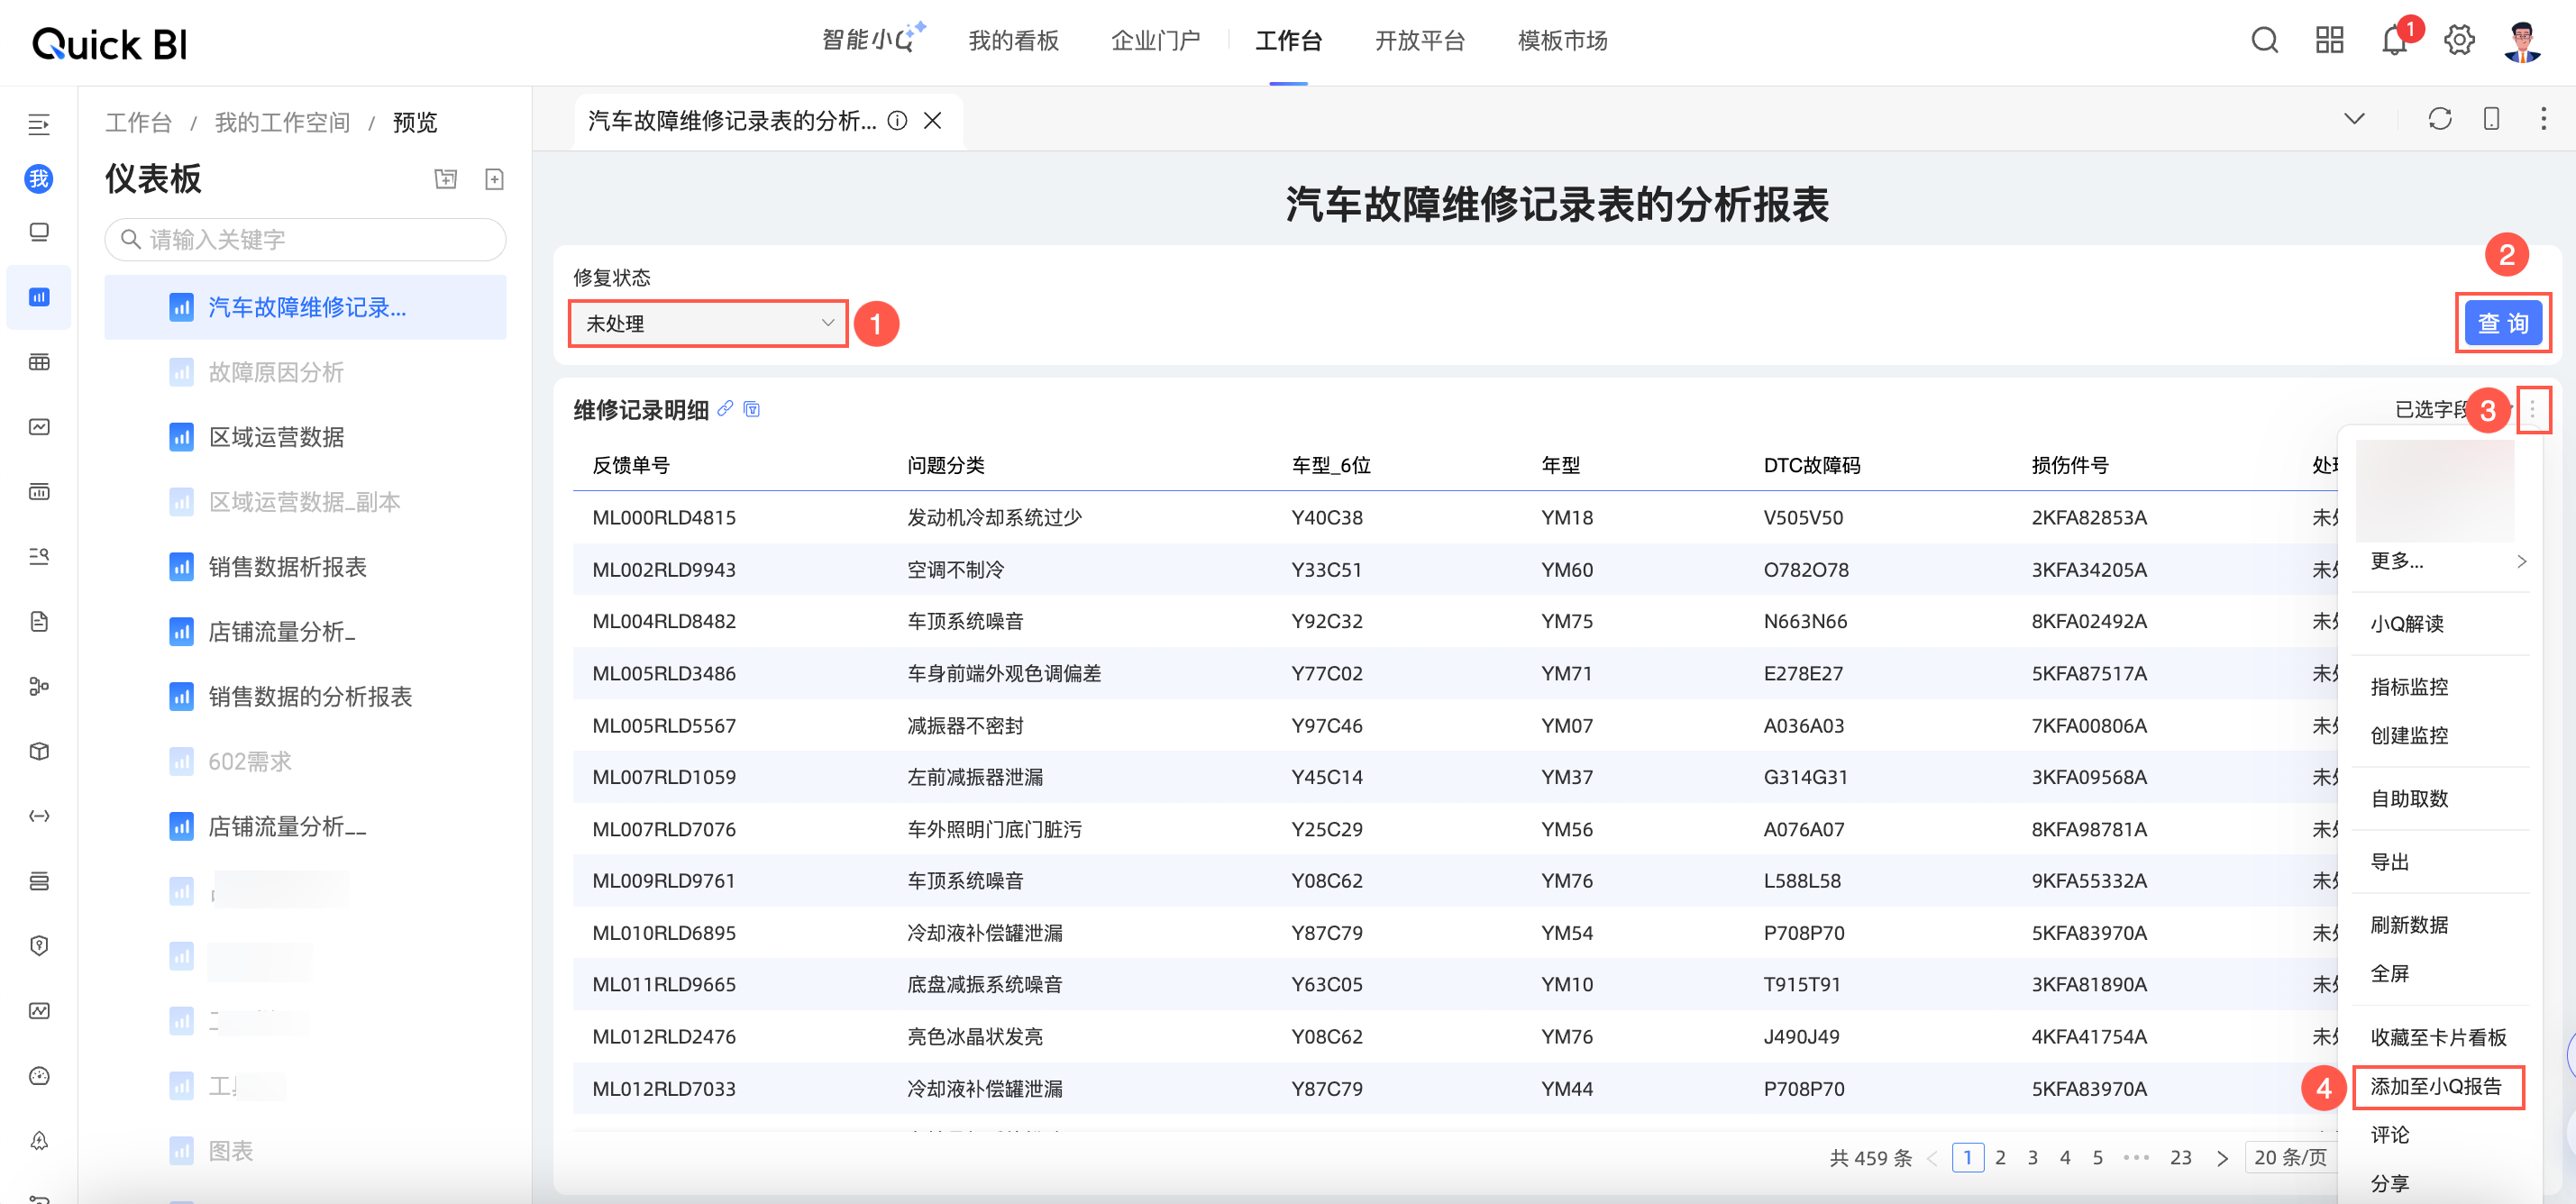
For example, to add a detail table with the status “Unprocessed” to your report, use the query control to filter the data. Click Query, then click the
 icon in the top-right corner of the desired chart and select Add to Q Report. Note
When you update data, time-based and non-time-based filters behave differently:
-
Time-based filters clear any manually selected values during updates and revert to their default values if configured.
-
Non-time-based filters remain unchanged during data updates and are not affected by changes to the default values on the original chart.
-
-
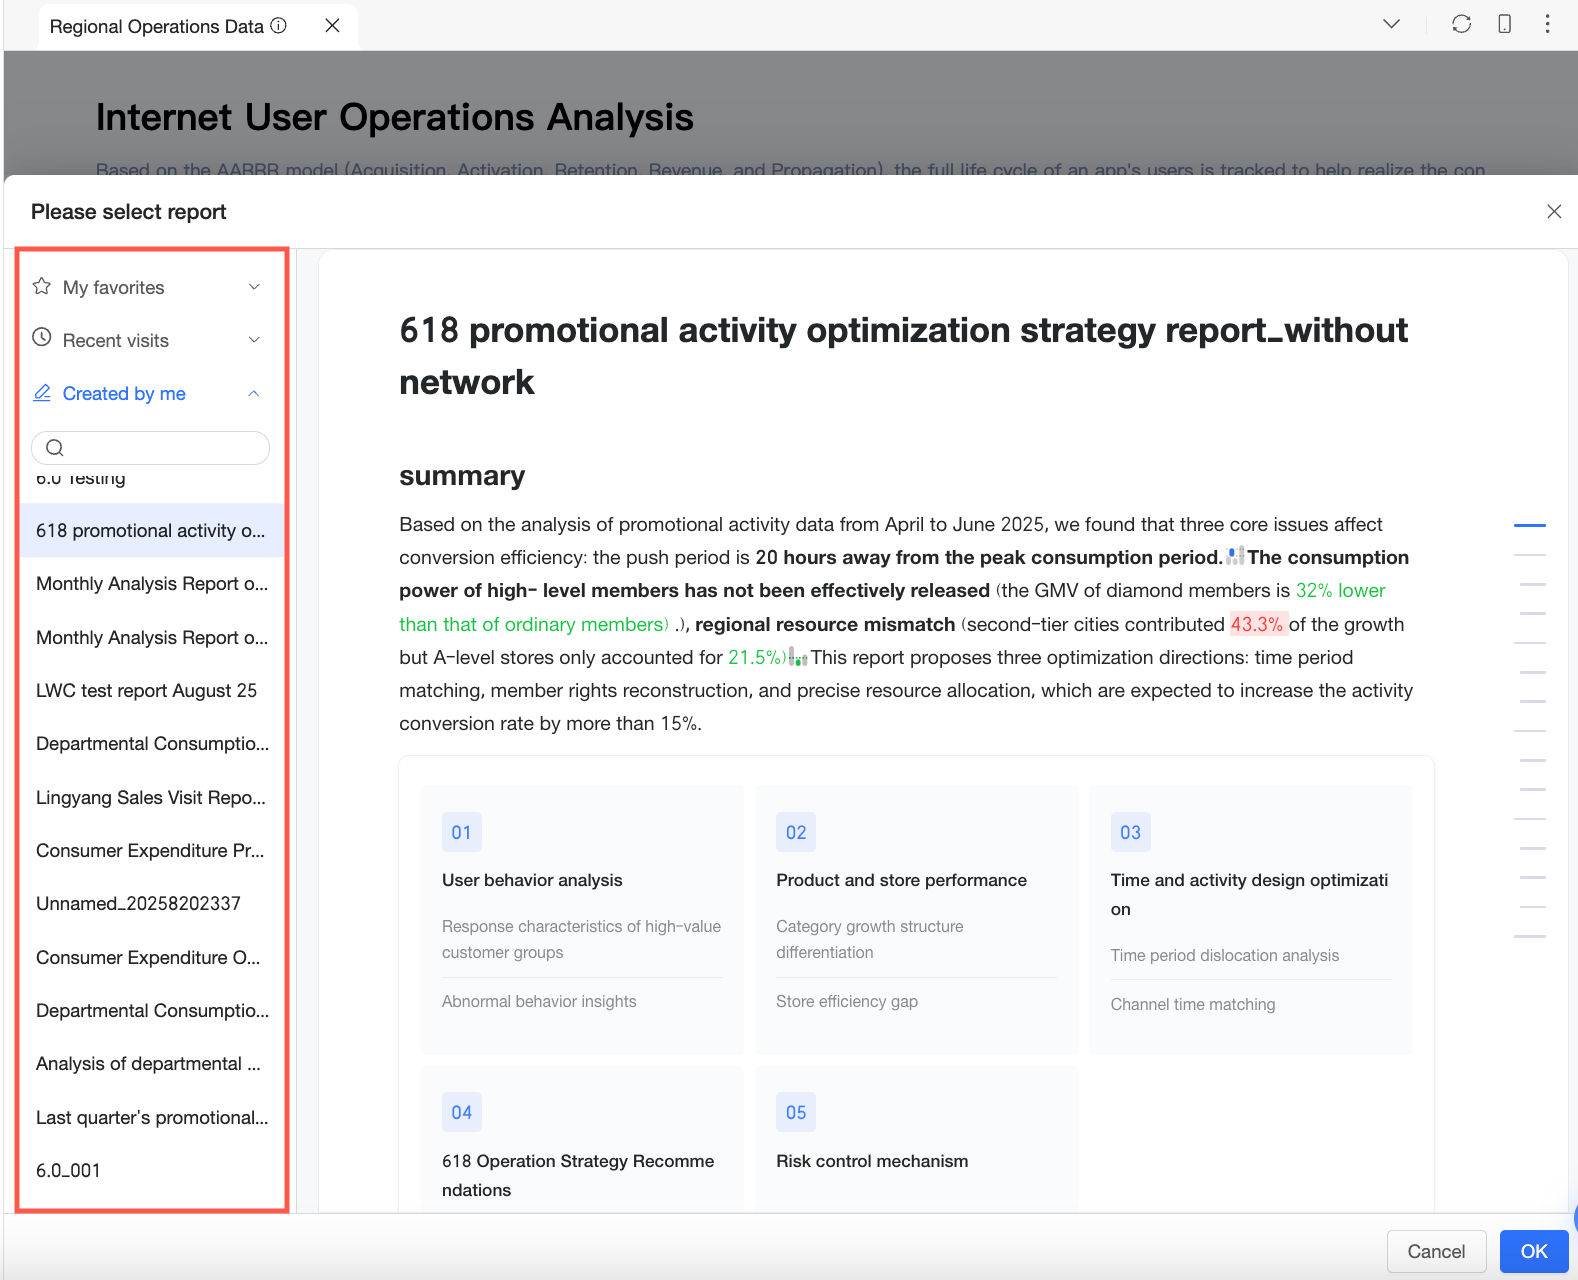
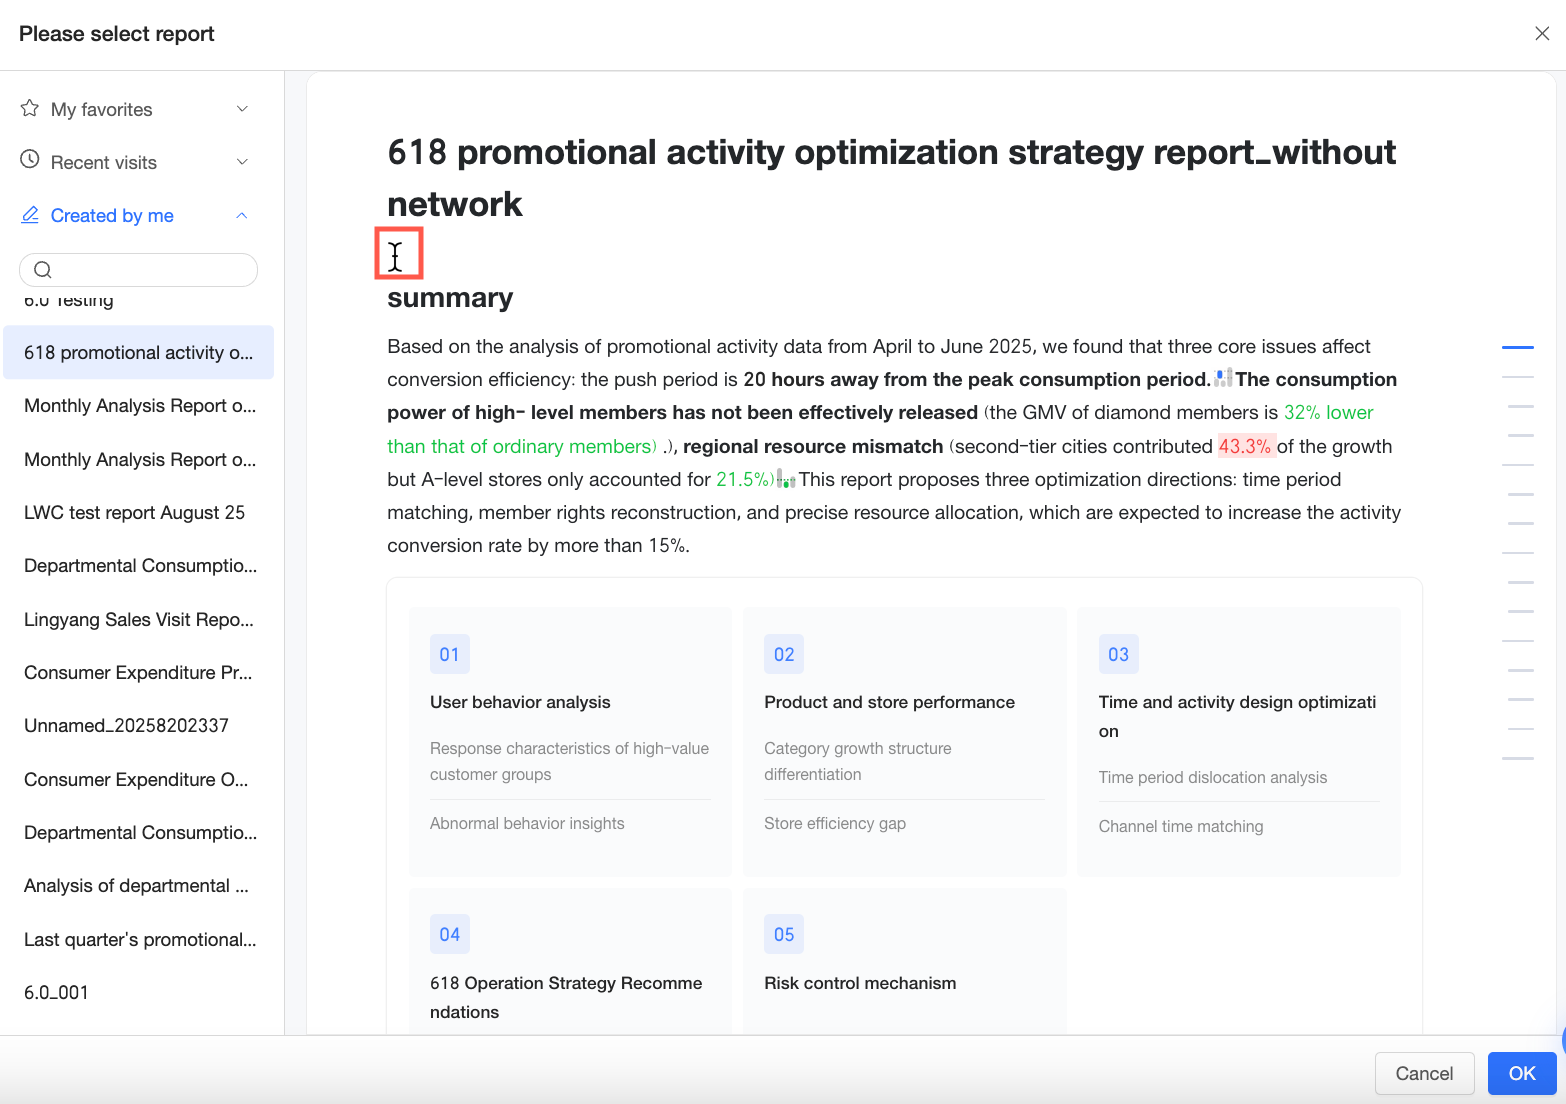
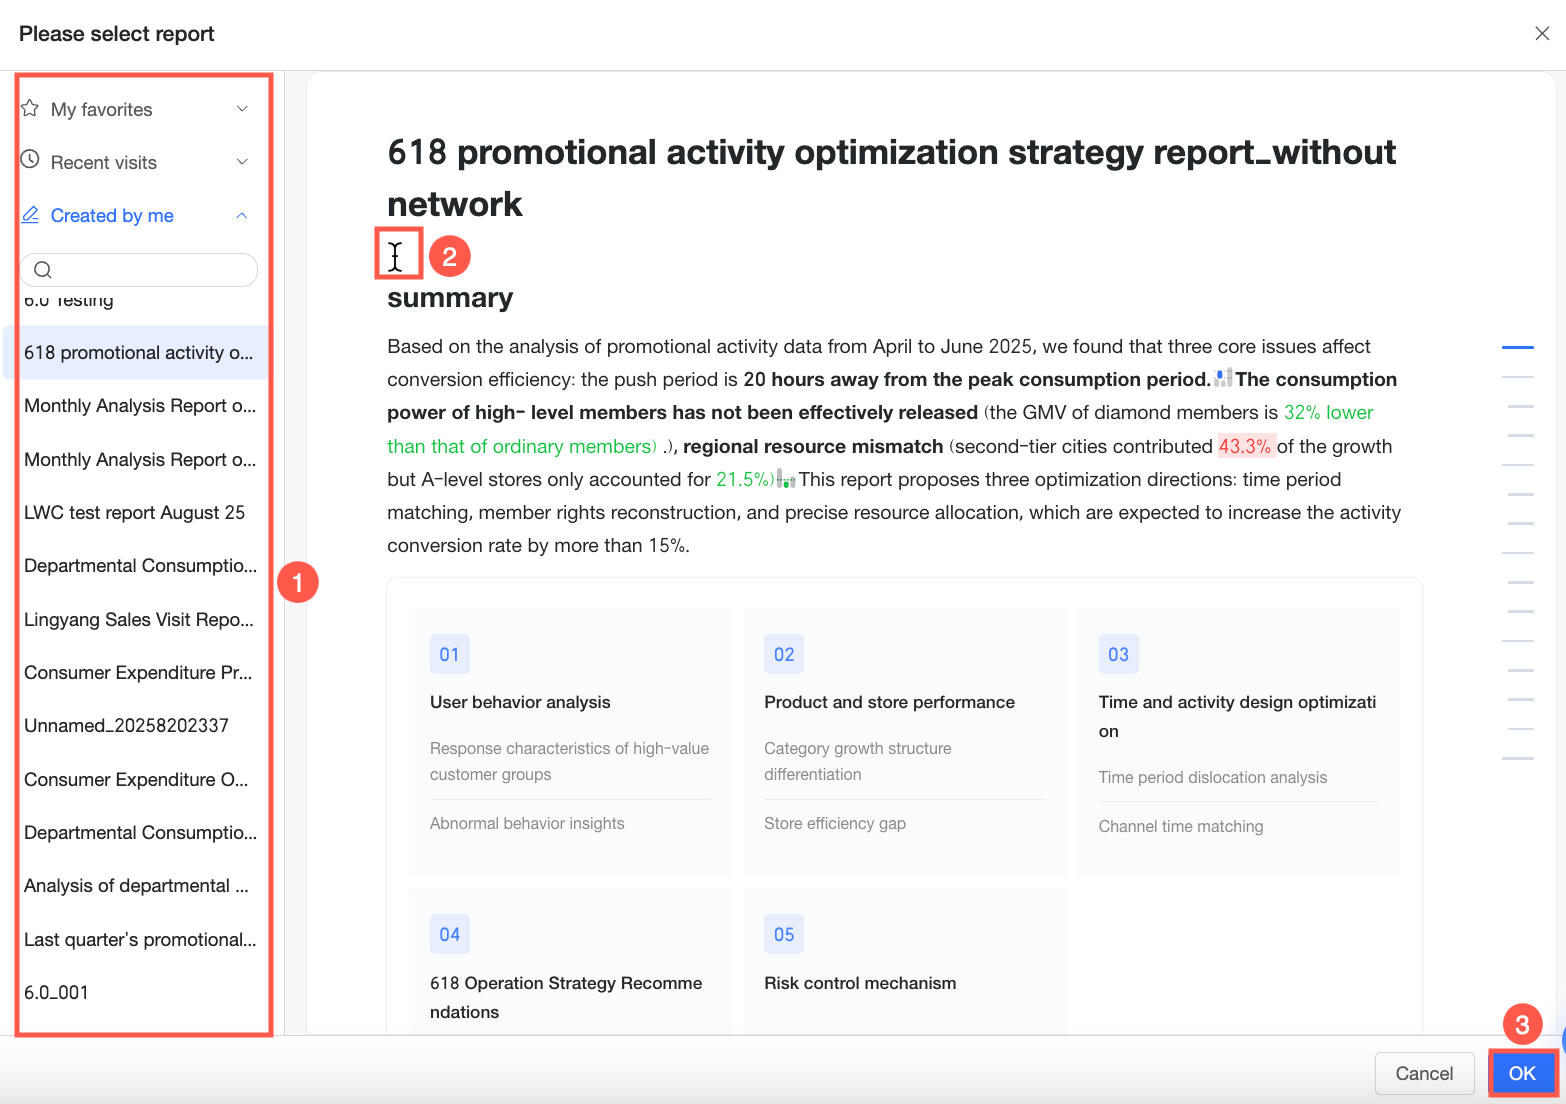
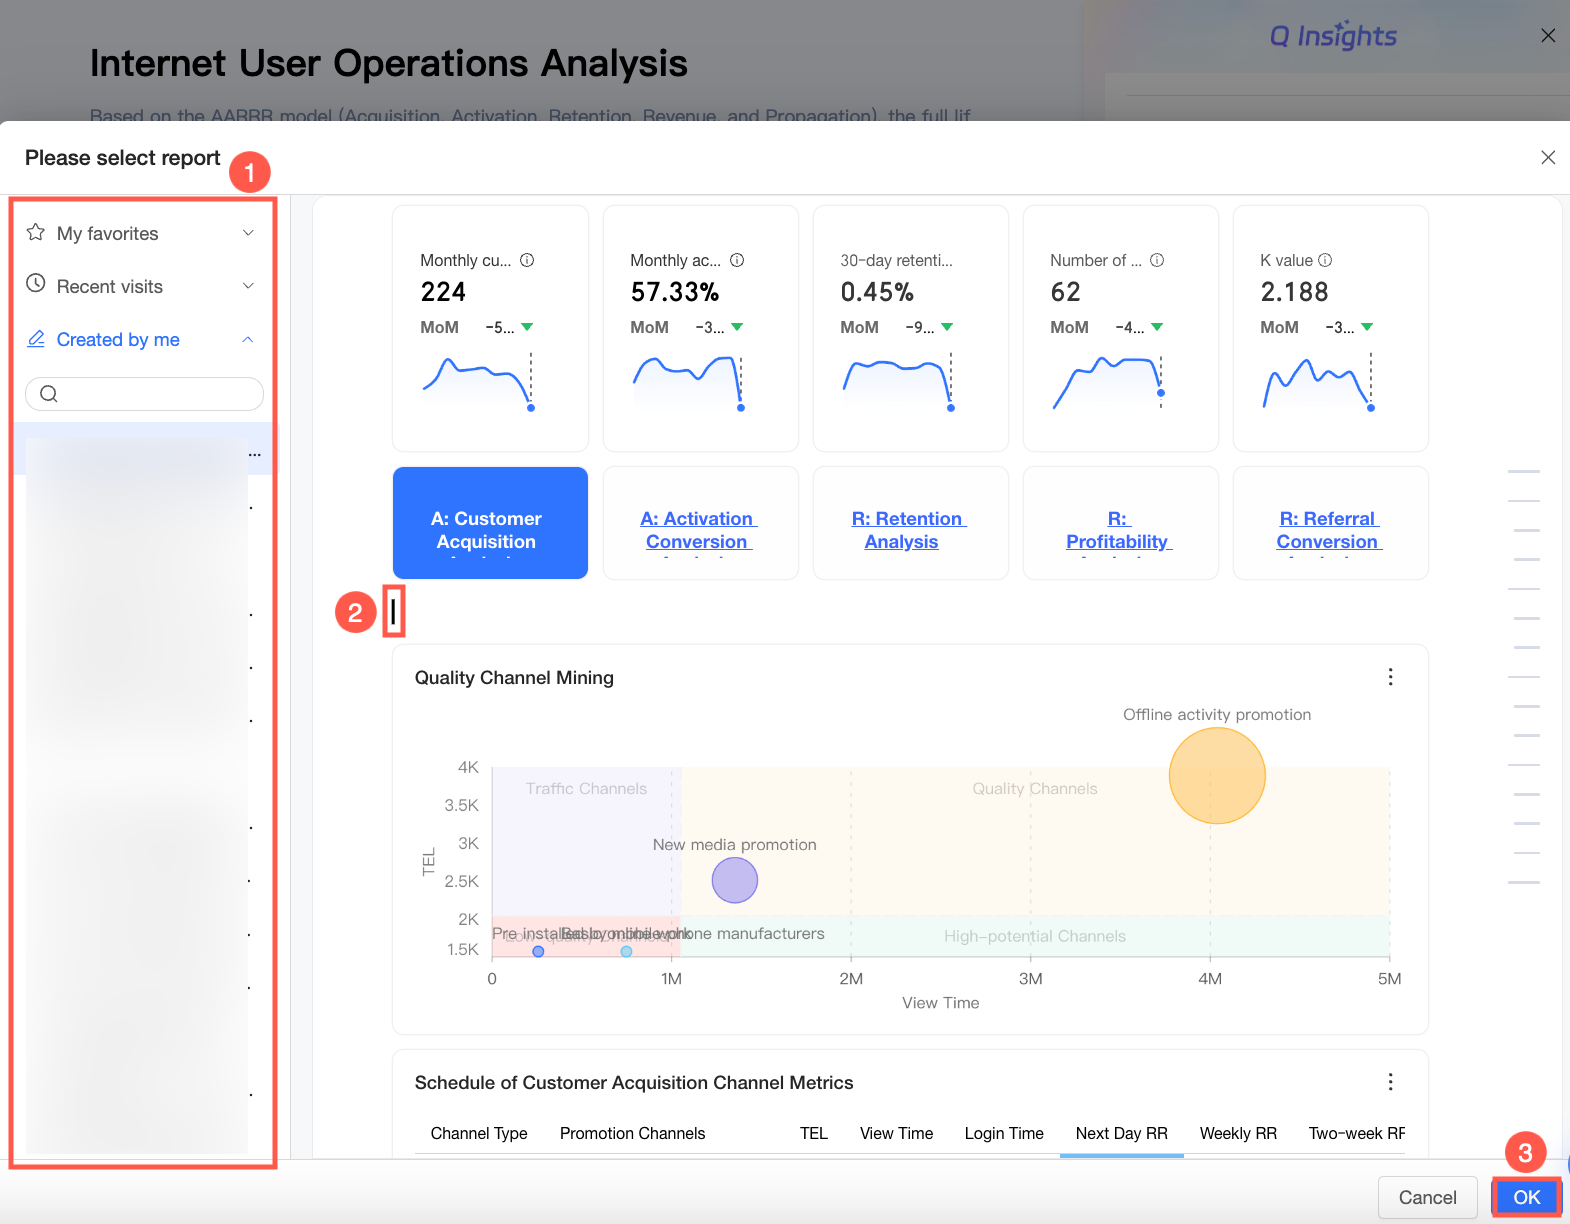
Select a report.
You can choose from My Favorites, Recently Accessed, or Created by Me.
You can also use the search function to locate a report.
After selecting a report, use your cursor to specify where to insert the chart component.
-
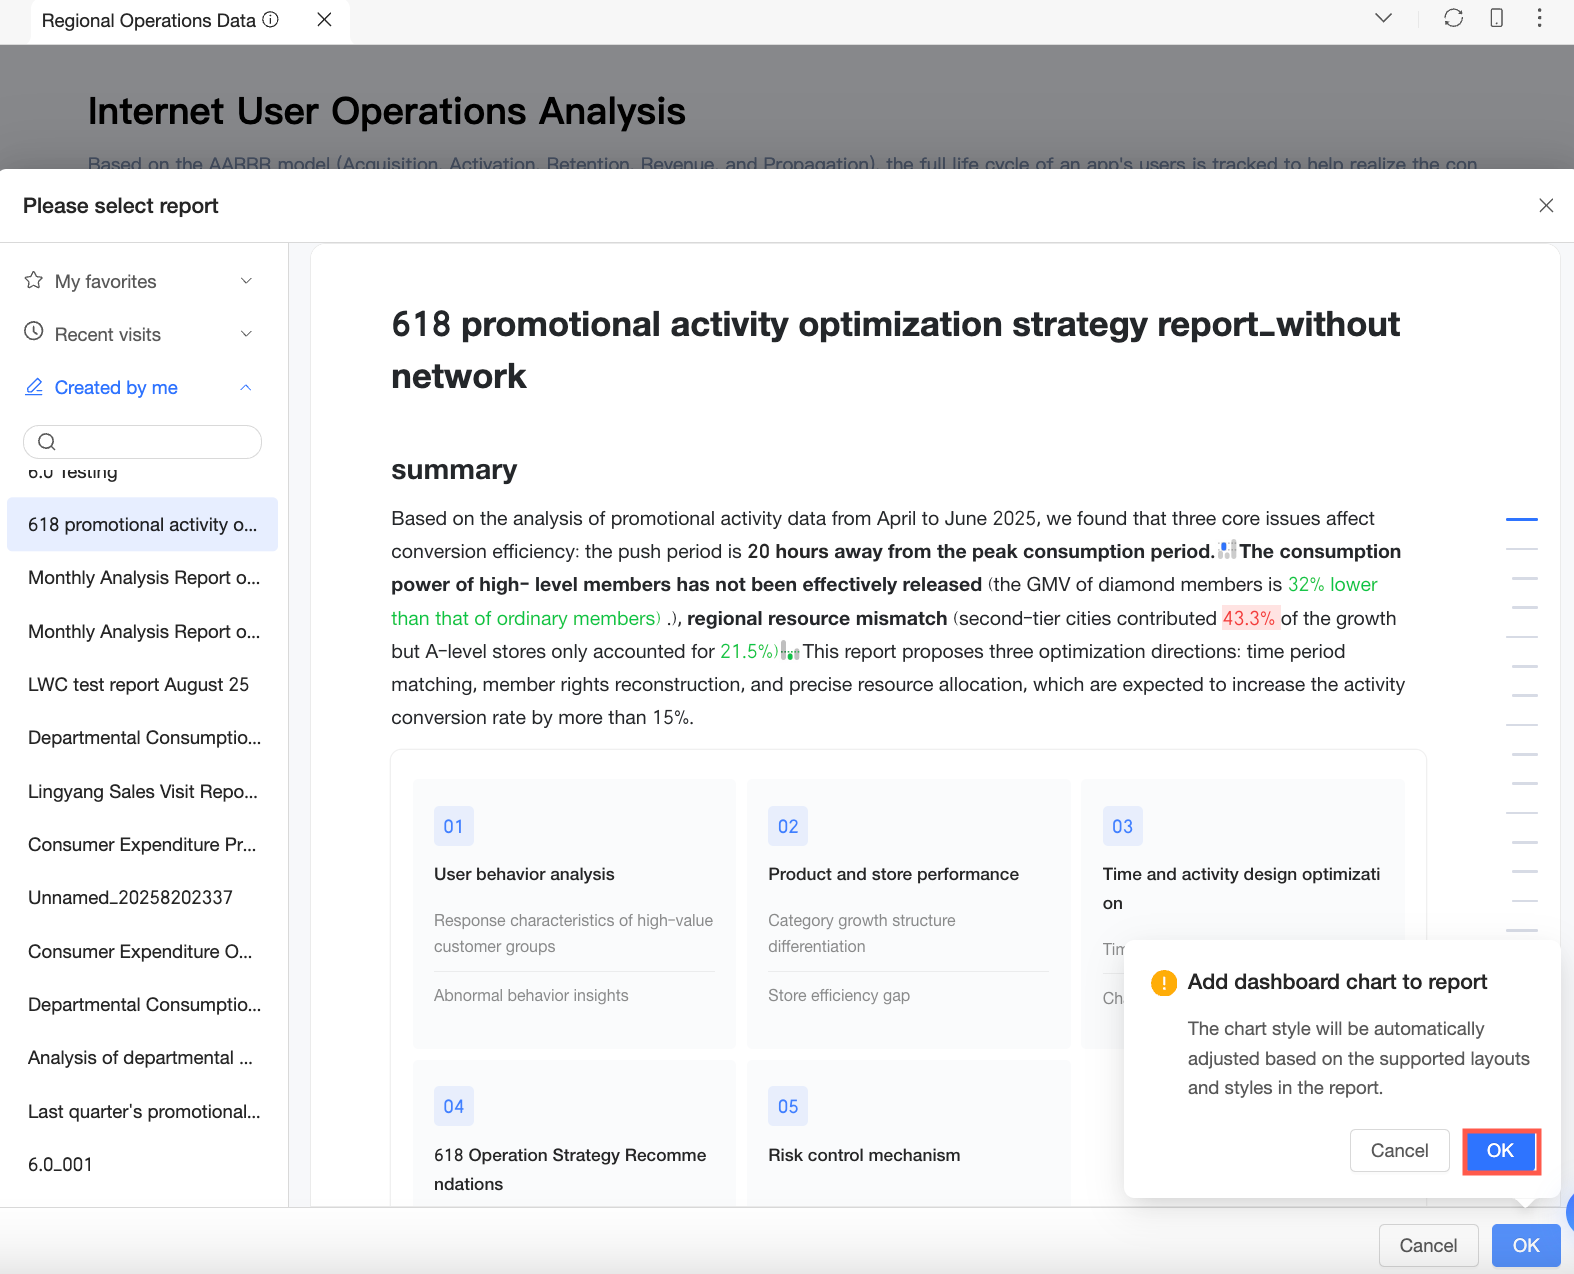
Click OK, and then click OK again in the confirmation dialog box.
NoteAfter you add a chart, it updates automatically from the source dashboard. You can detach it to stop syncing with the source.
-
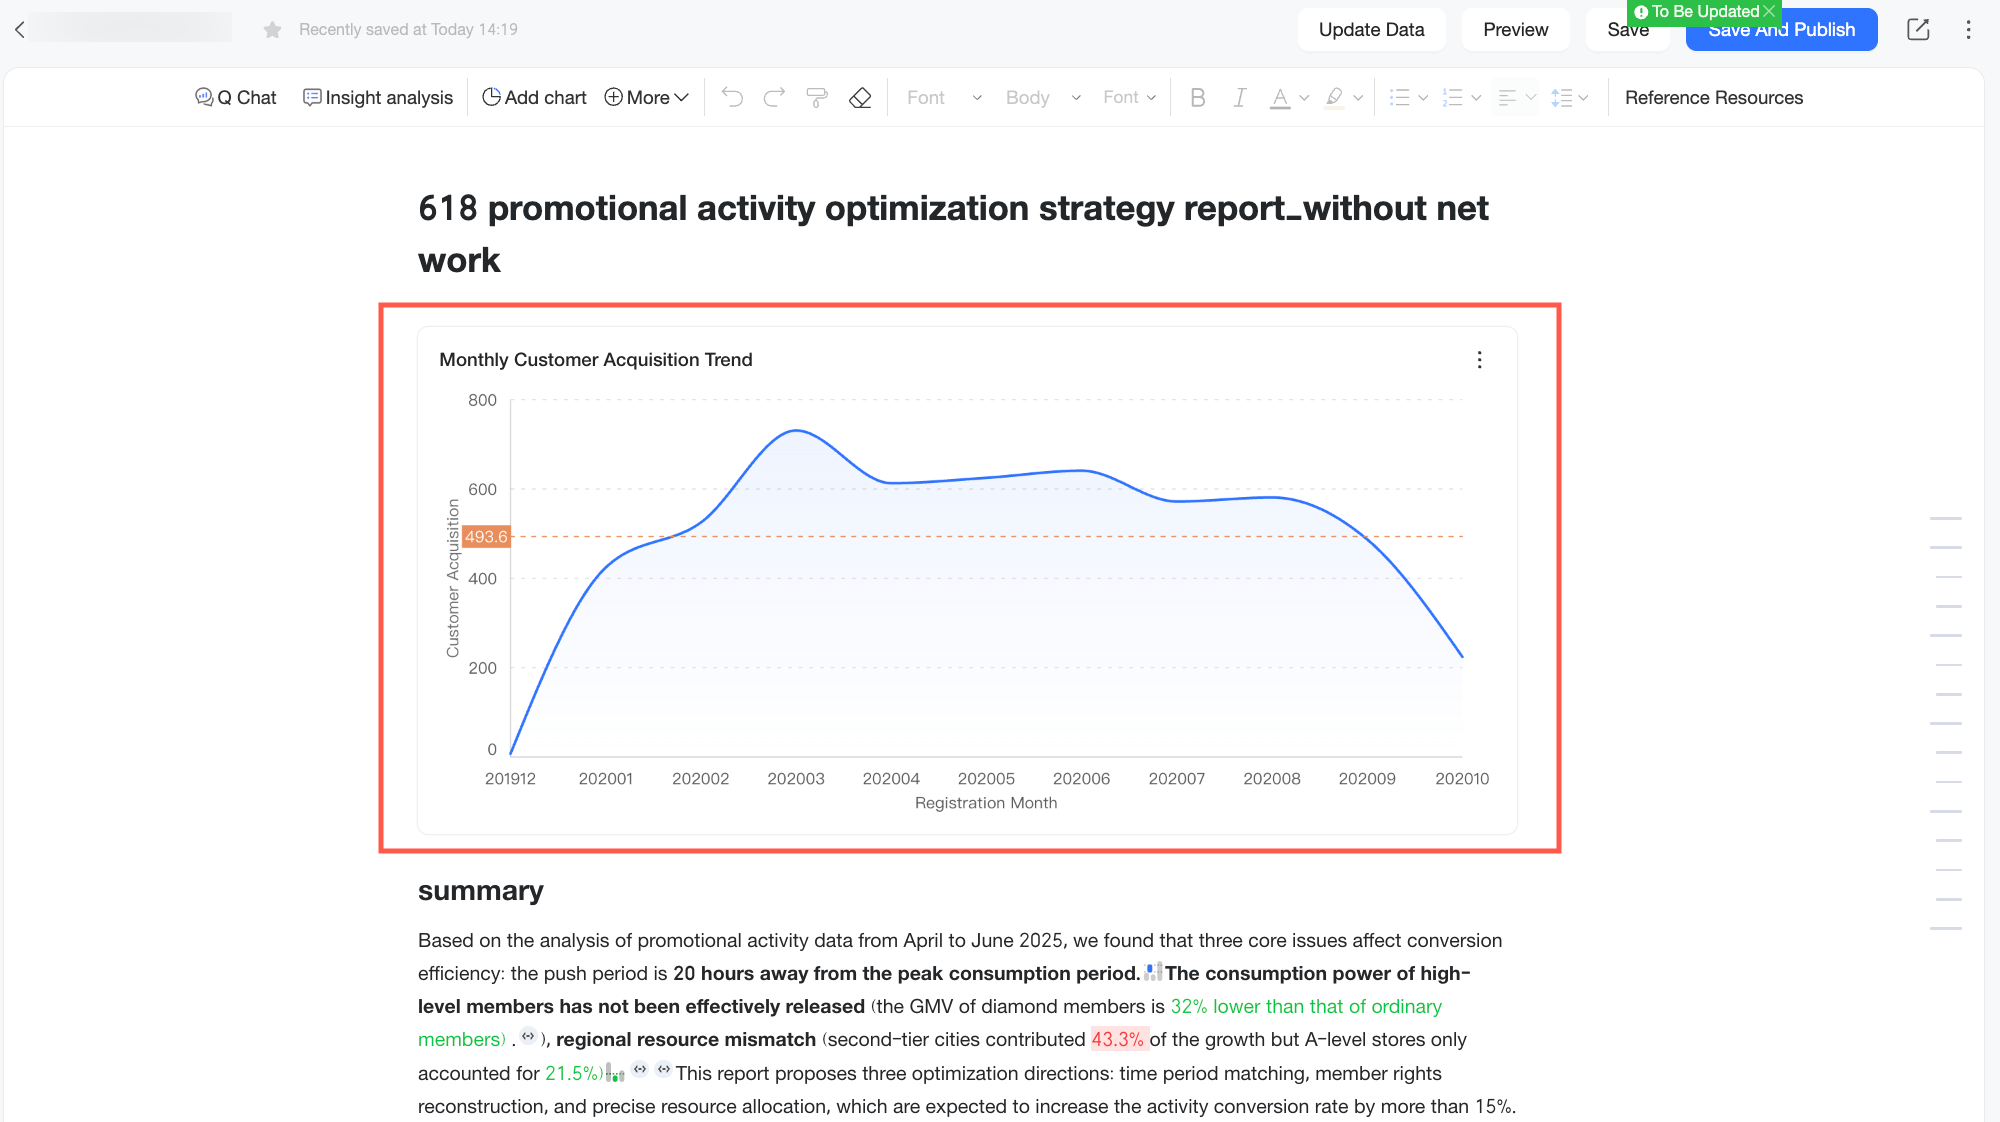
After the chart is added, you can view it in the Q Report.

Add Multiple Dashboard Charts
-
On the dashboard management page, click the Preview (
) icon or the View in New Window () icon next to the desired dashboard to open the dashboard preview page. -
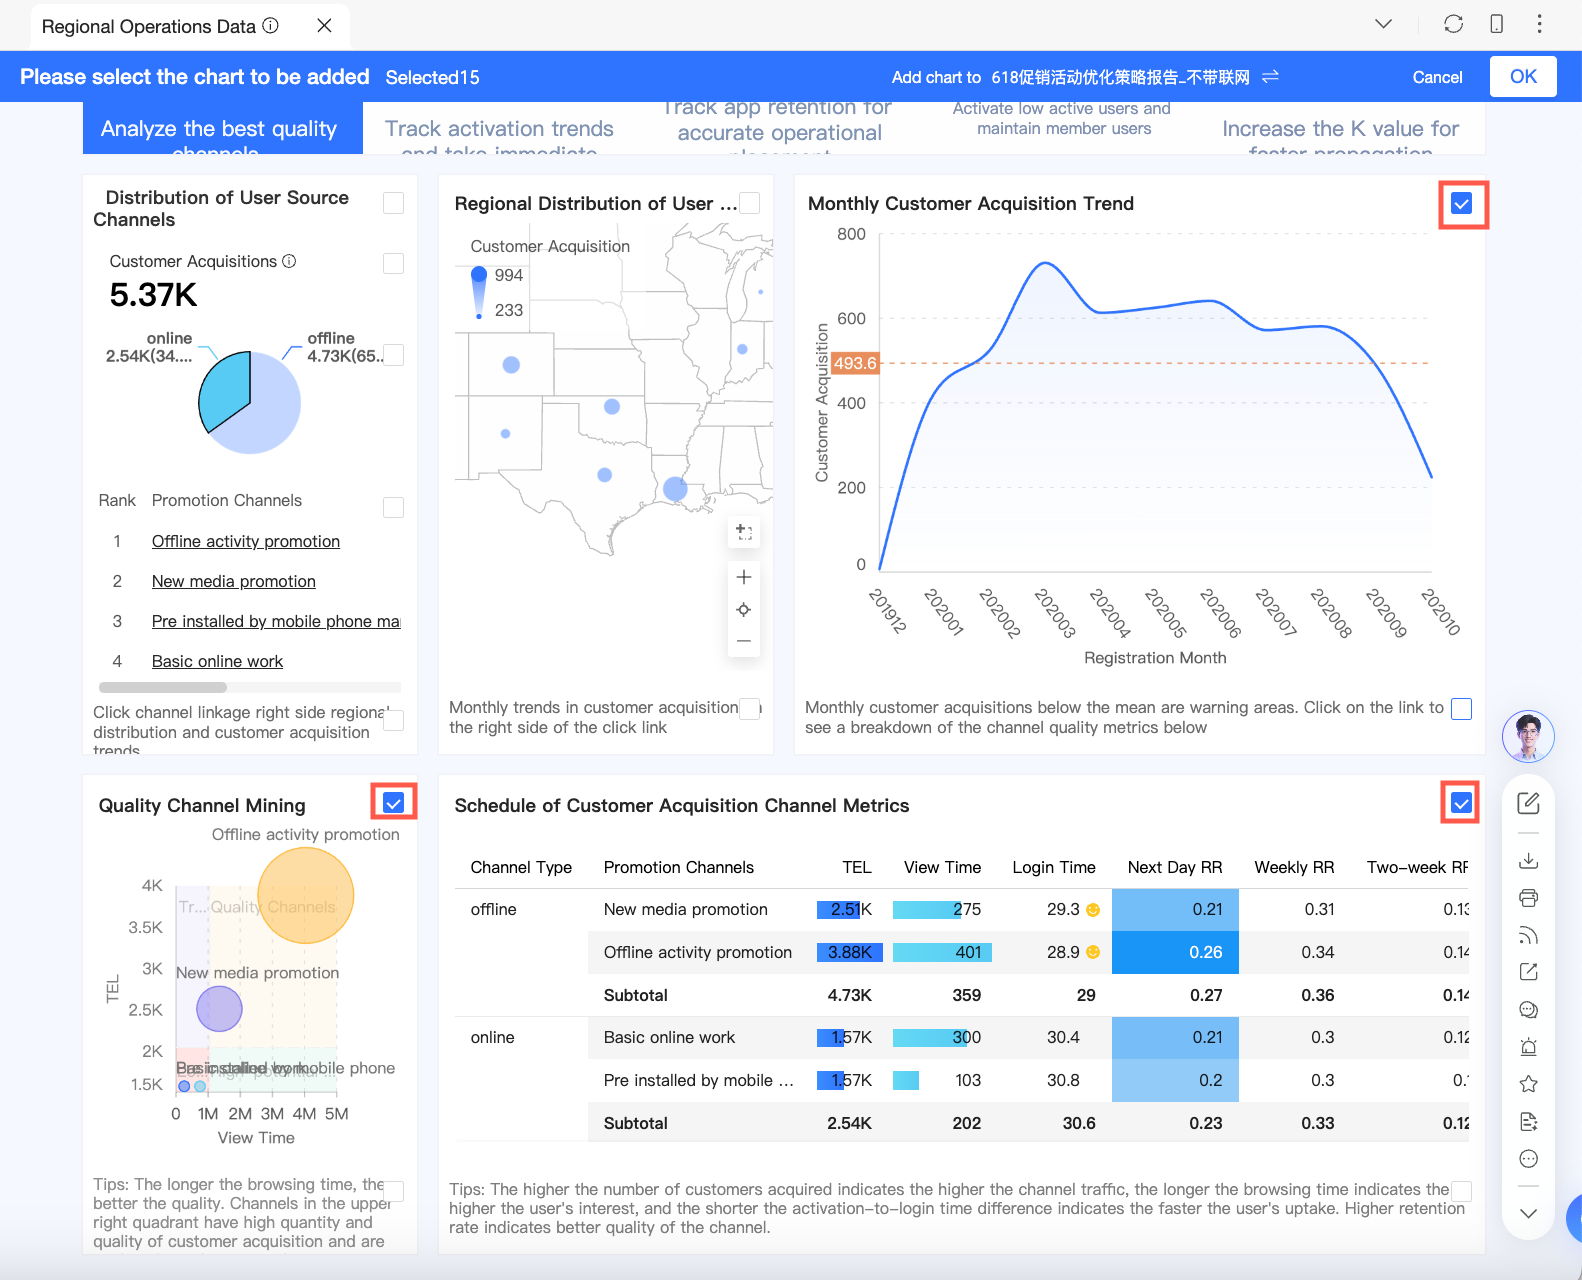
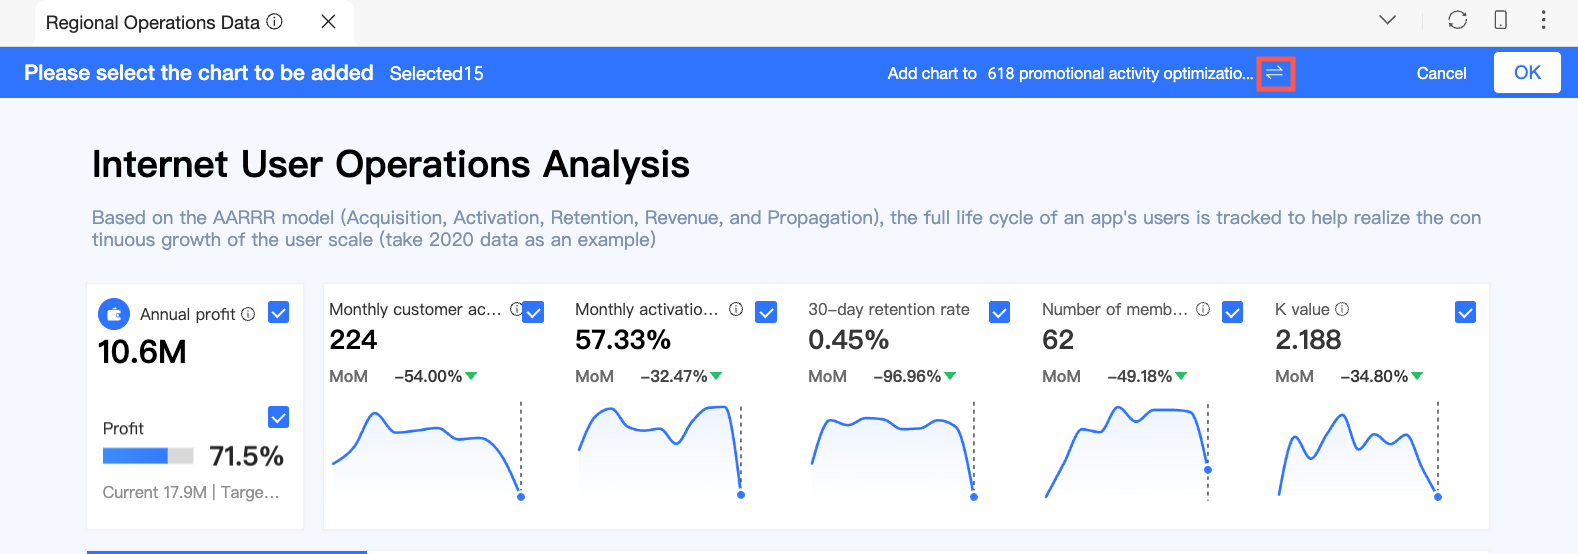
On the dashboard preview page, click Report to open the bulk chart selection interface.
-
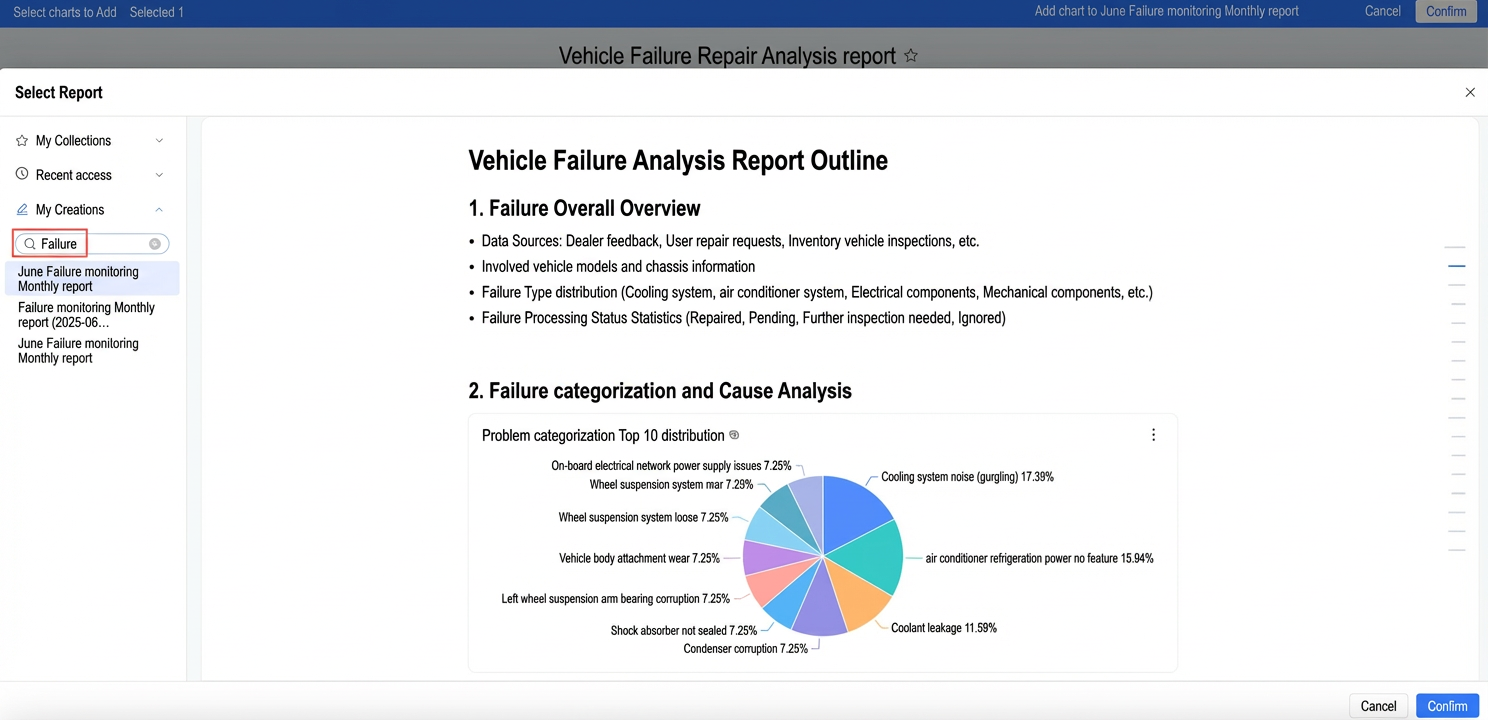
Select the charts that you want to add.
Note-
A report supports a maximum of 20 dashboard chart components. For example, if your report already has 19 dashboard chart components, adding two more causes the following error message to appear:
You can delete some charts before adding more.
-
You cannot add the same chart from a dashboard more than once. Repeated attempts cause the following error message to appear:
You must detach the dynamic reference before you can try again.
-
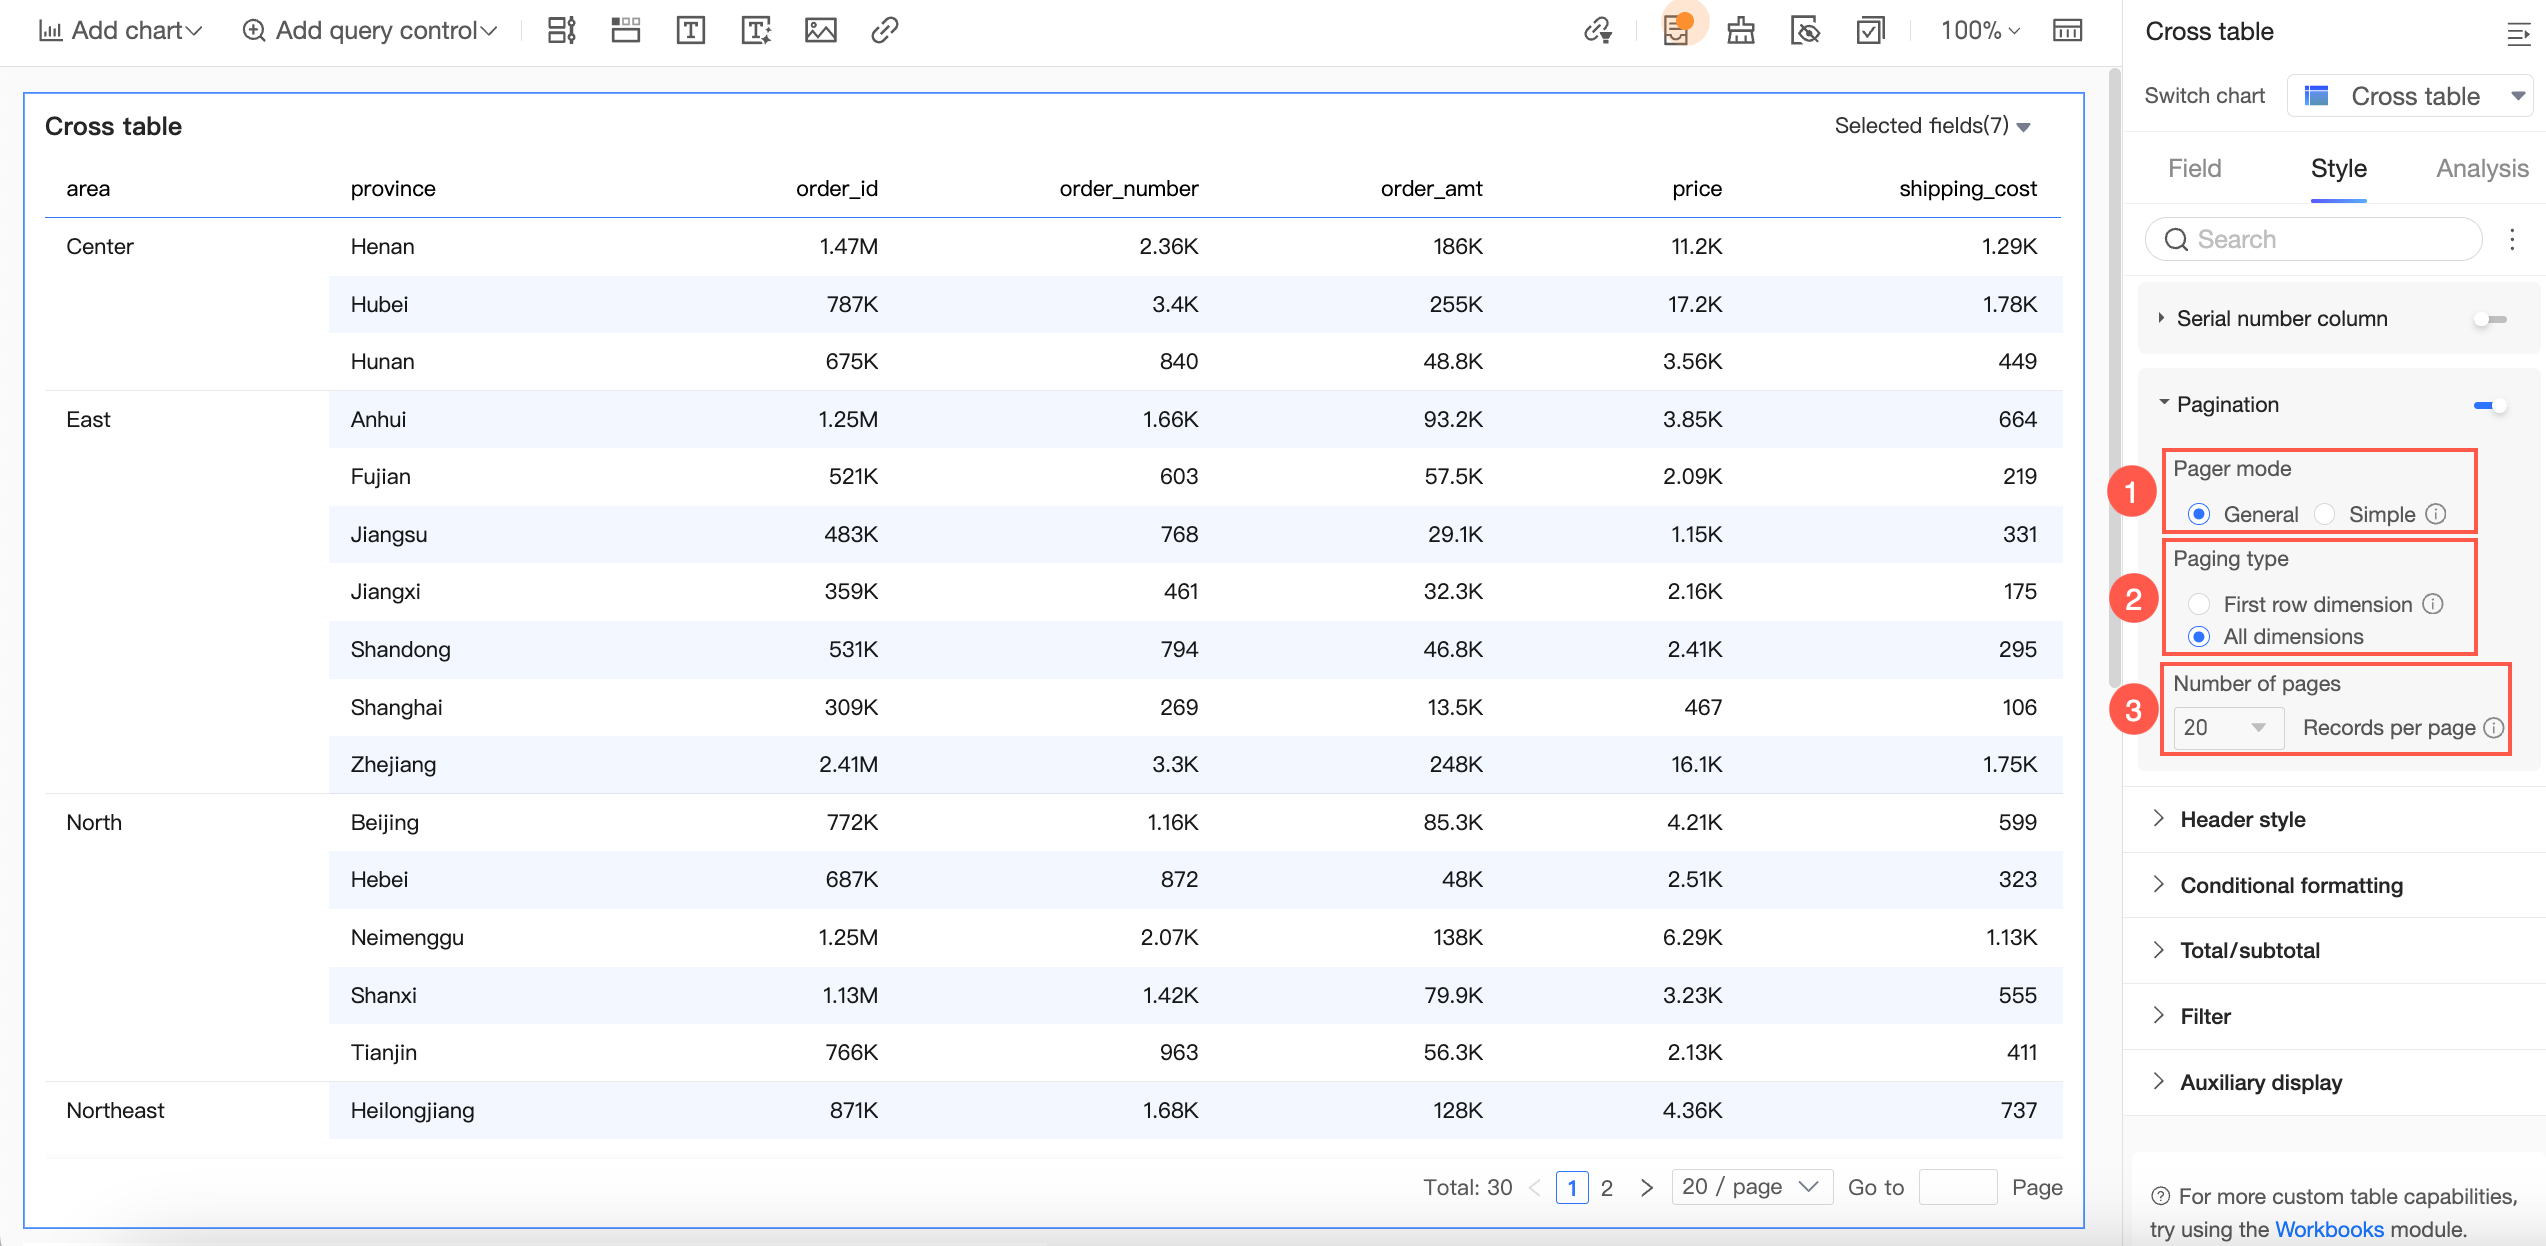
When the pager feature is used in cross tables and detail tables, after the chart is added to the report, the pager's mode is set to Regular (①) by default, the pagination type is set to All Dimensions (②), and the pagination quantity is determined by the actual configured quantity (③). A maximum of 10,000 rows of data are displayed.
-
When you select charts, if the selected chart components form a complete block layout, the system preserves their tiling style when they are inserted into the report. If the selected chart components do not form a block layout, they are inserted as individual charts.
-
-
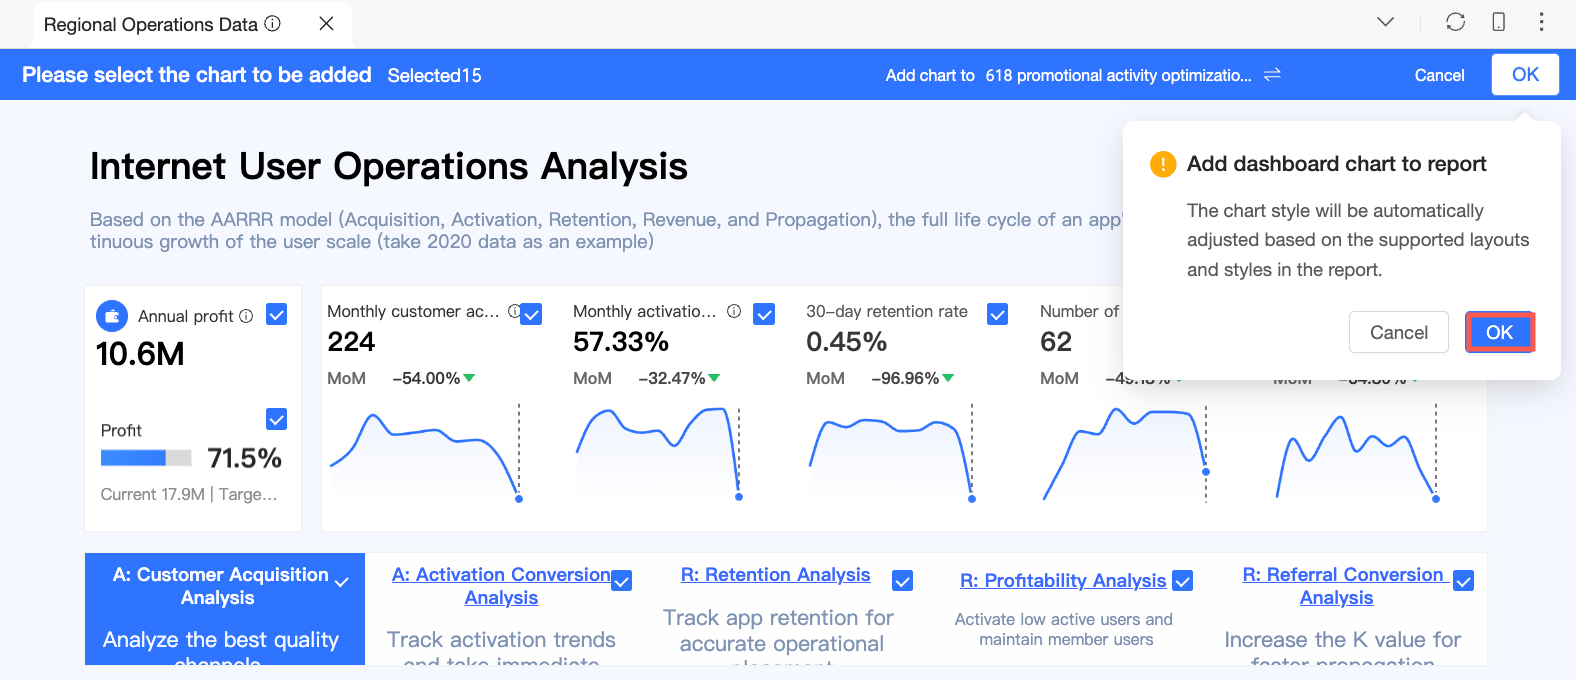
Select a Q Report, use your cursor to specify the insertion position, and then click OK.
Click the
icon to switch the target report. -
In the add interface, click OK, and then click OK again in the confirmation dialog box.
NoteAfter you add charts, they update automatically from the source dashboard. You can detach them to stop syncing with the source.
-
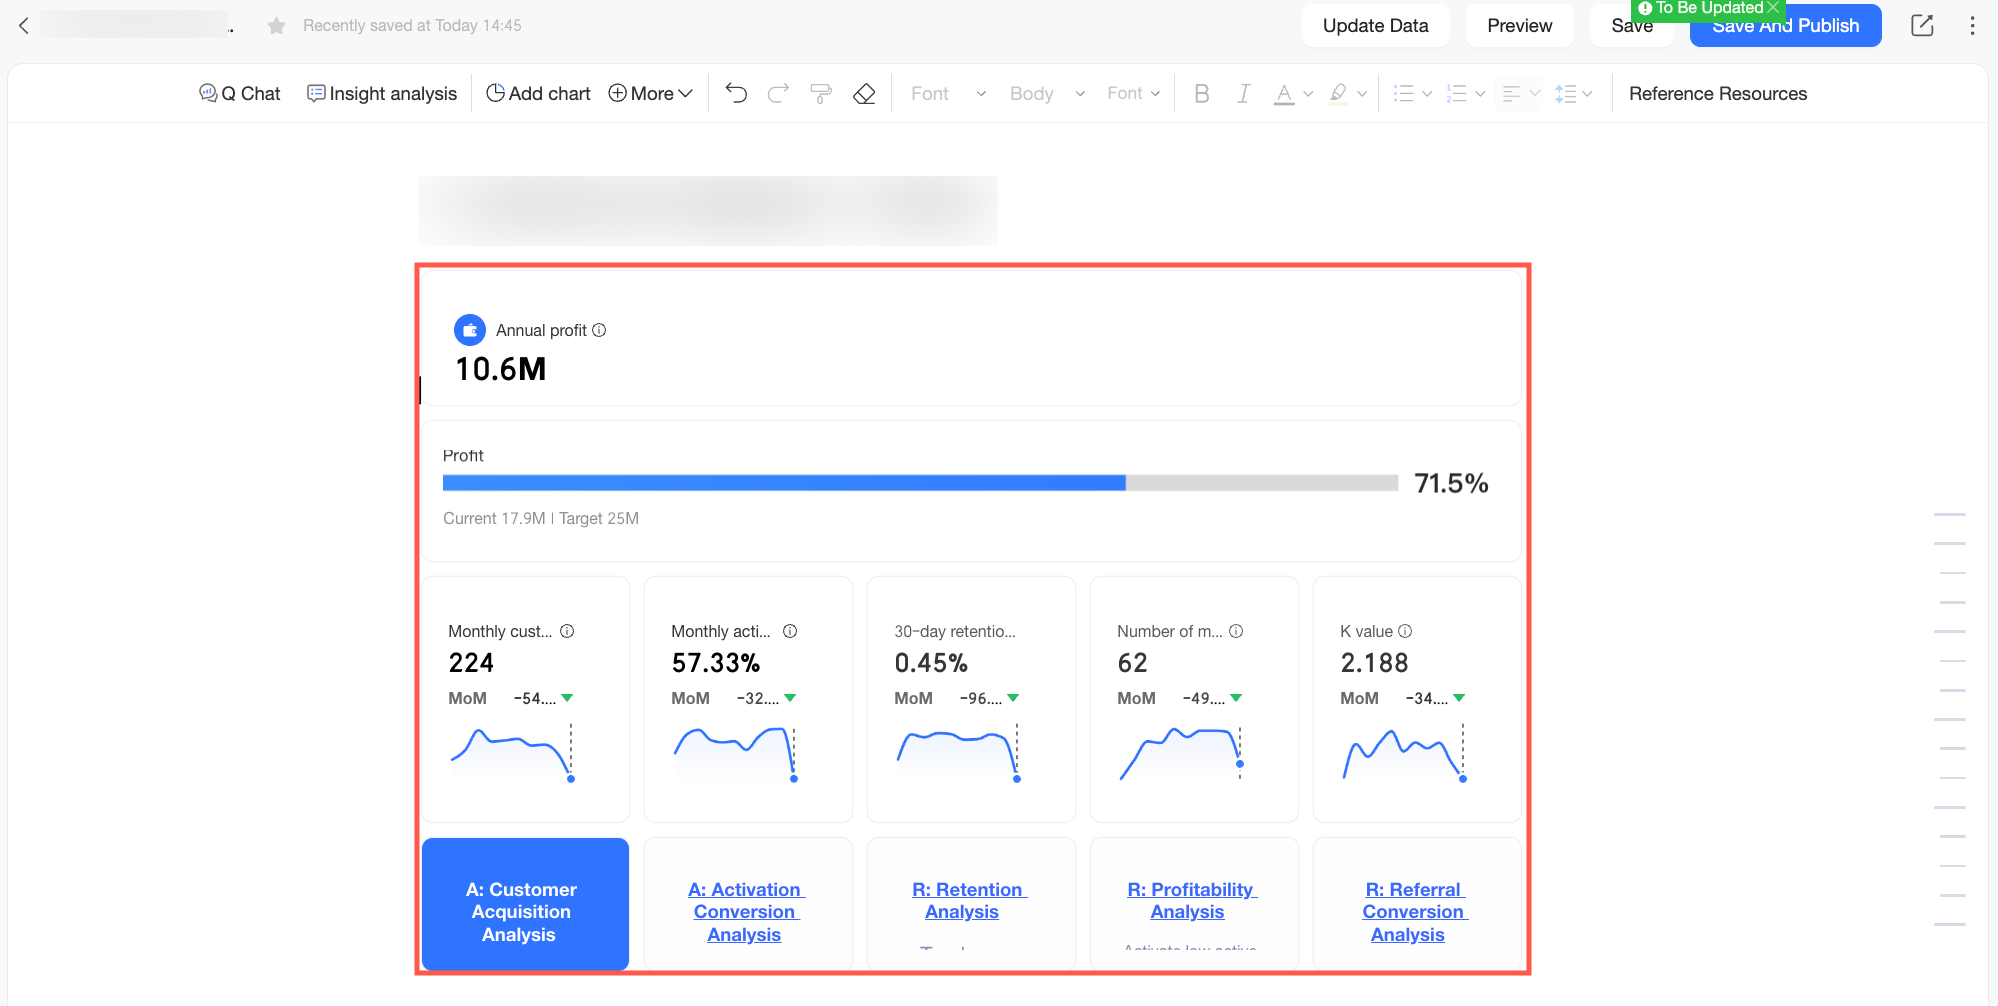
After the charts are added, you can view them in the Q Report.


Add Q Insights Results
Add Q Insights results to a Q Report from the Dashboard Q Insights page.
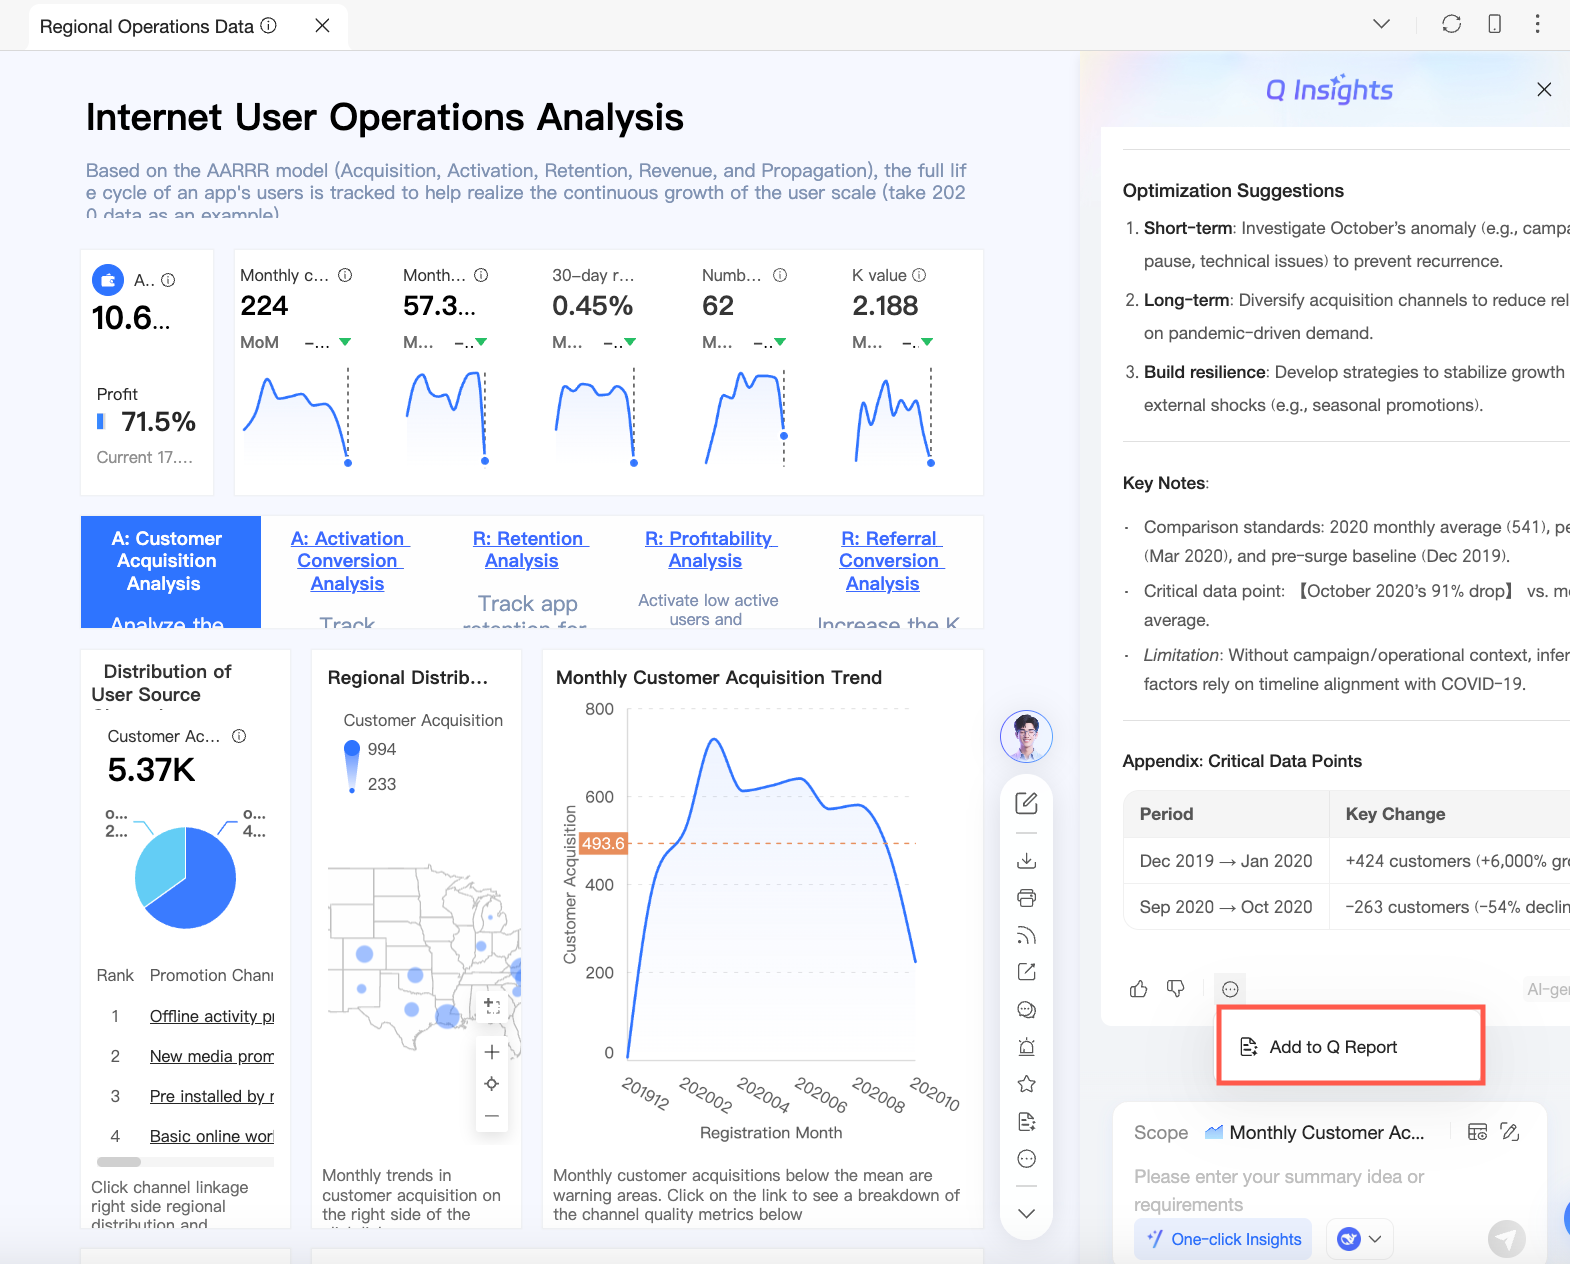
-
In the dashboard Q Insights results, click Add to Q Report.
-
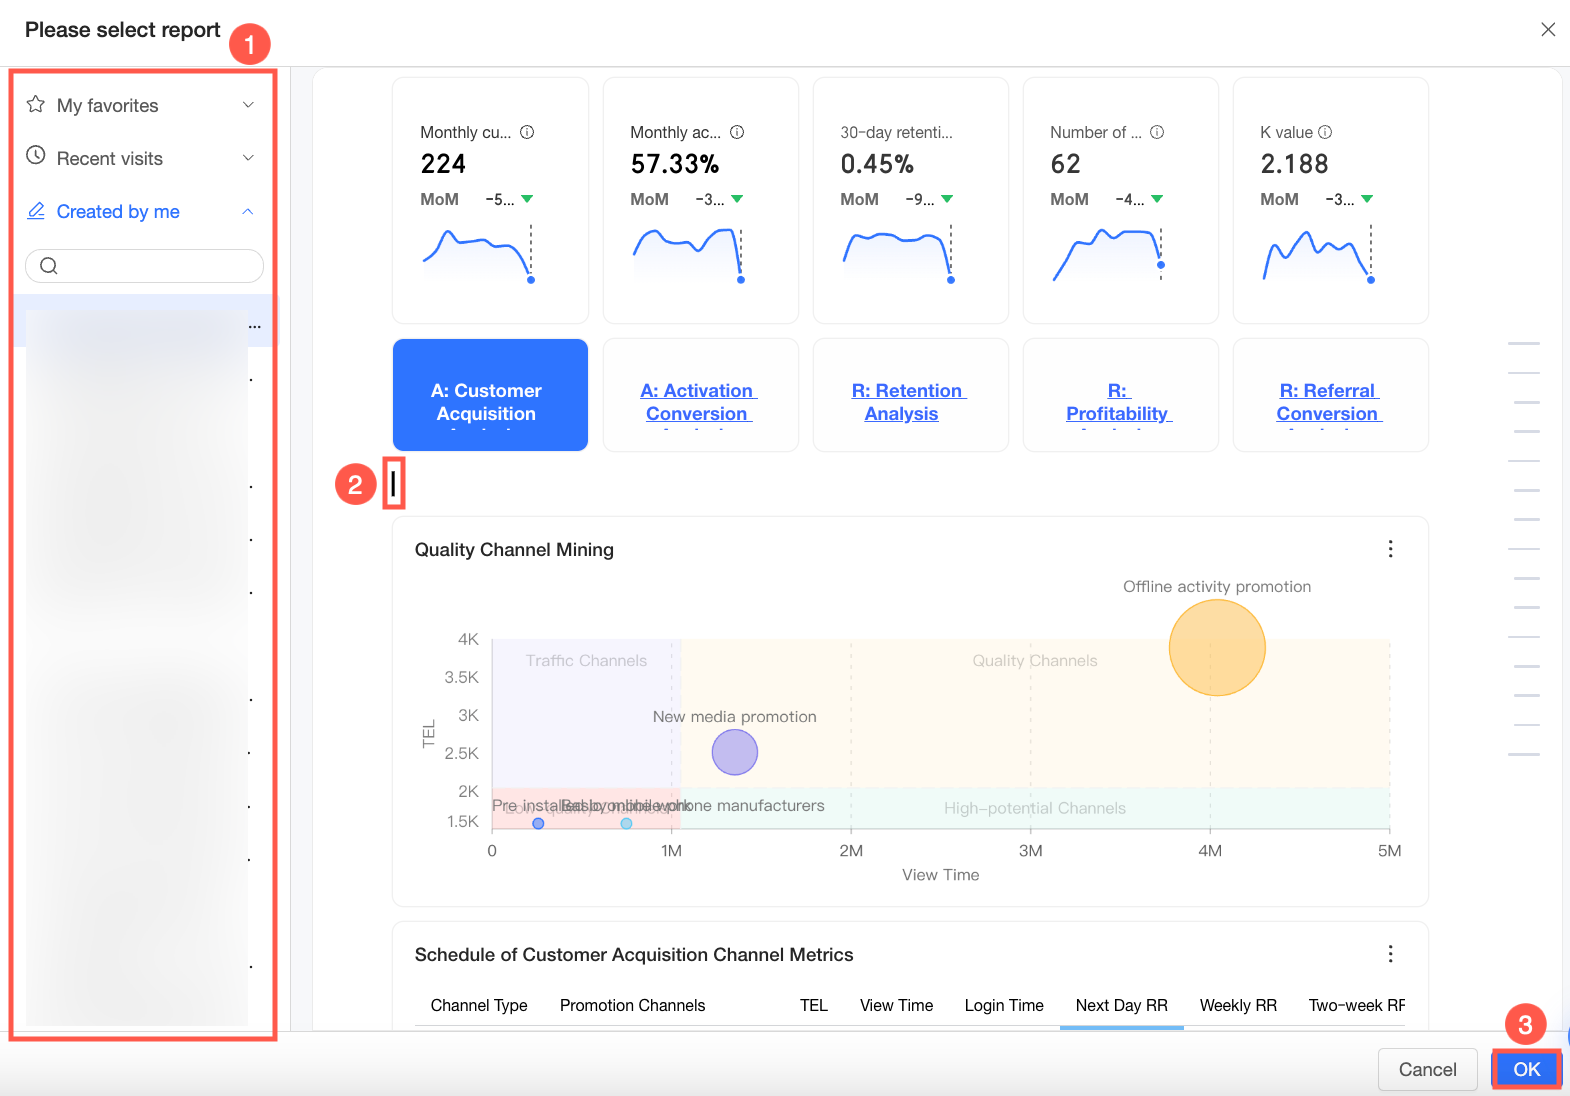
Select a report, use your cursor to specify the insertion position, and then click OK.
-
After the results are added, you can view them in the Q Report.
Add Q Chat Data Results
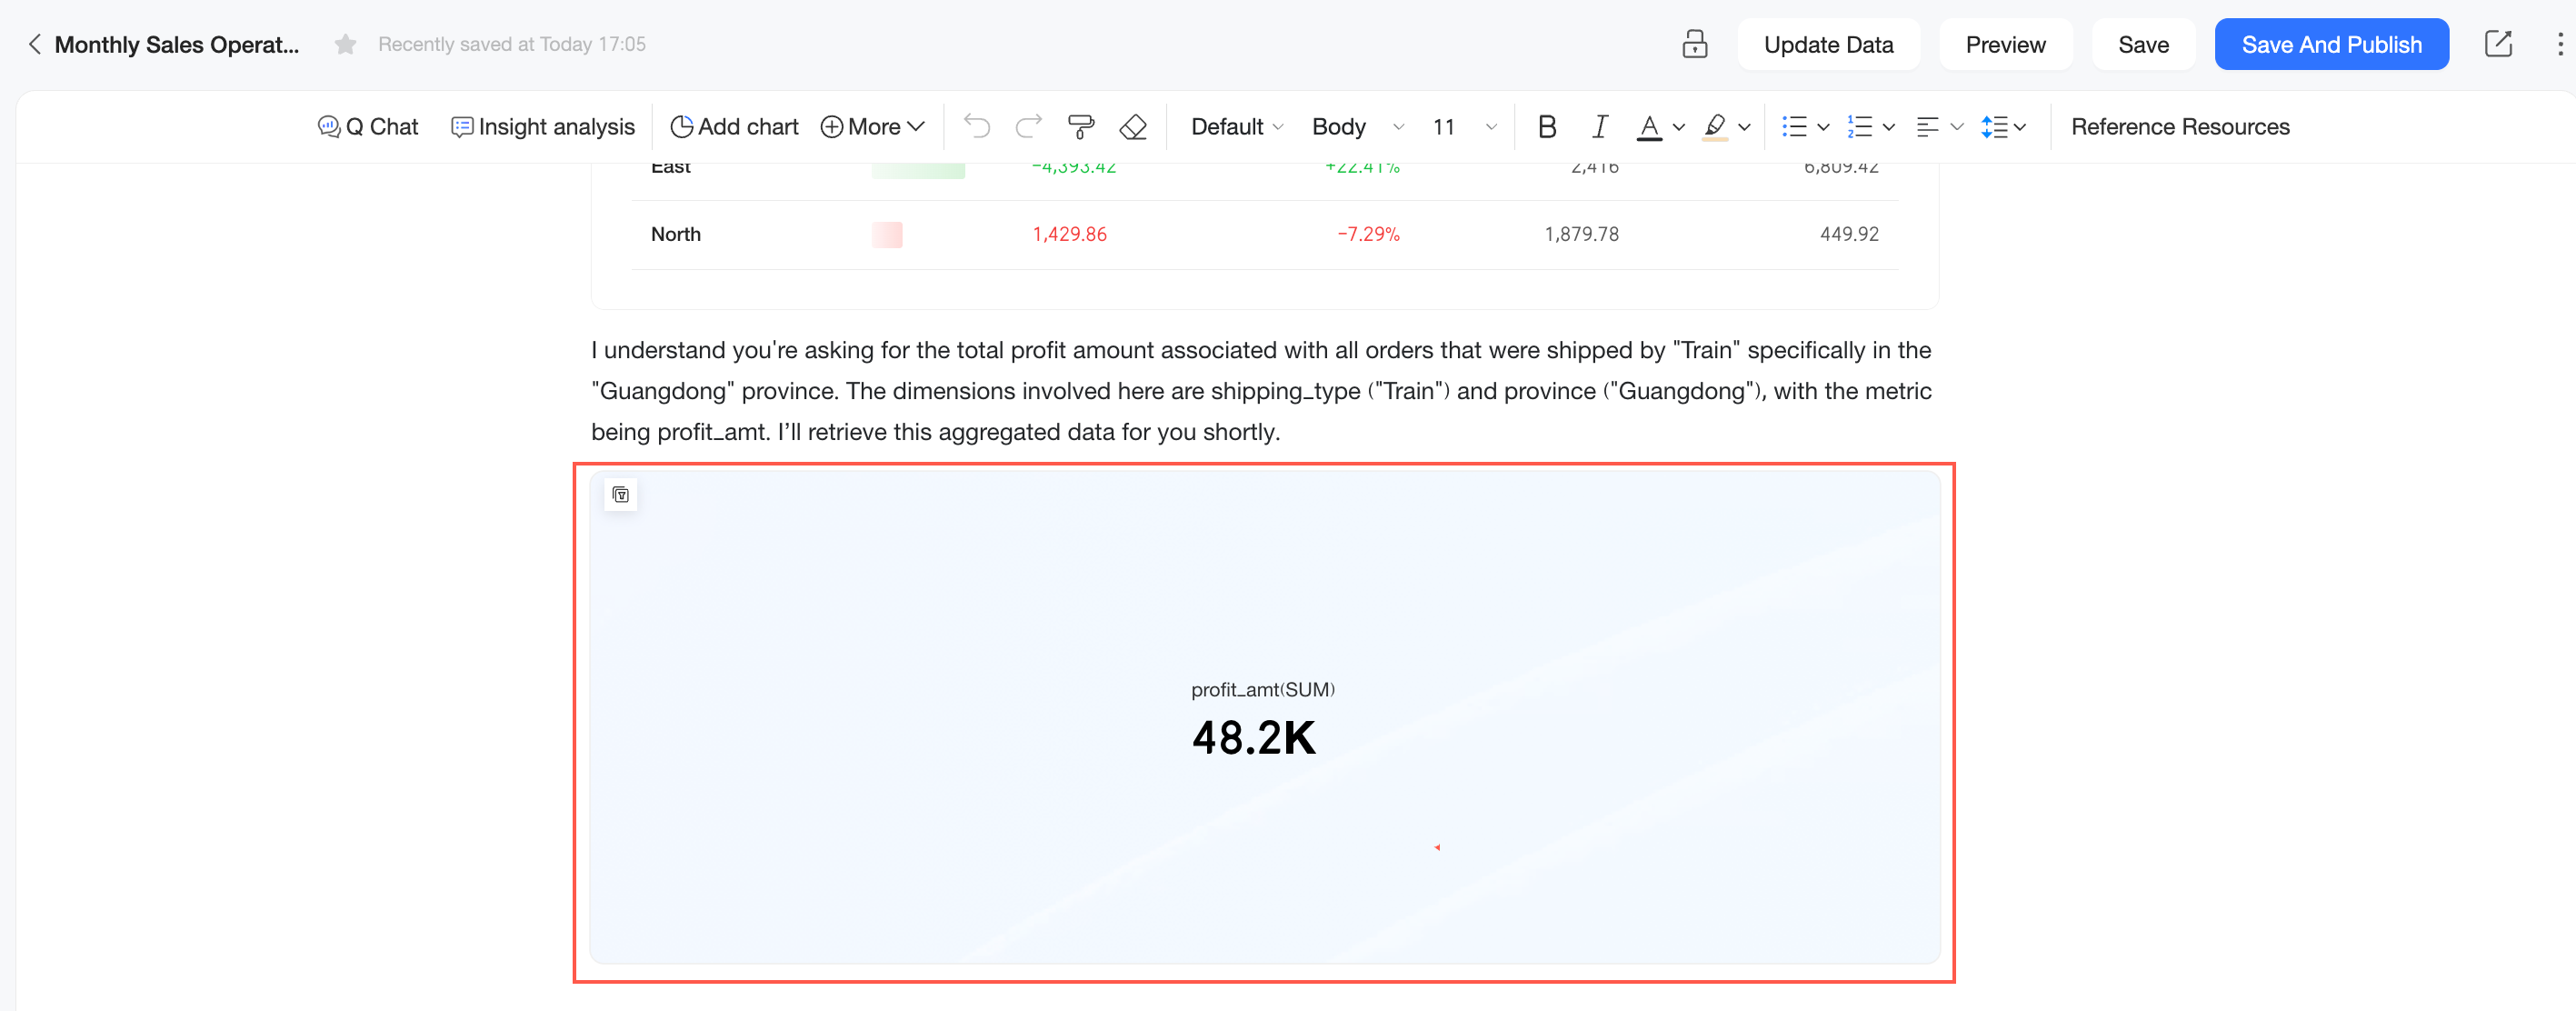
Add Q Chat Data results to a Q Report from the Q Chat page.
-
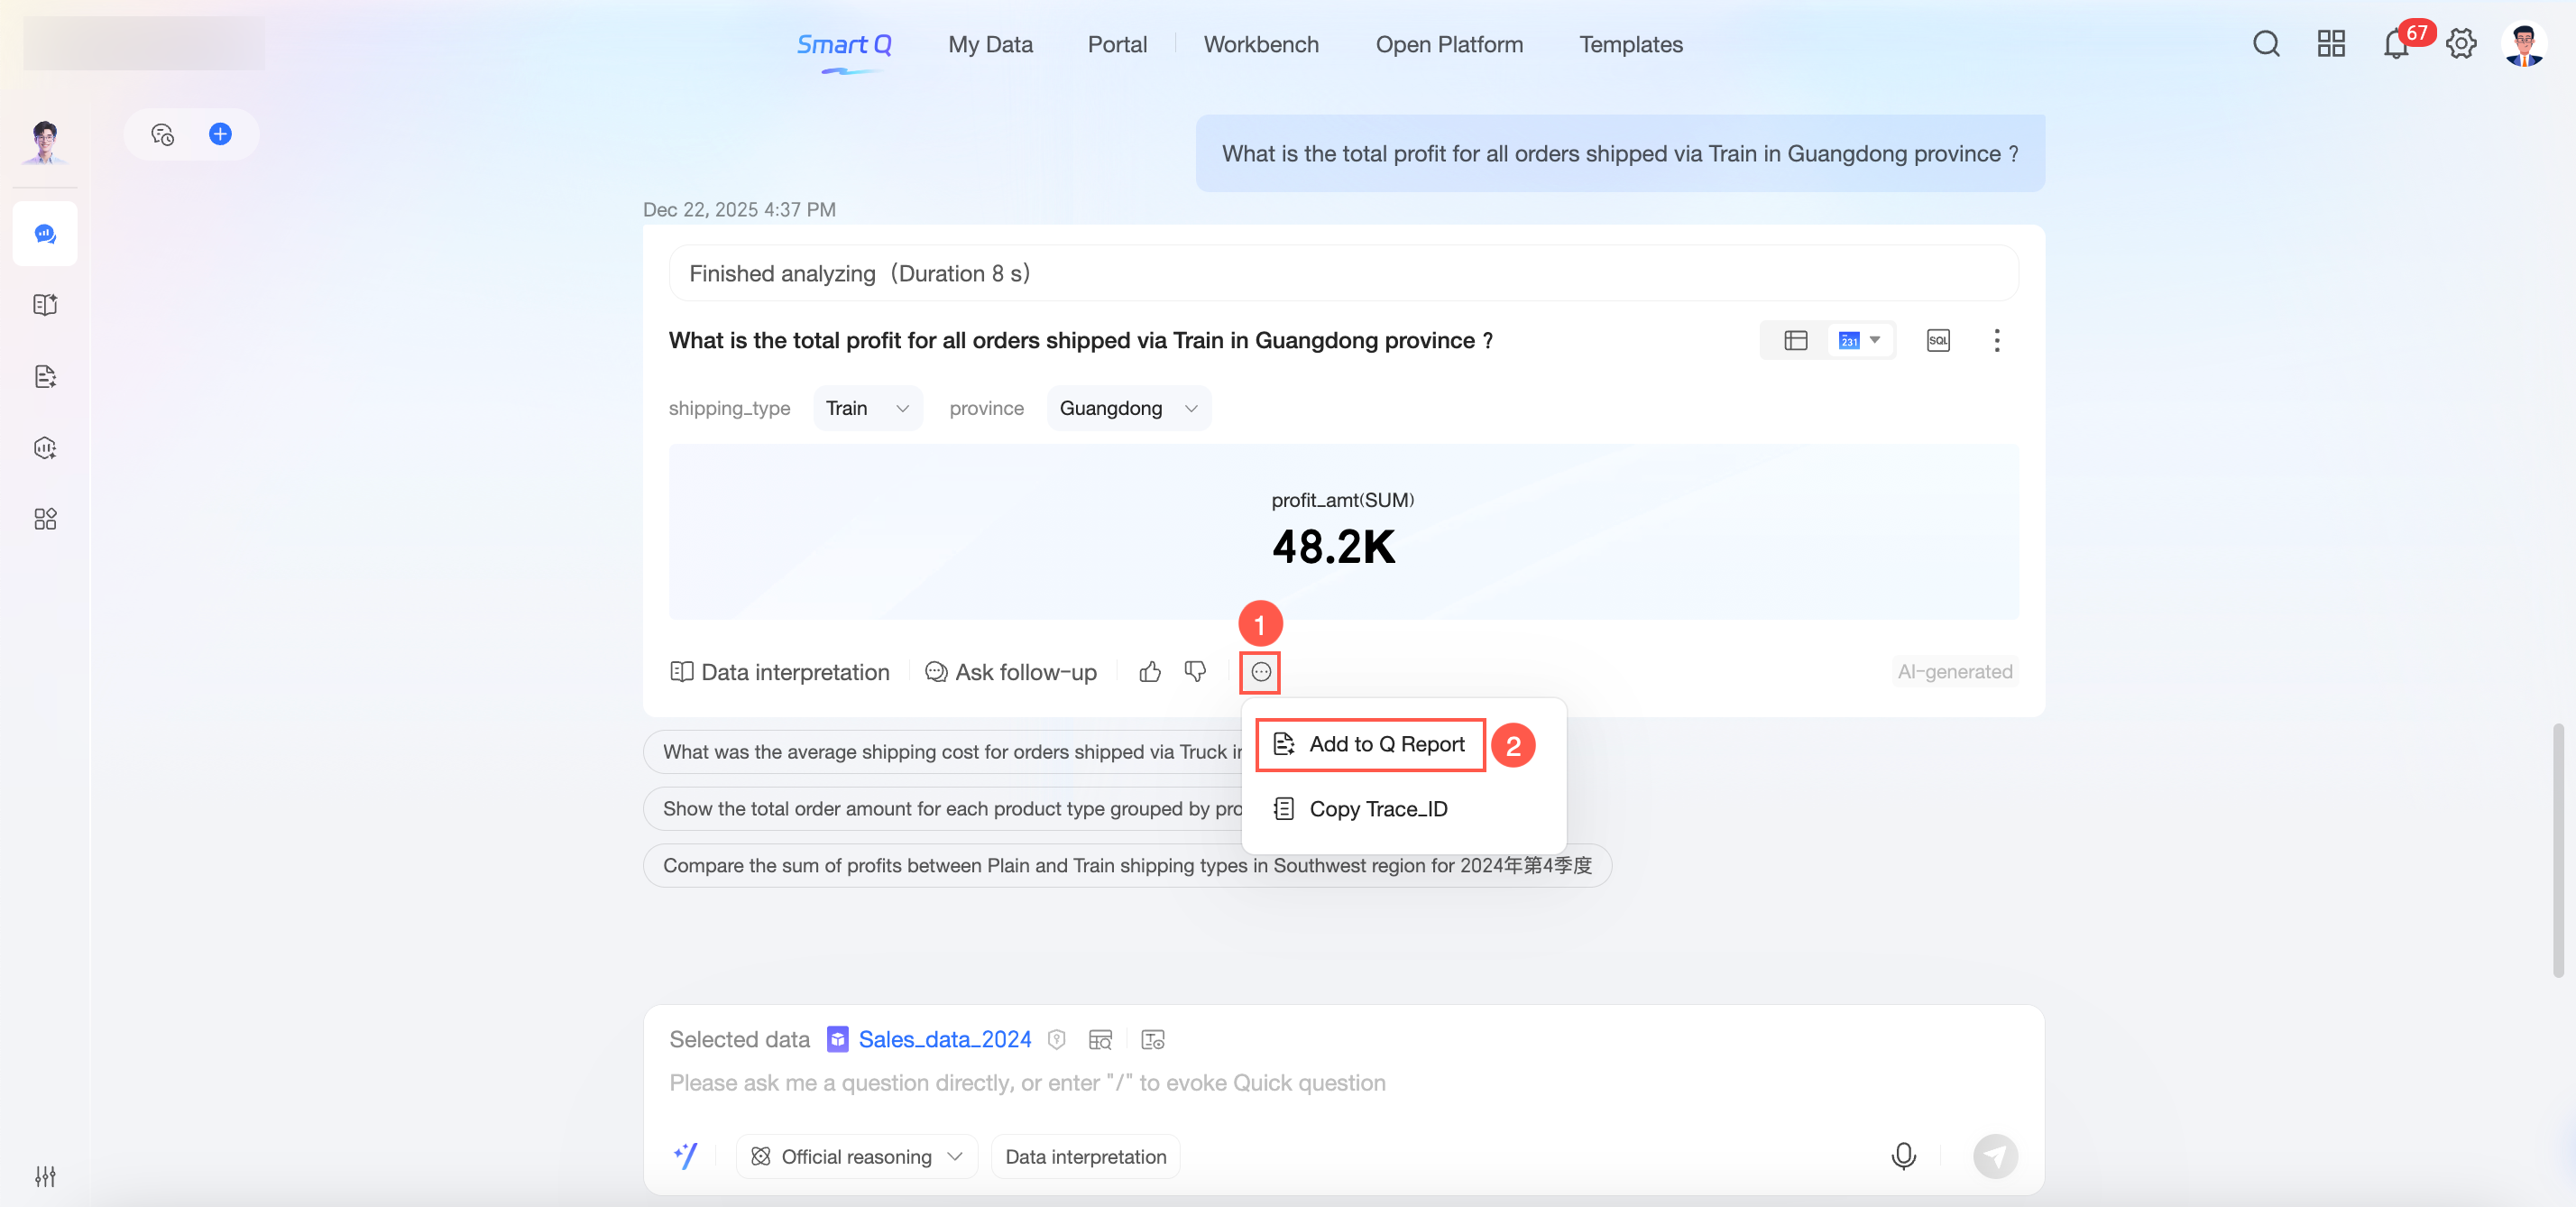
In the ask data results, click the
icon and select Add to Q Report. -
Select a report and click OK.
-
After the results are added, you can view them in the Q Report.
Add Key Driver Analysis
Add key driver analysis content to a Q Report from the dataset Metric Insights page or the Q Chat Data page.
-
Insert the generated key driver analysis content into a Q Report from one of the following pages.
-
Volatility Attribution Page: In the dataset editor, go to Advanced Configuration > Volatility Attribution. Configure your attribution analysis approach. Create an attribution analysis template based on that approach. After the template is generated, click Add to Q Report in the top-right corner. For more information about configuring volatility attribution analysis approaches, see Metric Insights.
-
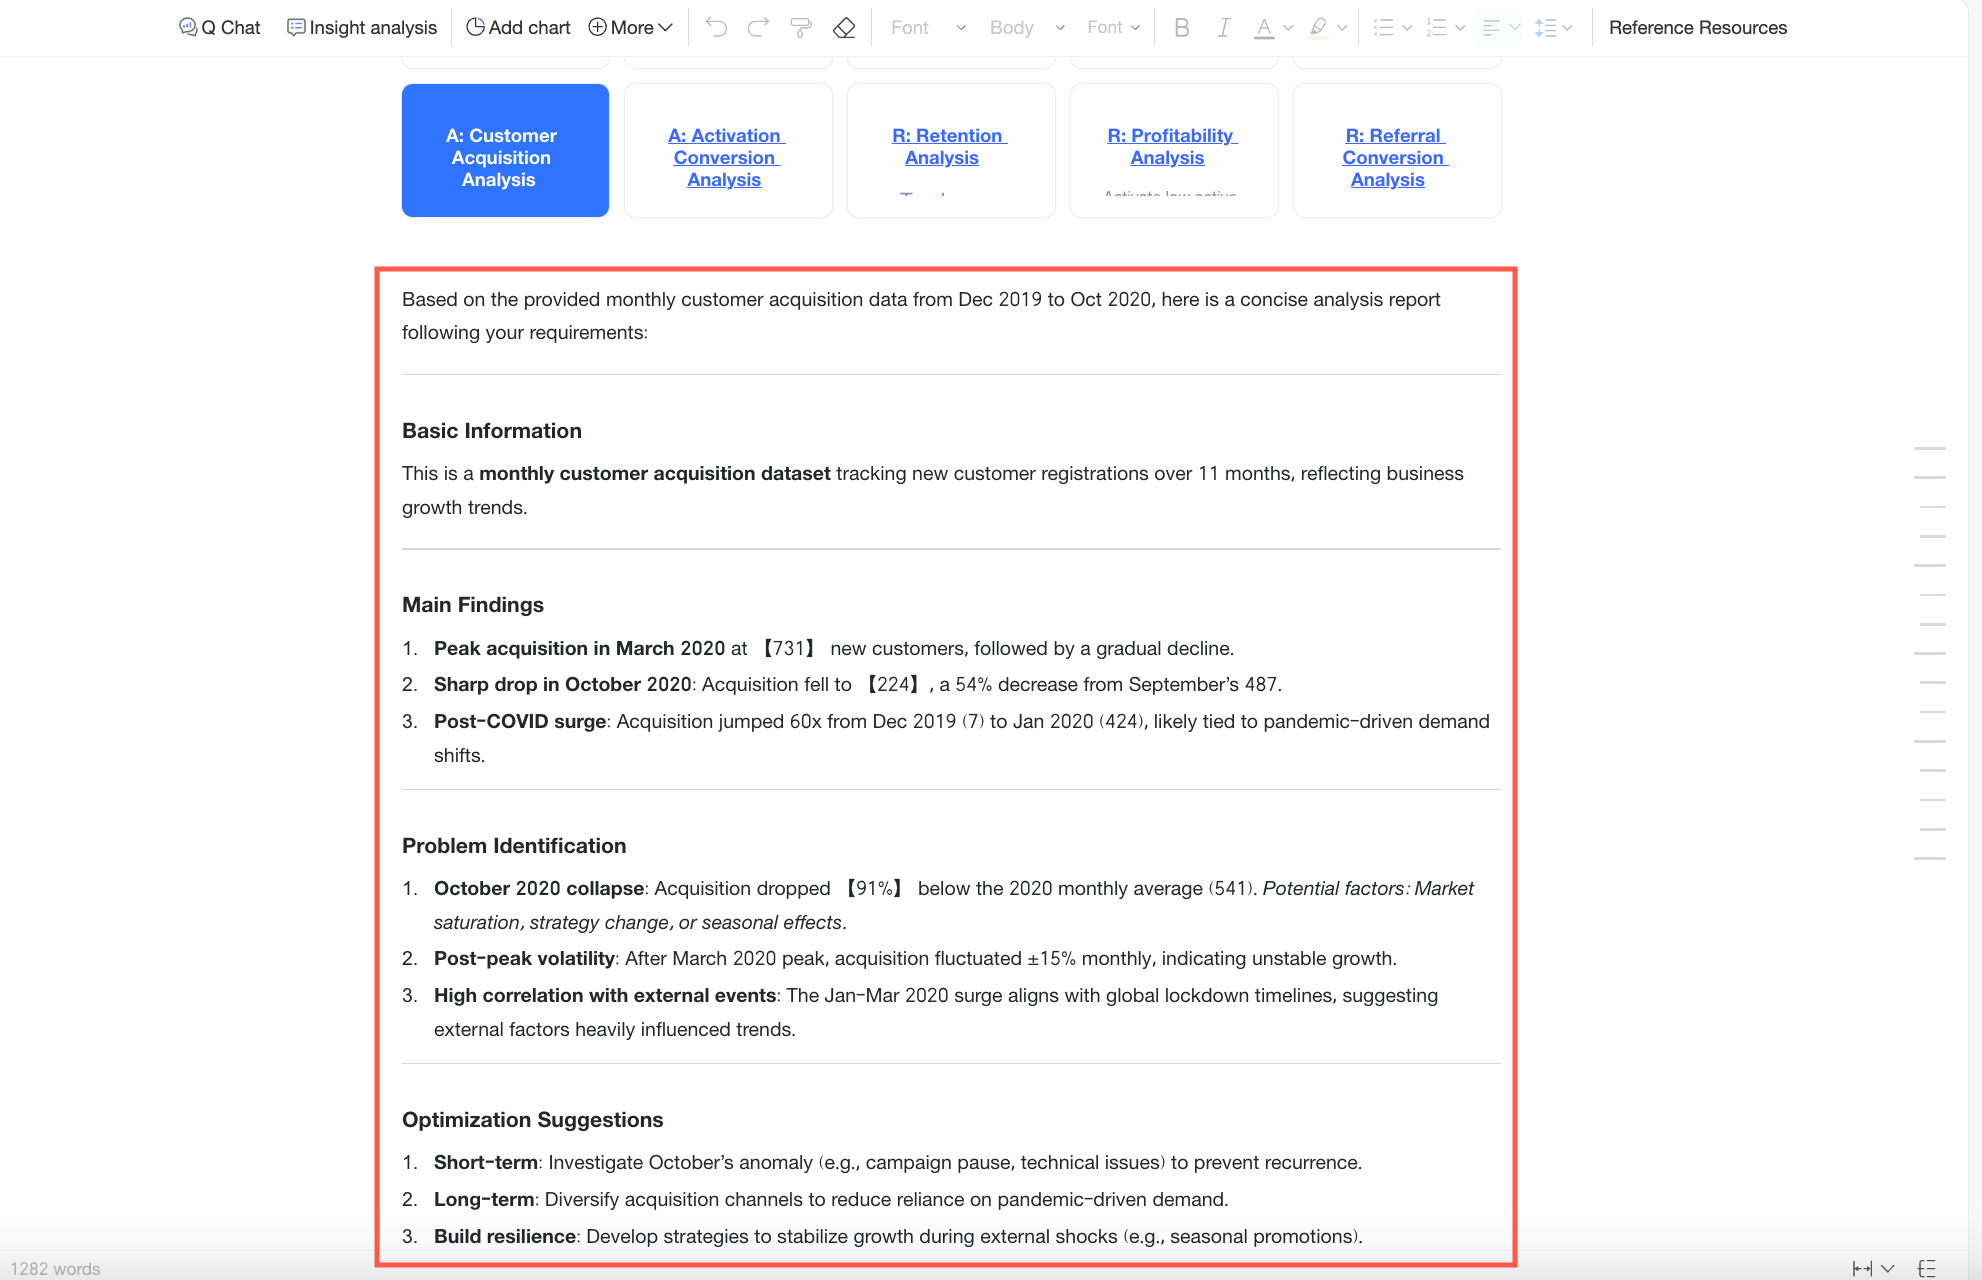
Q Chat Data Page: On the Q Chat Data page, select the desired dataset. Enter an analysis instruction in the instruction box and run it. After the key driver analysis content is generated, click Add to Q Report at the bottom of the page. For more information about generating key driver analysis content using Q Chat Data, see Start Ask Data.
-
Chart Interface from Ask Data Results: In a chart returned by Q Chat Data, click the icon and select Volatility Attribution. After the key driver analysis content is generated, click Add to Q Report at the bottom of the page. For more information about generating key driver analysis content from ask data result charts, see Ask data questions.
-
-
Select a Q Report, move your cursor to the desired insertion position, and click Add.
-
After the content is added, you can view it in the Q Report.
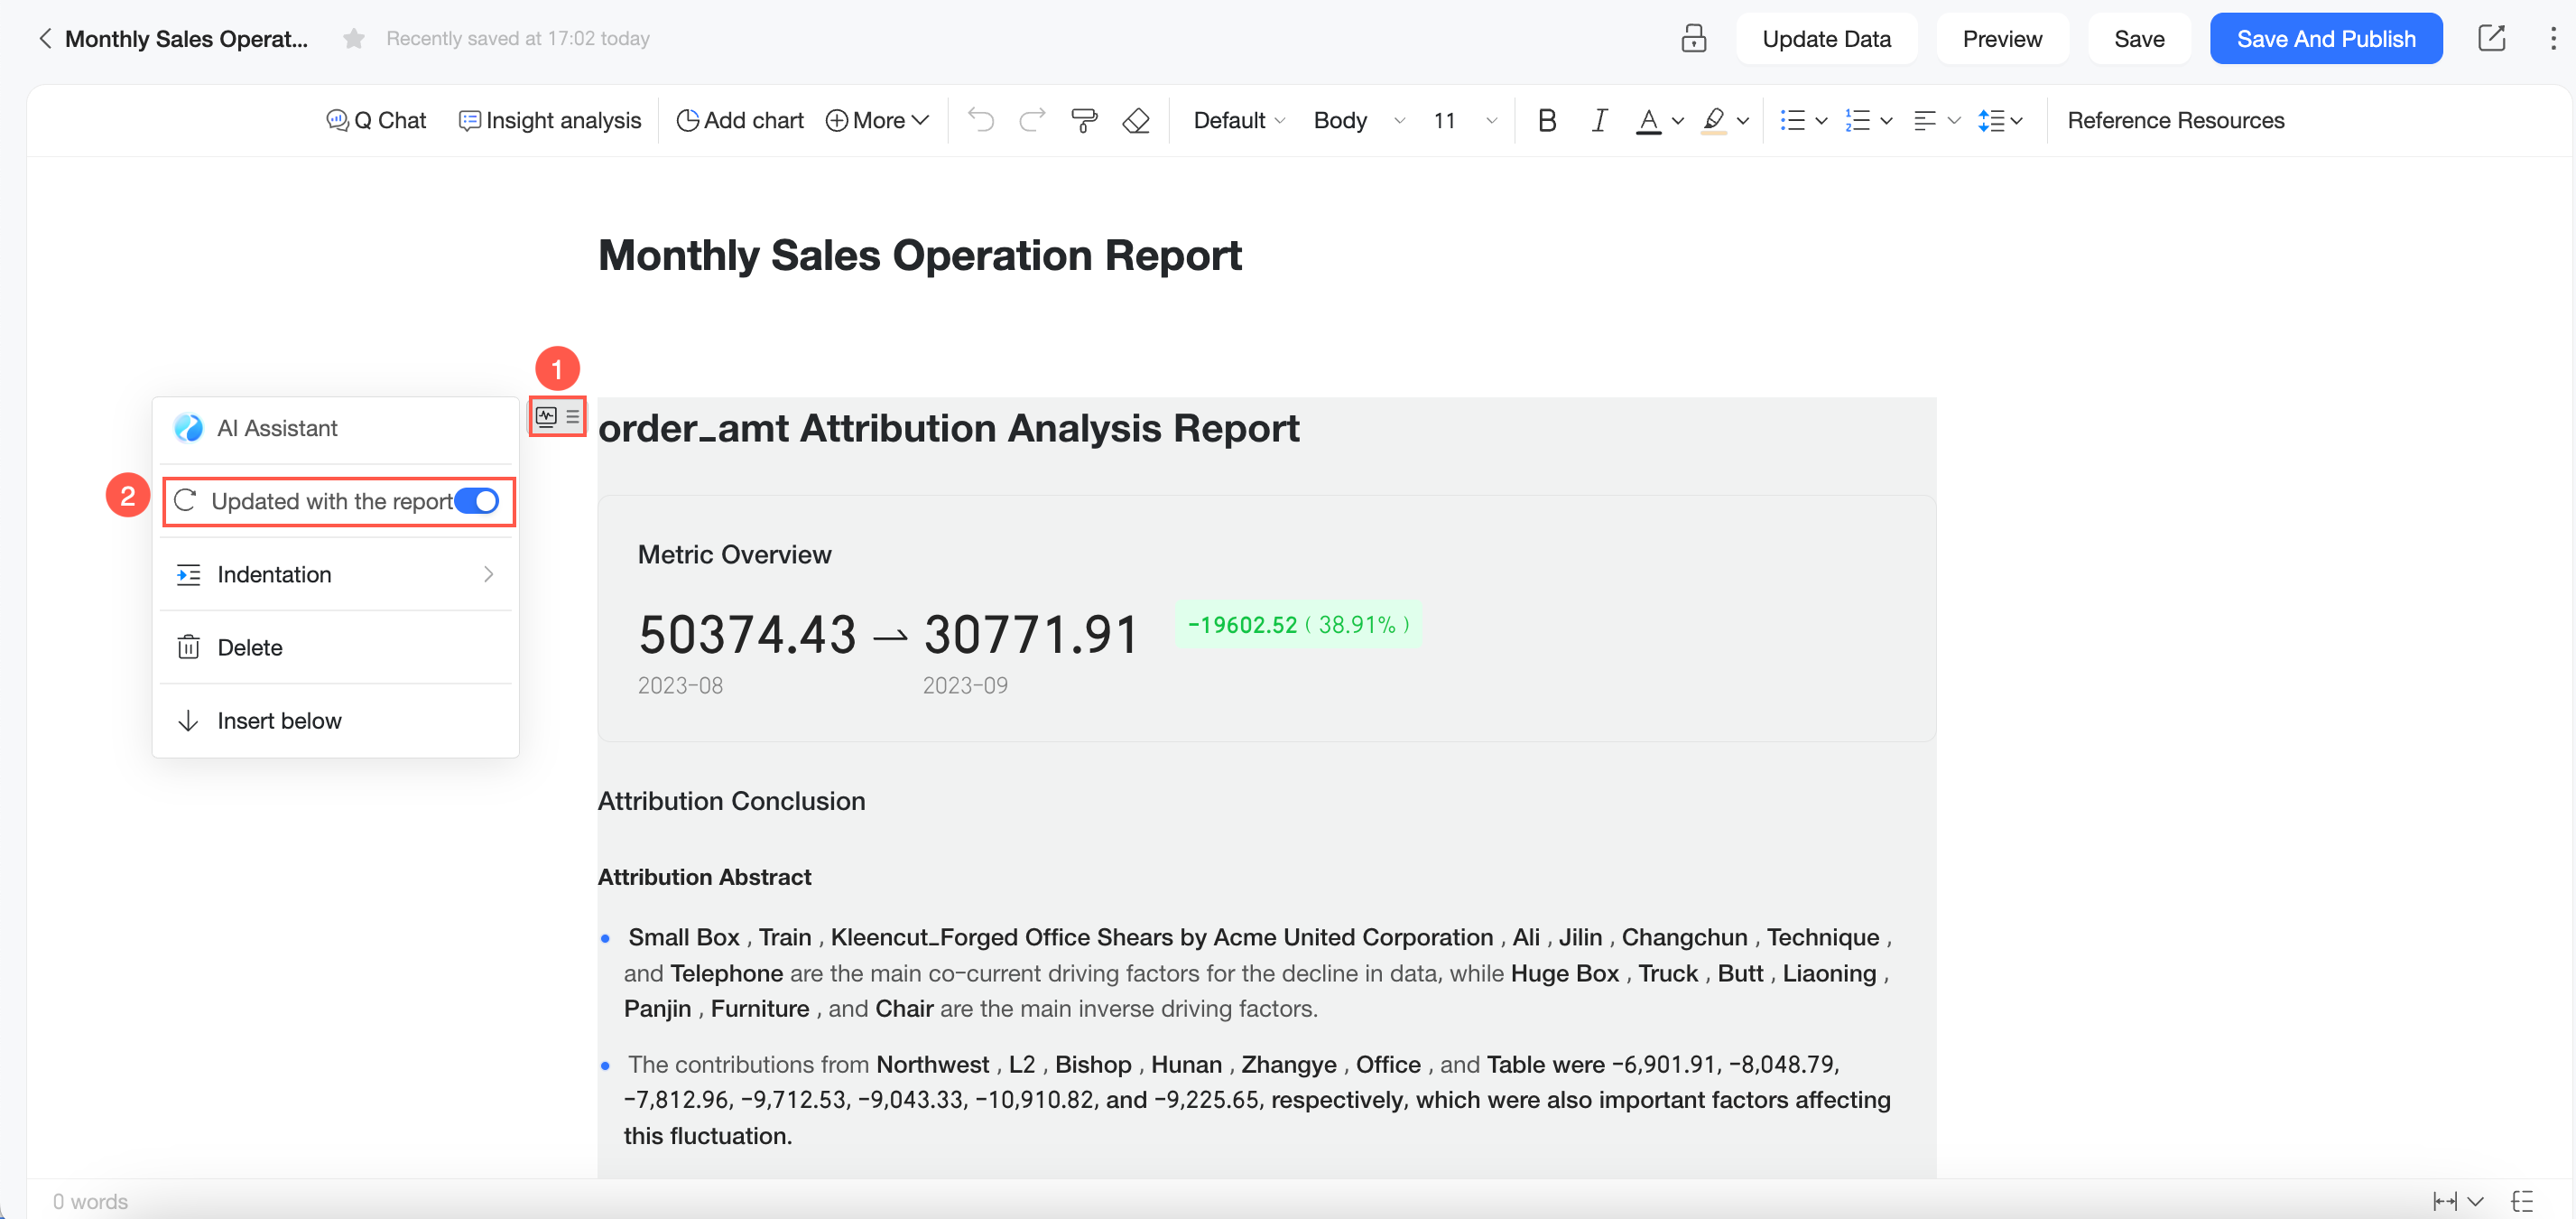
You can double-click the title area of the key driver analysis content to rename it. All other areas are read-only and cannot be edited.
-
(Optional) Configure whether the key driver analysis content updates with the report. This setting is enabled by default.
-
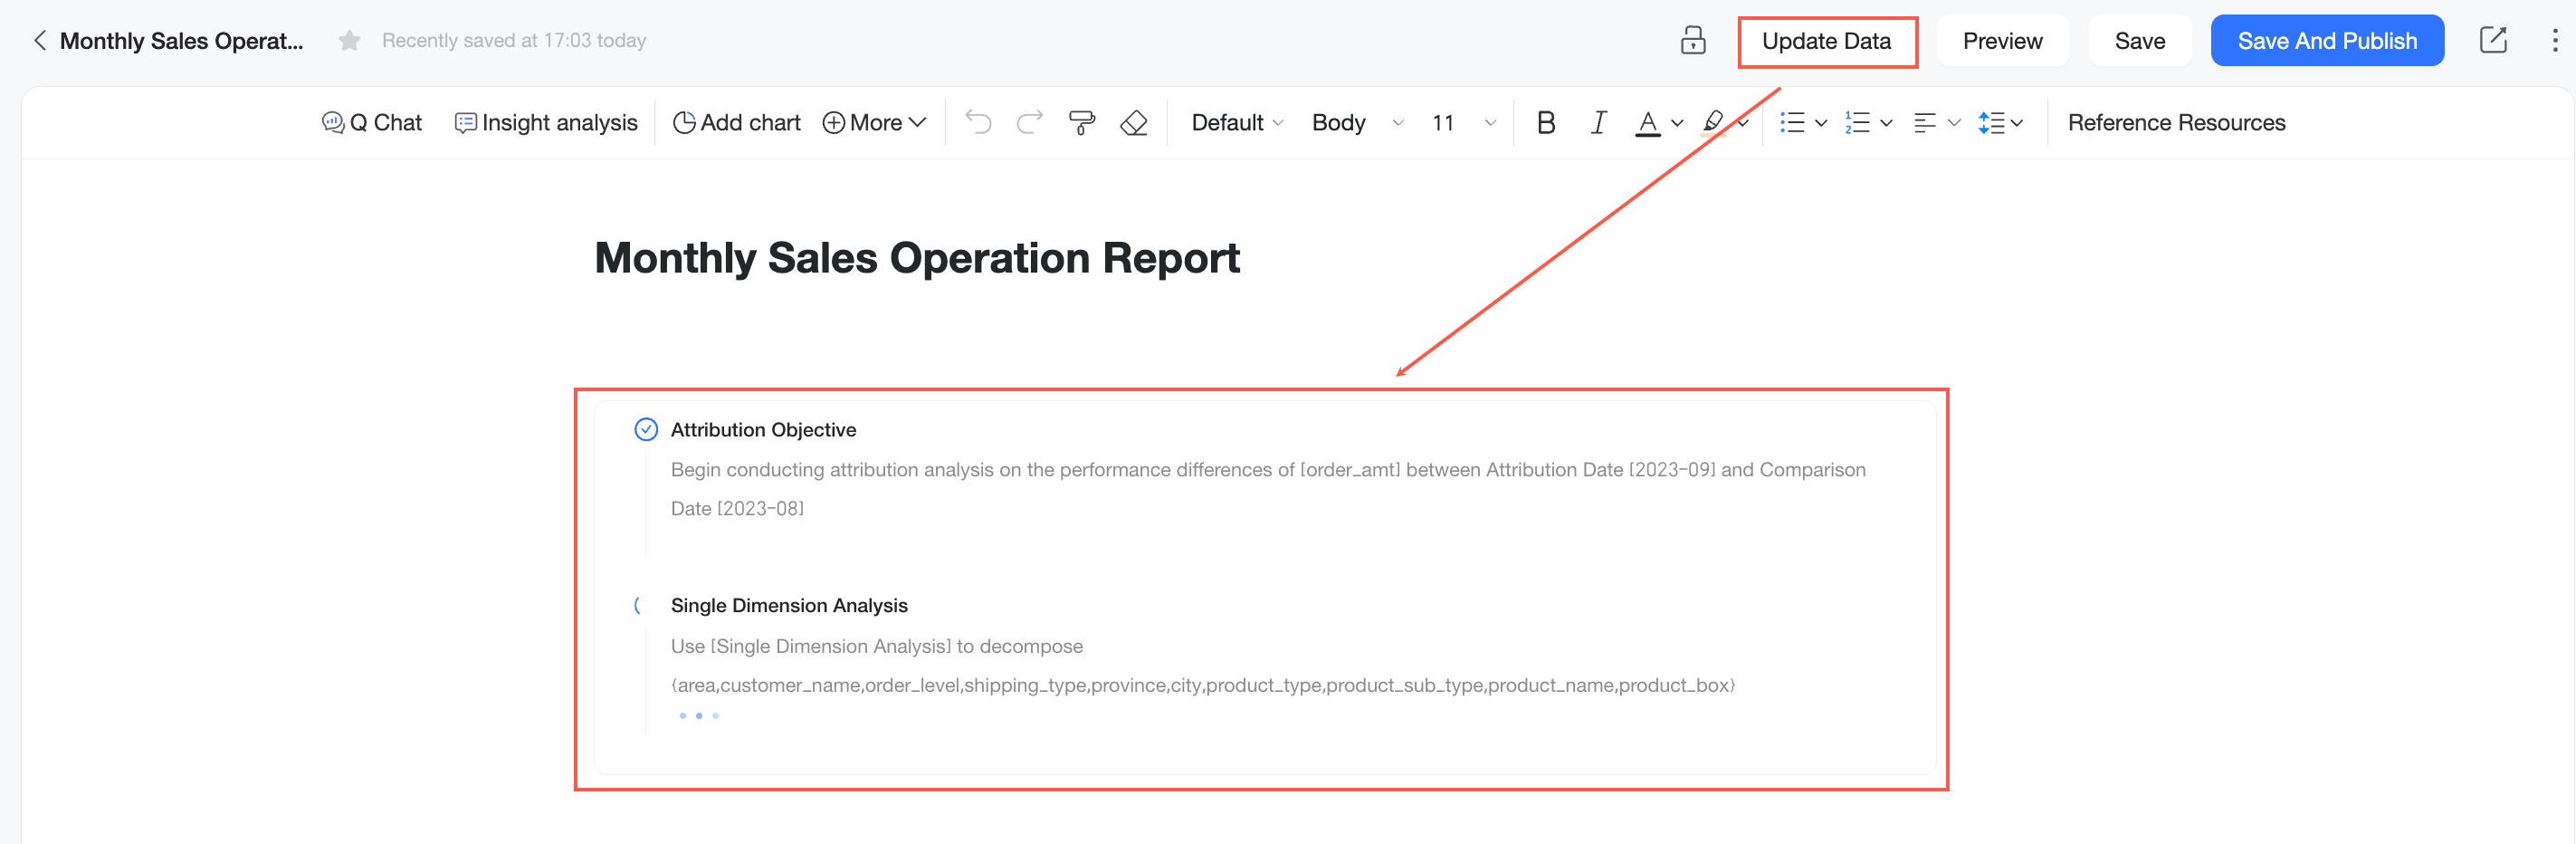
To keep the analysis current, enable the Update with Report toggle. When you update data in the Q Report, new key driver analysis content is automatically generated based on the dataset’s attribution configuration.
-
To freeze the analysis at a specific point in time, disable the Update with Report toggle. The content remains as it was when generated and does not change when you update data in the Q Report.
-
-
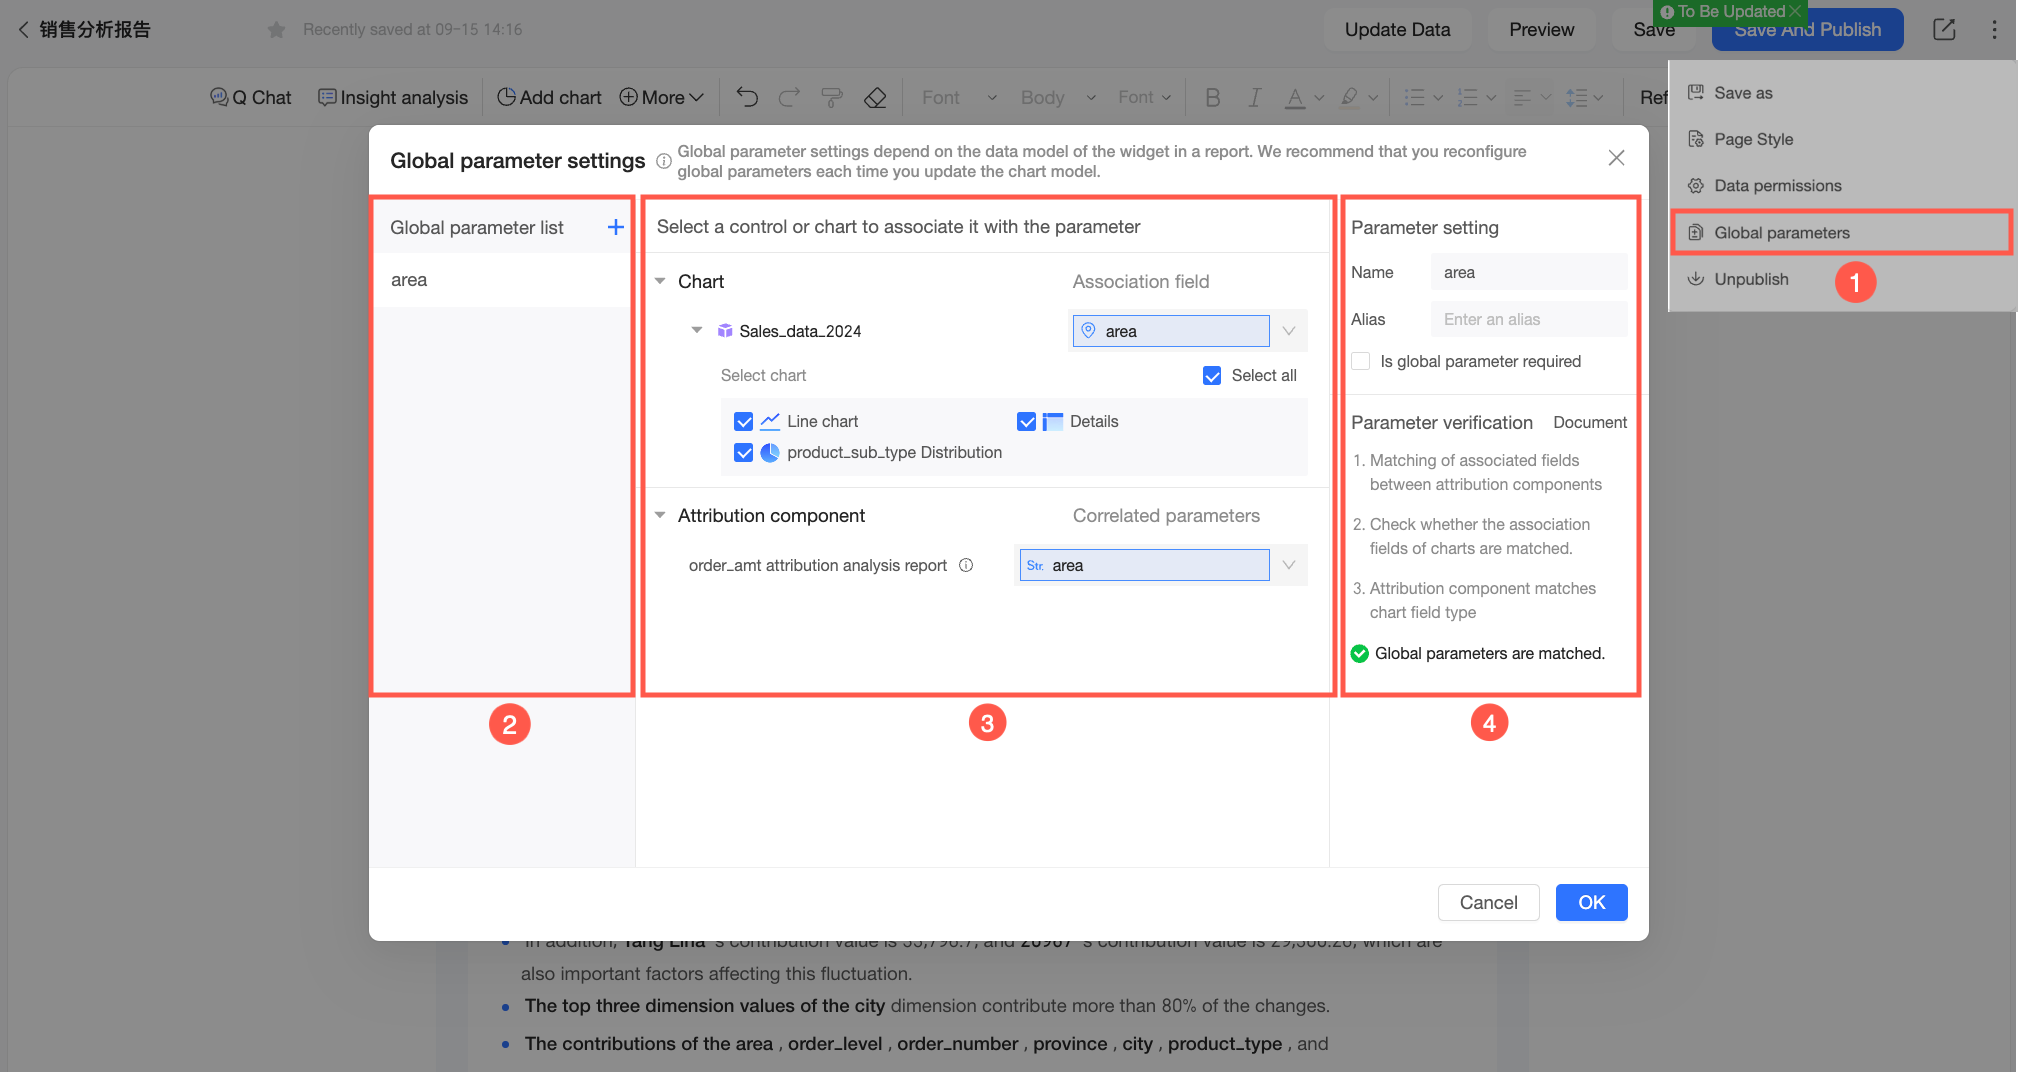
(Optional) By default, key driver analysis content is static after being added. To dynamically adjust the attribution perspective by time range, business dimension, or other conditions, configure global parameters. For example, you can pass different time parameters such as January 2025 or February 2025 to view sales attribution analysis for specific periods.
Global parameters pass dynamic values to the key driver analysis component, which regenerates results accordingly. For more information, see Global Parameters.