Pie chart
A pie chart shows how each part of your data contributes to the whole, making it easy to compare proportions at a glance. You can add data to a pie chart and configure its appearance on a DataV screen.
Prerequisites
You have created a DataV screen. For more information, see Create a data visualization screen.
Example
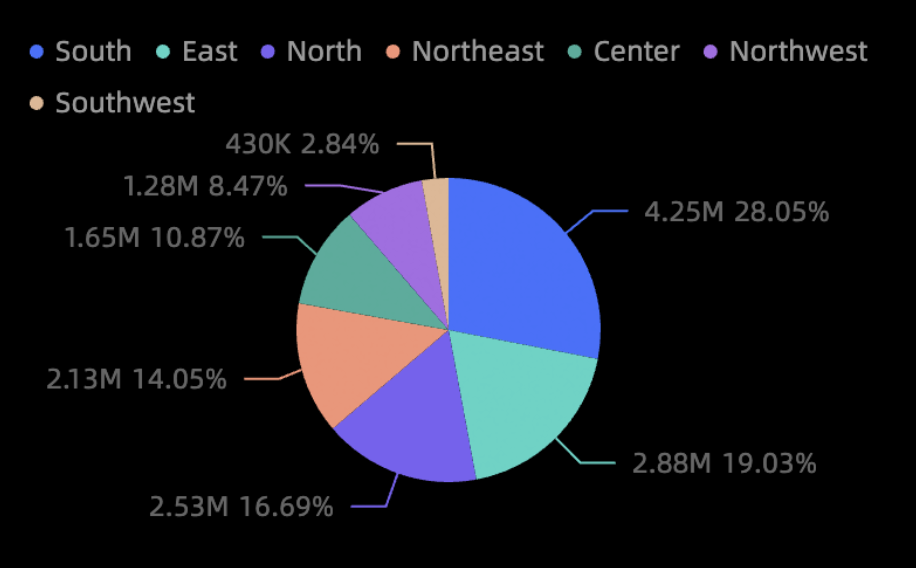
Data configuration
-
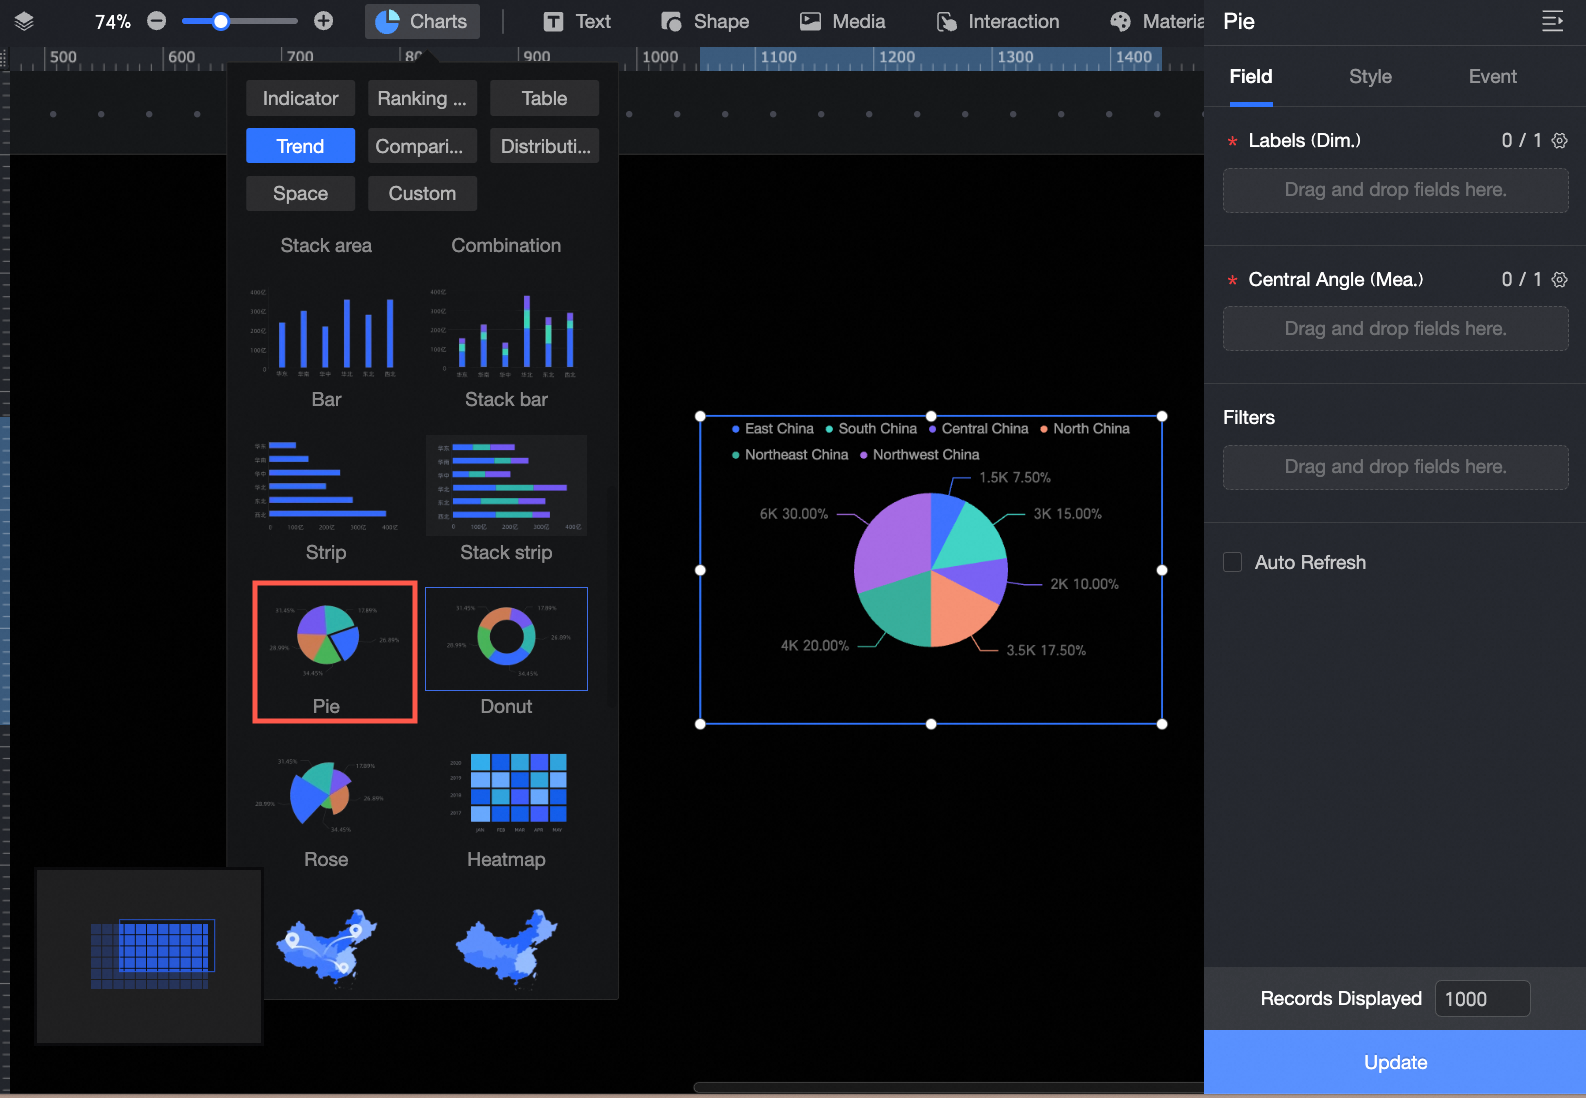
In the component library area, under Chart, find the Pie Chart and drag it to the canvas.
-
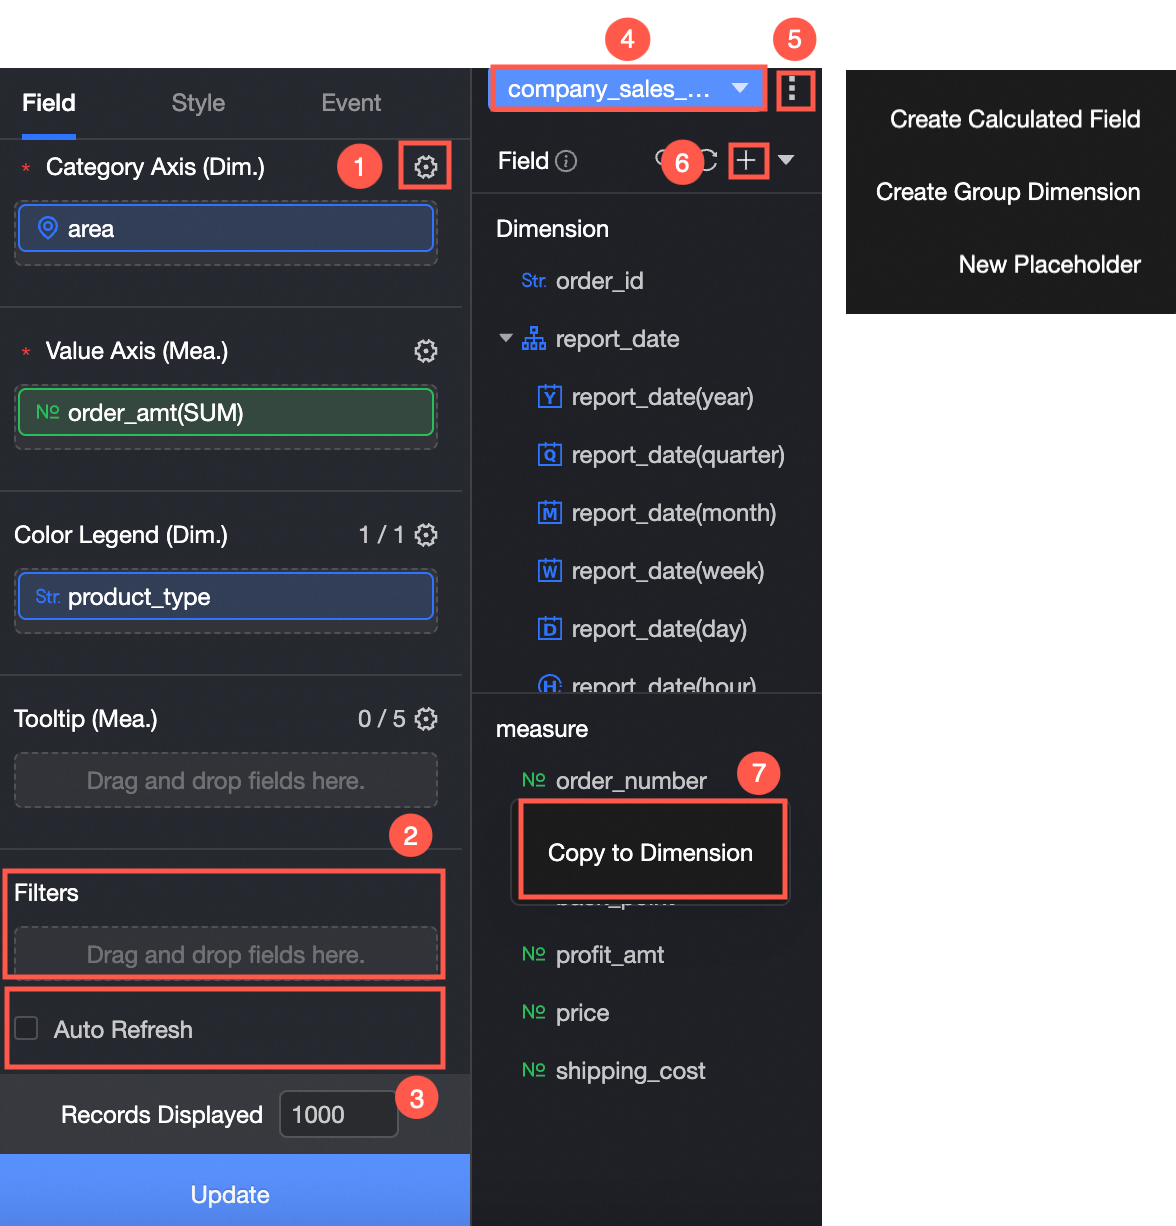
Click Please select a dataset and add data as shown in the following figure.
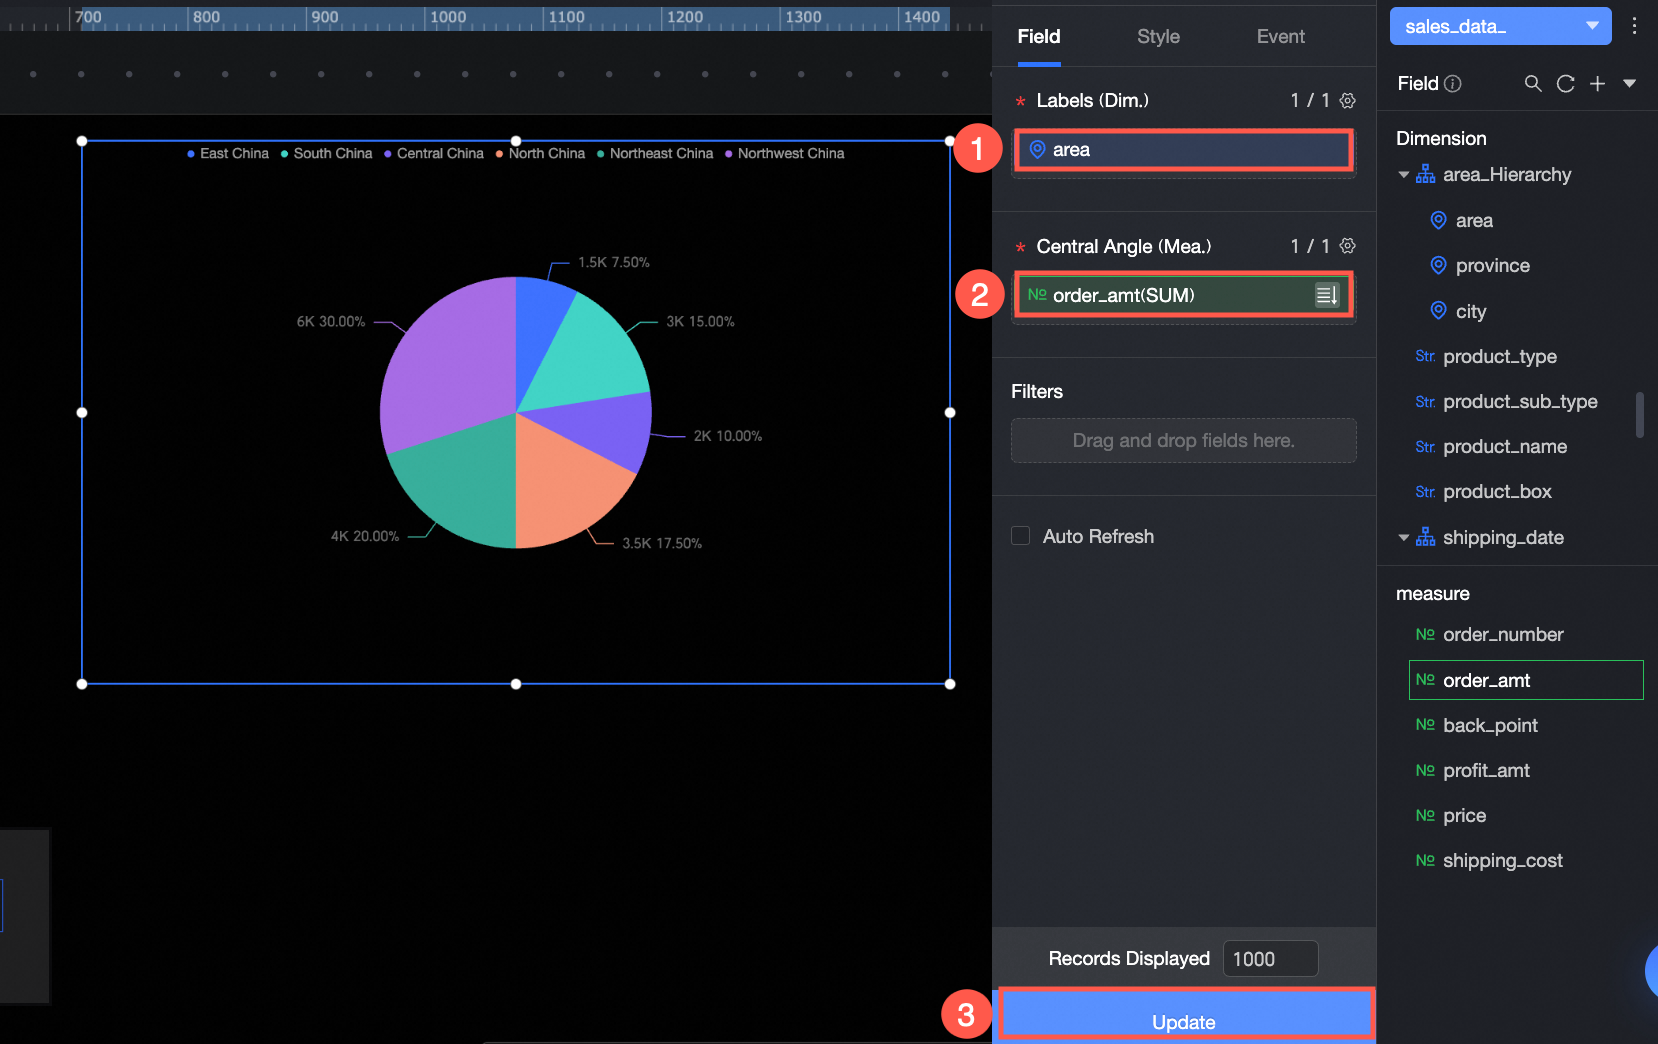
Additional operations are available:
-
Configure field styles in batches (①). For more information, see Configure field styles in batches.
-
Filter data (②). For more information, see Filter data.
-
Refresh data periodically (③). For more information, see Refresh data periodically.
-
Switch the dataset (④). For more information, see Switch a dataset.
-
Edit the dataset (⑤). For more information, see Edit a dataset.
-
Process data (⑥). For more information, see Create a calculated field, Create a dimension group, and Create a placeholder.
-
Duplicate a field (⑦). For more information, see Duplicate a field and convert the field to a dimension.
Chart styles
Position and size
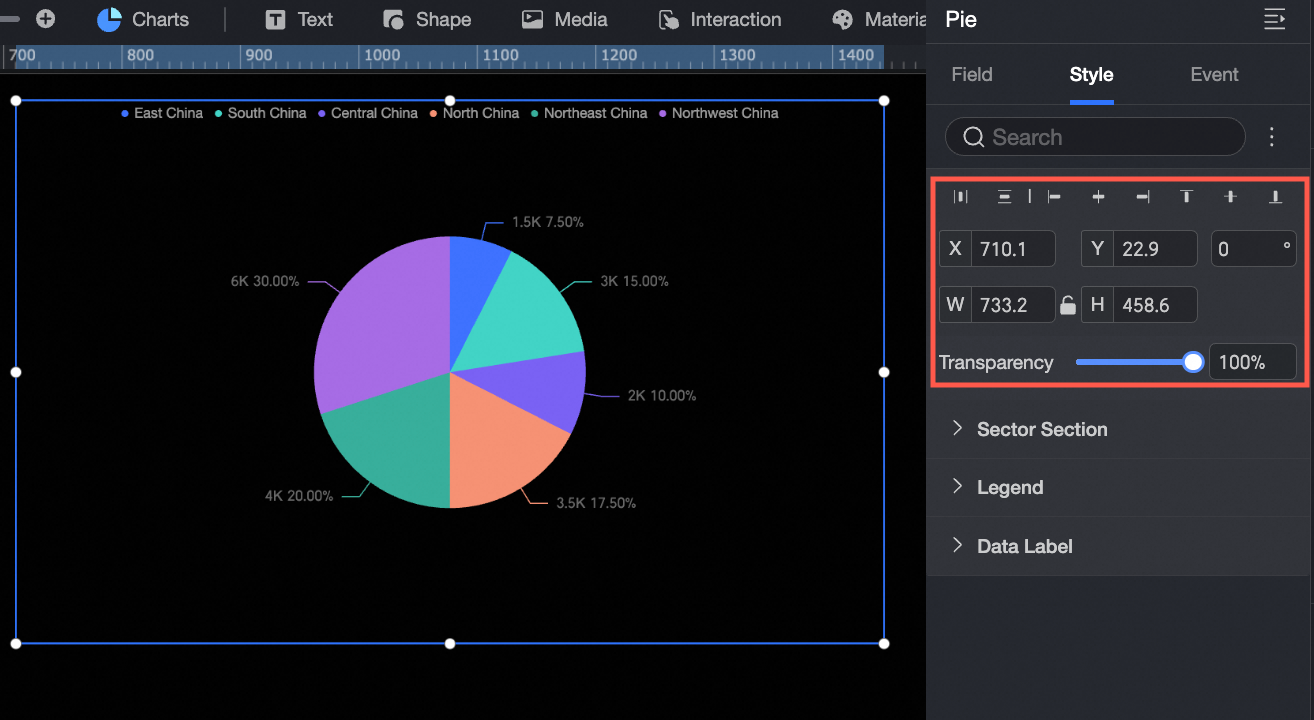
In the configuration panel, adjust the following component settings:
-
Adjust the alignment of the component. Options include left, center, and right.
-
Set the component's position using its X and Y coordinates. The origin is the top-left corner.
-
Set the component's rotation angle.
-
Set the component's size using its width (W) and height (H).
-
Lock the component to prevent changes to its size and position.
Slice
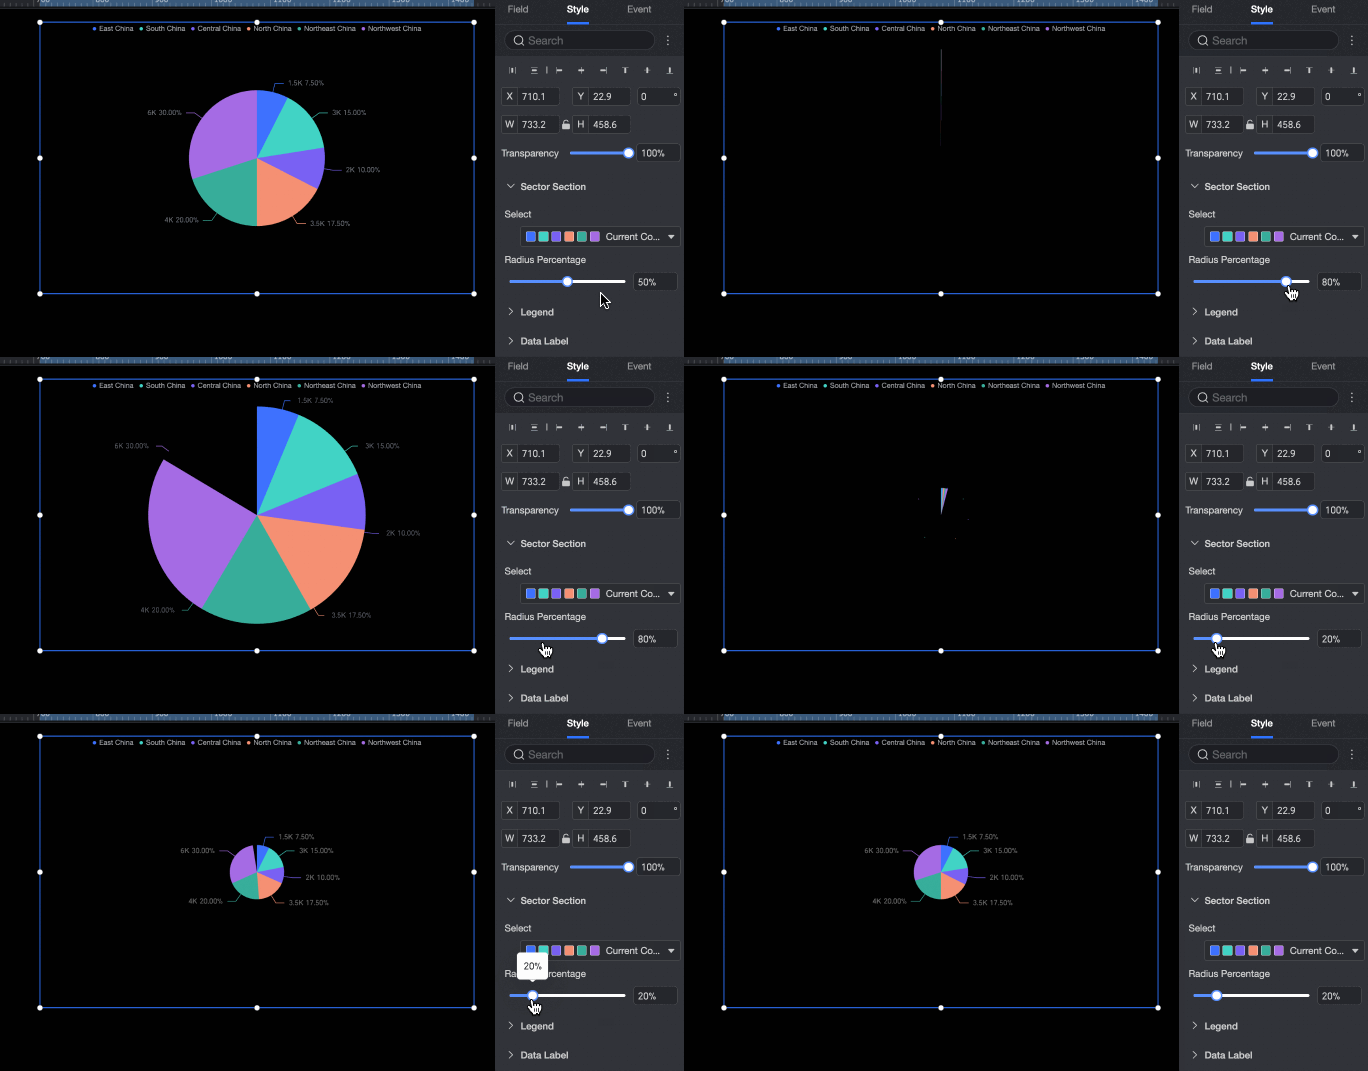
Configure the appearance of individual slices:
-
Set a color for each slice.
-
Adjust the radius of the slices by setting the radius ratio.
Legend
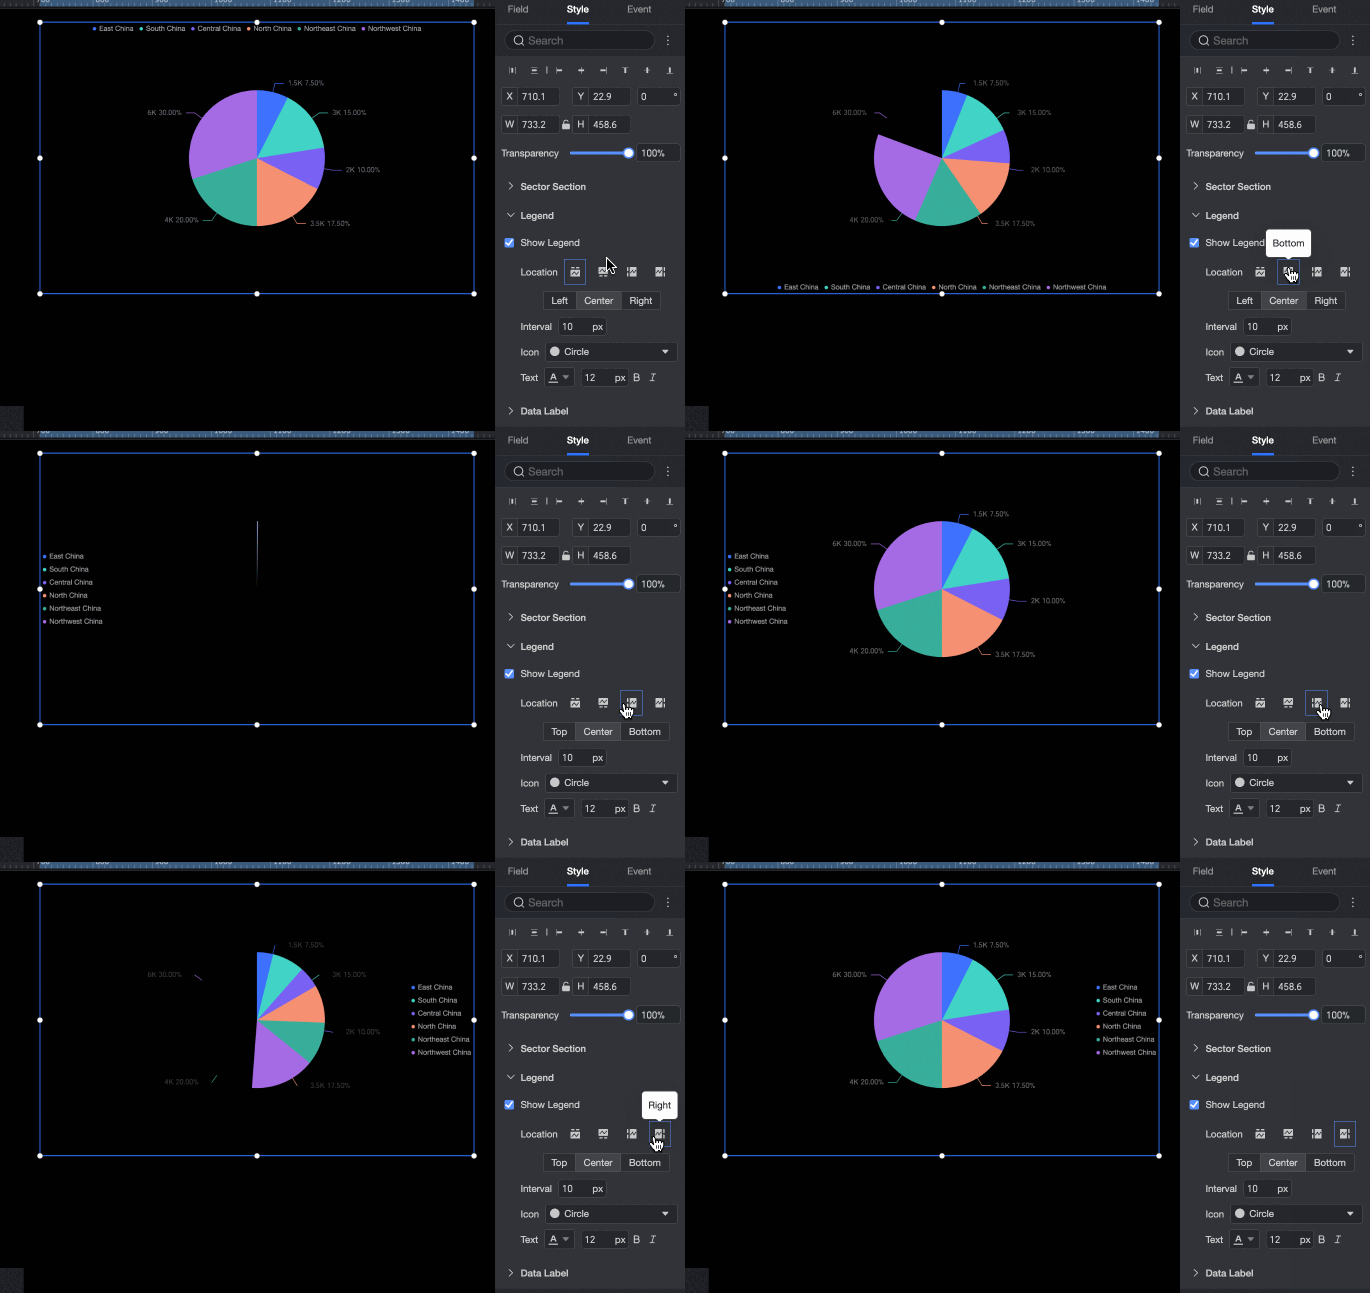
Configure the legend display:
-
Adjust the position of the legend. Options include Top, Bottom, Left, and Right.
-
Adjust the spacing between legend items.
-
Set the shape of the legend icons. Options include circle, rectangle, rounded rectangle, or triangle.
-
Set the style of the legend text, including color, font size, and bold or italic formatting.
Data labels
Configure data label display and formatting:
-
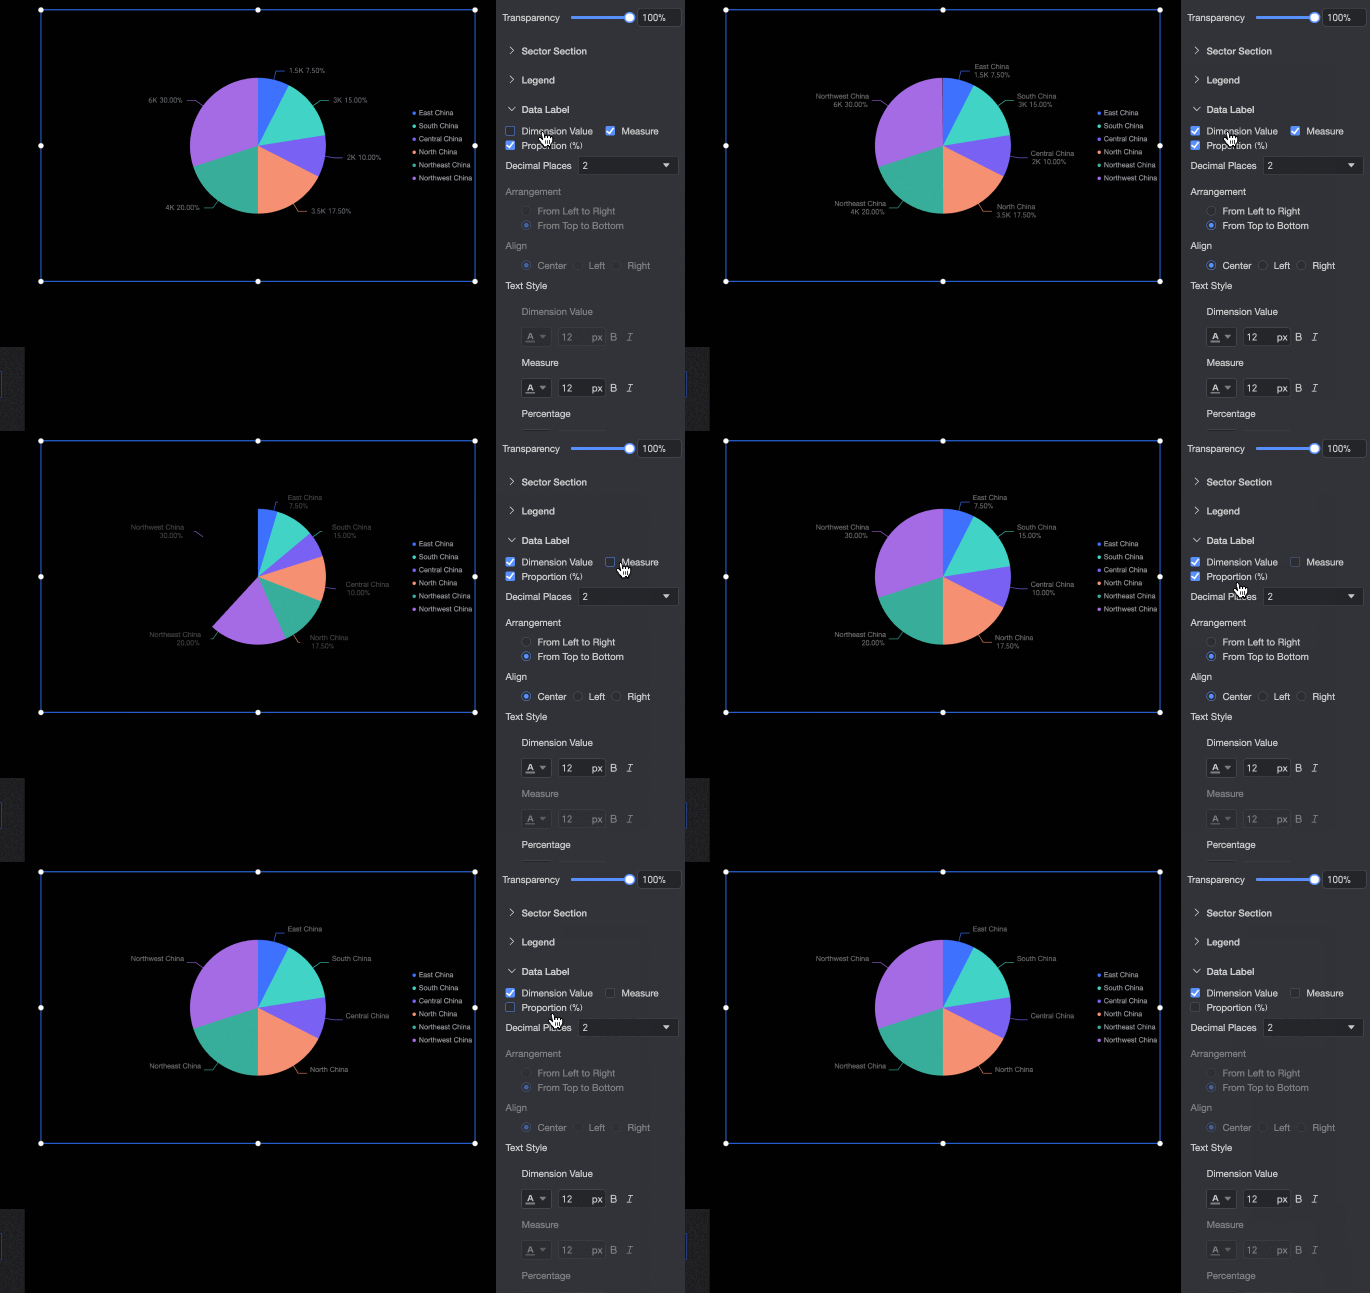
Select the data to display on each slice. Options include: dimension value, measure, and percentage.
-
Set the number of decimal places for the percentage to 0, 1, or 2.
-
Set the layout of the data labels to horizontal or vertical.
-
For vertical layouts, you can align the text left, center, or right.
-
Set the style of the data labels, including color, font size, and bold or italic formatting.