A progress bar in Quick BI is a visualization component that shows the progress of one or more measures toward their targets. It is ideal for monitoring task completion rates, key performance indicator (KPI) achievement, or resource consumption, helping you quickly assess the current status and identify highlights or risks in your business operations.
Overview
Use cases
Progress bars are commonly used to track progress, indicators, and trends. They highlight business performance and help you quickly identify operational anomalies by observing changes in indicators.
Key features
Calculation: Automatic calculation of completion rates.
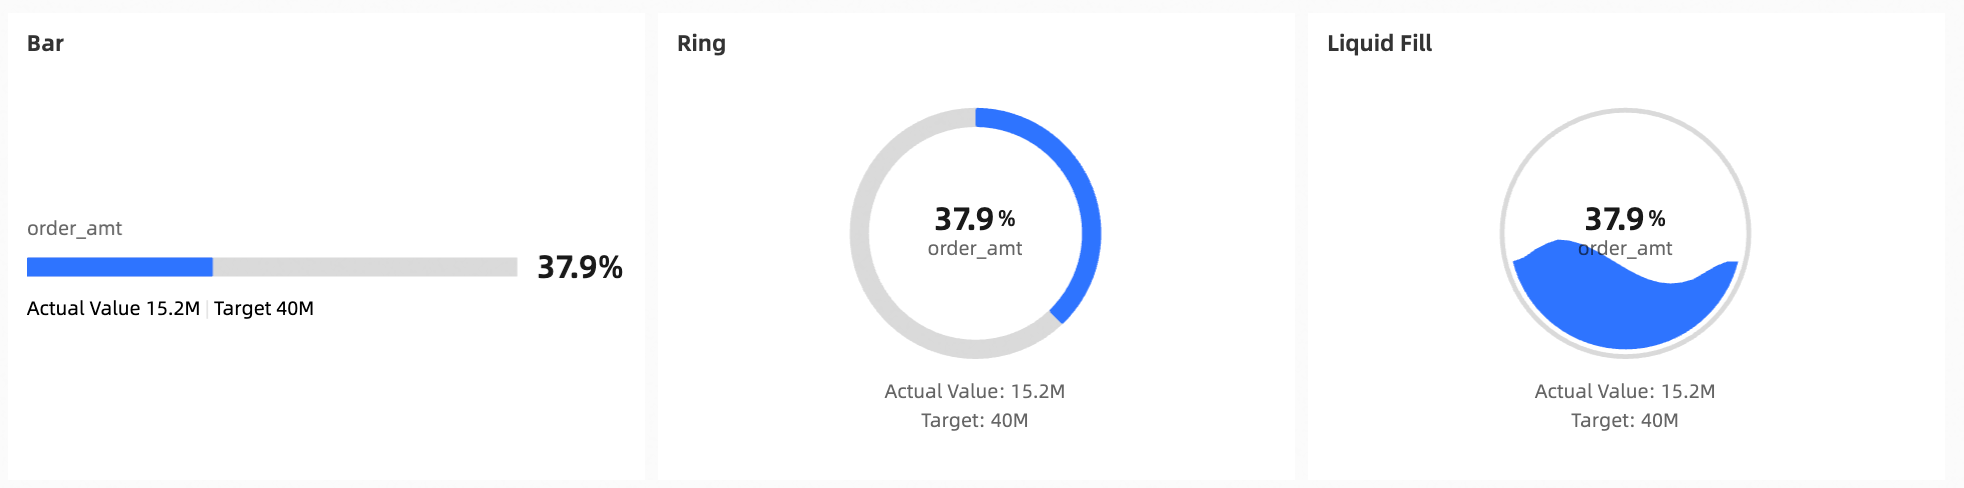
Visualization: Includes bar, ring, and liquid fill styles.
Annotations: Configure remarks and endnotes for indicators, and add hyperlinks to external systems.
Example
Limitations
Prerequisites: You have created a dashboard. For more information, see Create a Dashboard.
Notes
Before you use a progress bar, you must set a target value in the .
The Pointer (Mea.) field accepts one to five measures from your dataset.
Procedure
Configure chart data
On the Data panel, from the Measures list, select the required field and drag it to the Pointer (Mea.) field. You can also double-click the field.
In this example, the order_amount field is used.
Click Update to refresh the chart.
On the Style tab, in the Current Value/Target Value section, set the target value.
In this example, the value is set to a fixed value of 40,000,000.
 Note
NoteYou must set a target value for the progress bar. Otherwise, the progress is always displayed as 100%.
Configure chart style
On the Chart Design panel, use the Fields tab to configure the format for multiple chart fields at once.
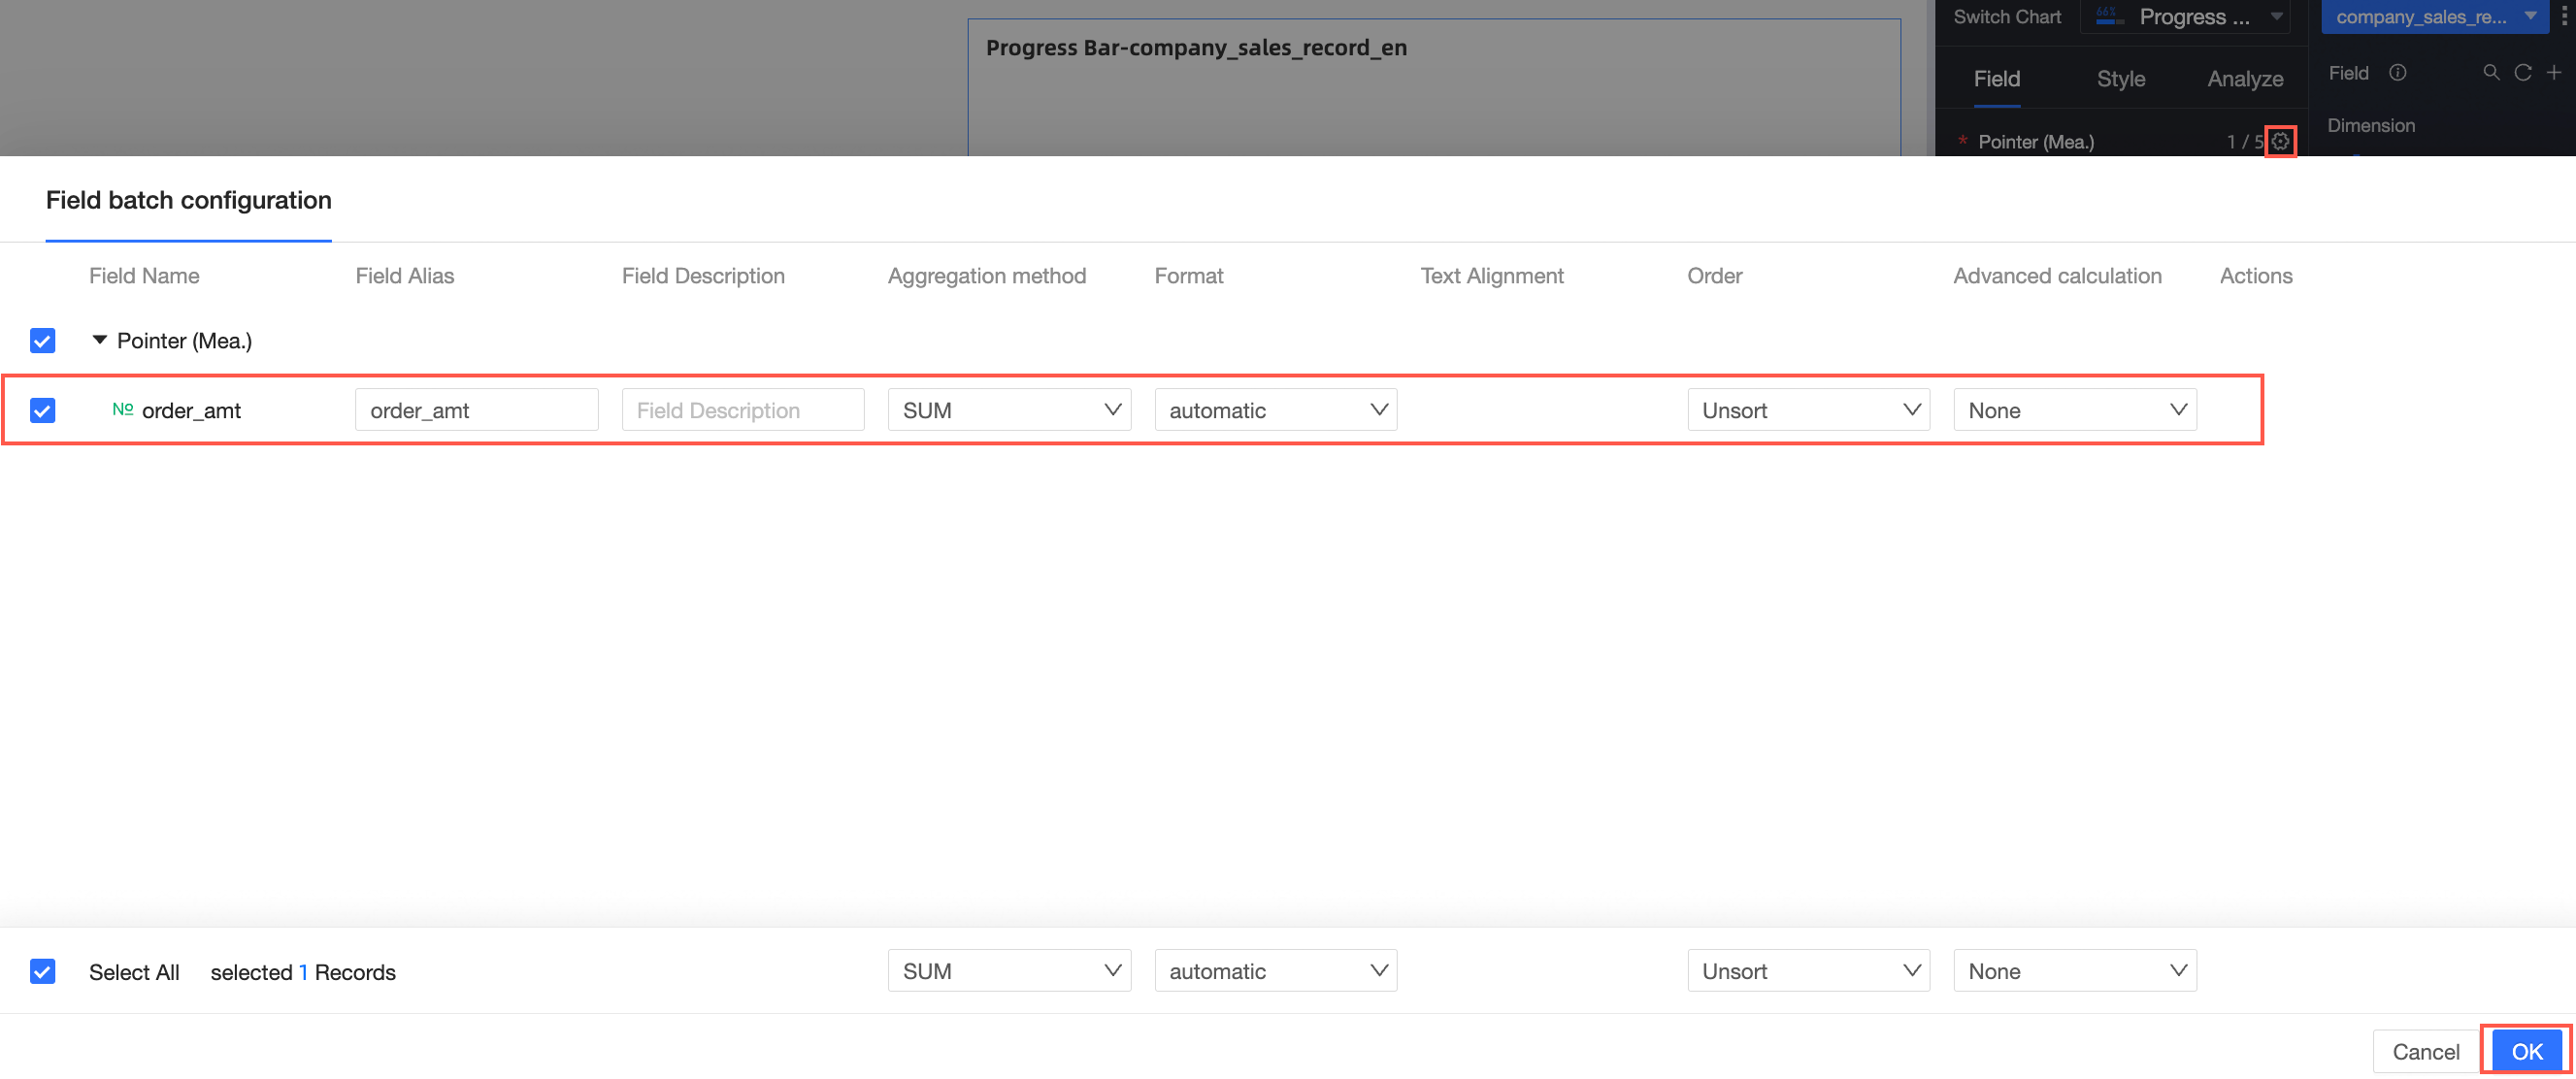
For more information about chart data configuration, see Configure Chart Fields.
On the Chart Design panel, you can configure the progress bar style on the Style tab.
The following sections describe style settings specific to this chart. For information about general style settings, see Configure the Chart Title Area.
To quickly find a configuration item, enter a keyword in the search box at the top of the configuration panel. You can also click the
 icon on the right to expand or collapse all categories.
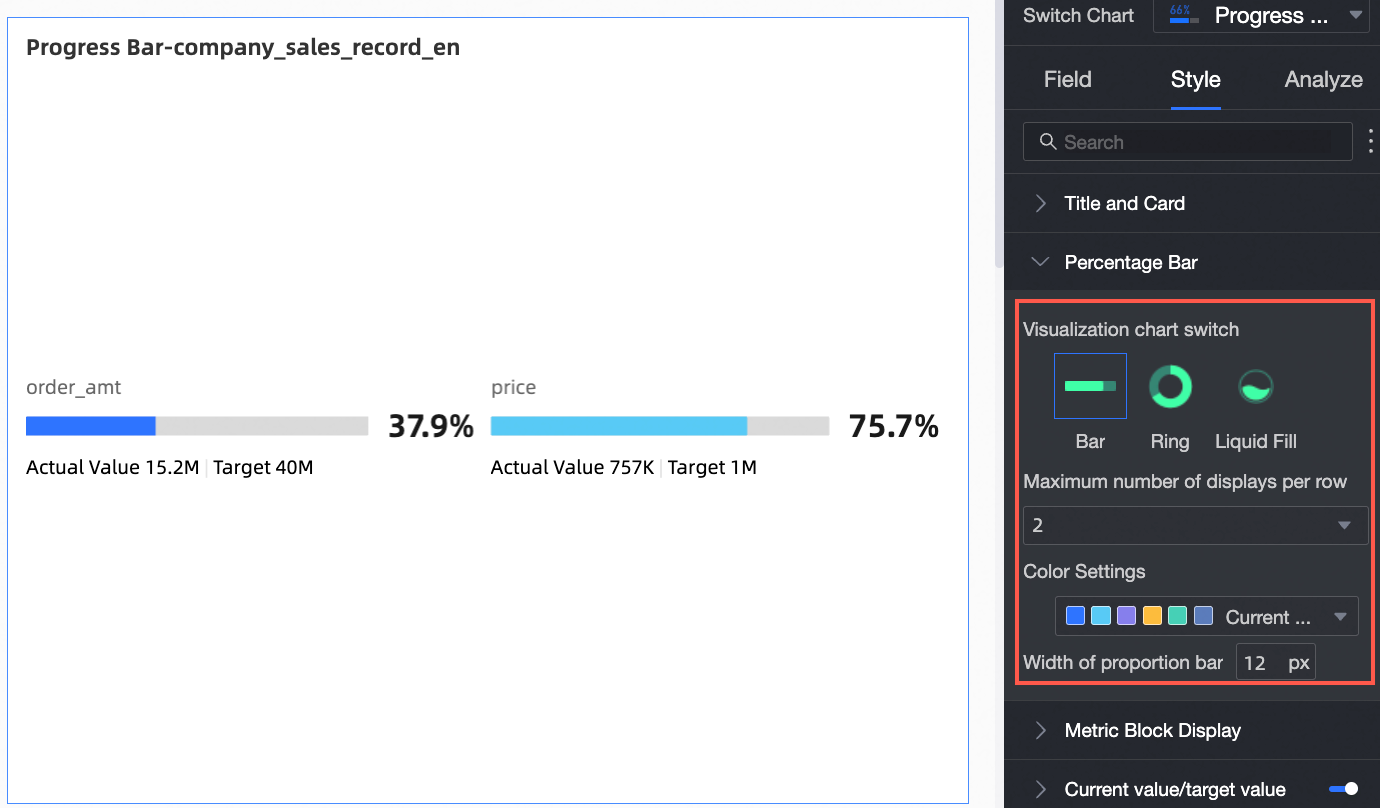
In the Progress Bar section, configure the Visual Style, Max Items Per Row, color scheme, and bar width.

Parameter
Description
Visual Style
Switch between bar, ring, and liquid fill styles.
Max Items Per Row
Specifies the maximum number of items to display in each row.
Color Scheme
Configures the color scheme for the progress bars. You can set a specific color for each progress indicator.
Bar Width
Customizes the width of the progress bar.
In the Indicator Content section, configure the style of the indicator content.
In the Current Value/Target Value section, set the target value and configure the text style for the display names.
You can use Conditional Formatting to set different colors for various value ranges to better visualize stages or trends in your data.
Parameter
Description
Select Field
Select the measure to format. All measures added to the Pointer (Mea.) area are available for selection.
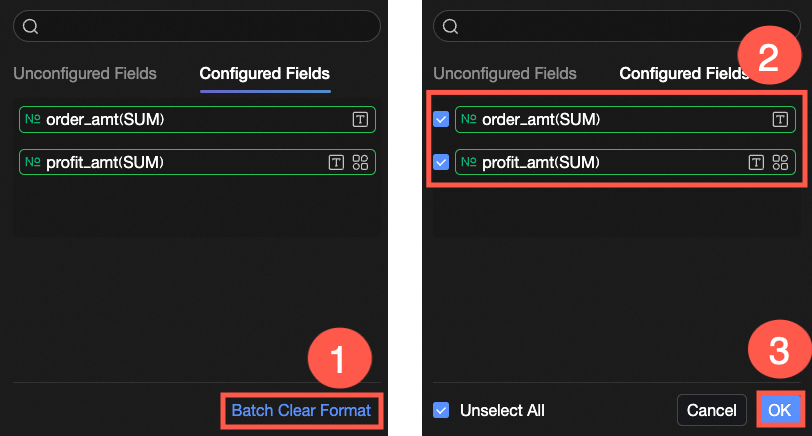
To remove unwanted conditional formats, click Bulk Clear Formats in the lower-right corner of the field panel. In the list that appears, select the formats to clear and click OK.
Conditional Style
Click the
icon. In the conditional formatting panel, set rules to highlight the text and background color for the selected measure. You can set conditional rules for the current field based on the values of another field.You need to configure the following items:
Field: Specifies the data field to which the conditional rule applies. By default, this is the field you selected in Select Field. You can also select another field from the chart to create more complex conditional rules.
Condition Type: Sets the comparison basis for the rule. Options include Compare to Fixed Value, By Percentage Range, and Compare to Dynamic Field.
Rule: Defines the logic for the condition and the corresponding display style (such as text color, bold, italics, and background color) to apply when the condition is met.
Add Rule: Adds a new condition rule.
Sync Style To
Applies the current conditional format to other measures.
NoteThis is a one-time action. If you adjust the source style, you must sync it again.

 icon. In the conditional formatting panel, set rules to highlight the text and background color for the selected measure. You can set conditional rules for the current field based on the values of another field.
Next steps
To allow others to view the dashboard, you can share it with specific users. For more information, see Share a Dashboard.
To create a complex, menu-driven portal for thematic analysis, you can integrate your dashboard into a data portal. For more information, see Create a PC Data Portal.
FAQ
1. Why does the progress bar show 100%?
A: This typically happens if you have not set a target value. On the Style tab, go to the Current Value/Target Value section and set a target value. This can be a fixed value or a dynamic value from a field in your dataset.
2. Which field to use for "Pointer (Mea.)"?
A: This area accepts measure fields that represent the current value or progress. The progress bar calculates this value as a percentage of your specified target value and displays the result.
3. How to change the progress bar style?
A: On the Style tab, find the Progress Bar section. Click the Visual Style option to select "bar", "ring", or "liquid fill".
4. How to display multiple indicators?
A: Yes. Drag multiple measure fields (up to five) representing the current values to the Pointer (Mea.) area. A separate progress bar is created for each measure. You must set a target value for them, either individually or collectively. You can also adjust the layout in the style settings, for example, by setting the maximum number of items per row.