Develop custom charts
When built-in charts do not meet your business visualization needs, you can develop custom charts for use in AIPro visual reports. This capability extends the available chart types and helps you present business data more accurately. This topic describes two development methods to help you quickly develop and upload custom charts to the platform.
Prerequisites
Purchase: Your organization has purchased Quick BI AIPro.
Permissions: Only users with AIPro centralized management permissions can access the Admin Console to upload custom charts. For details about permission settings, see user permissions.
Development methods
You can choose either of the following methods to develop a custom chart based on your needs.
Method | Best for | Key features |
Business users and BI administrators with no coding experience. | Use natural language to direct the AI to automatically generate, debug, build, and upload chart code. | |
Technical users with front-end development experience. | Write code by hand and upload the chart from the Chart Management page in the Admin Console. |
Method 1: Skill-assisted development
Use the quickbi-custom-ai-chart-builder Skill provided by Quick BI to complete the entire chart development process through natural language conversations in your local IDE. You do not need to write code manually; the AI guides you through requirements analysis, code generation, real-time debugging, building, packaging, and uploading.
Prepare your local environment
Before you start developing charts, make sure you have completed the following preparations in your local environment.
Install Node.js: Download and install Node.js version 22.20.0 or later from the official website.
npm source: Use the official npm source:
https://registry.npmjs.org.Install an AI-powered programming tool: Download and install a local AI-powered programming tool that supports Skill and MCP functions, such as Qoder IDE.
Procedure
To develop a custom chart with Skill assistance, follow these steps: Install the Skill > Connect to MCP > Develop the chart > Debug in real time > Build and upload. The following sections describe each step in detail.
Step 1: Install the Skill
Run the following command in your local terminal to install the quickbi-custom-ai-chart-builder Skill provided by Quick BI.
npx skills add https://github.com/quick-bi/skills.git --skill quickbi-custom-ai-chart-builderStep 2: Connect to MCP
You only need to configure the MCP connection once. This configuration can be reused in later sessions. If you have already configured Quick BI MCP in your local IDE, you can skip this step.
The MCP service acts as a bridge between the Skill and the Quick BI platform, enabling tasks like retrieving a dataset, local preview, and chart upload. The first time you use the Skill, the AI guides you through configuring the MCP service. After configuration, you can develop, debug, and upload charts automatically through MCP. Follow these steps to configure the service.
Obtain configuration credentials
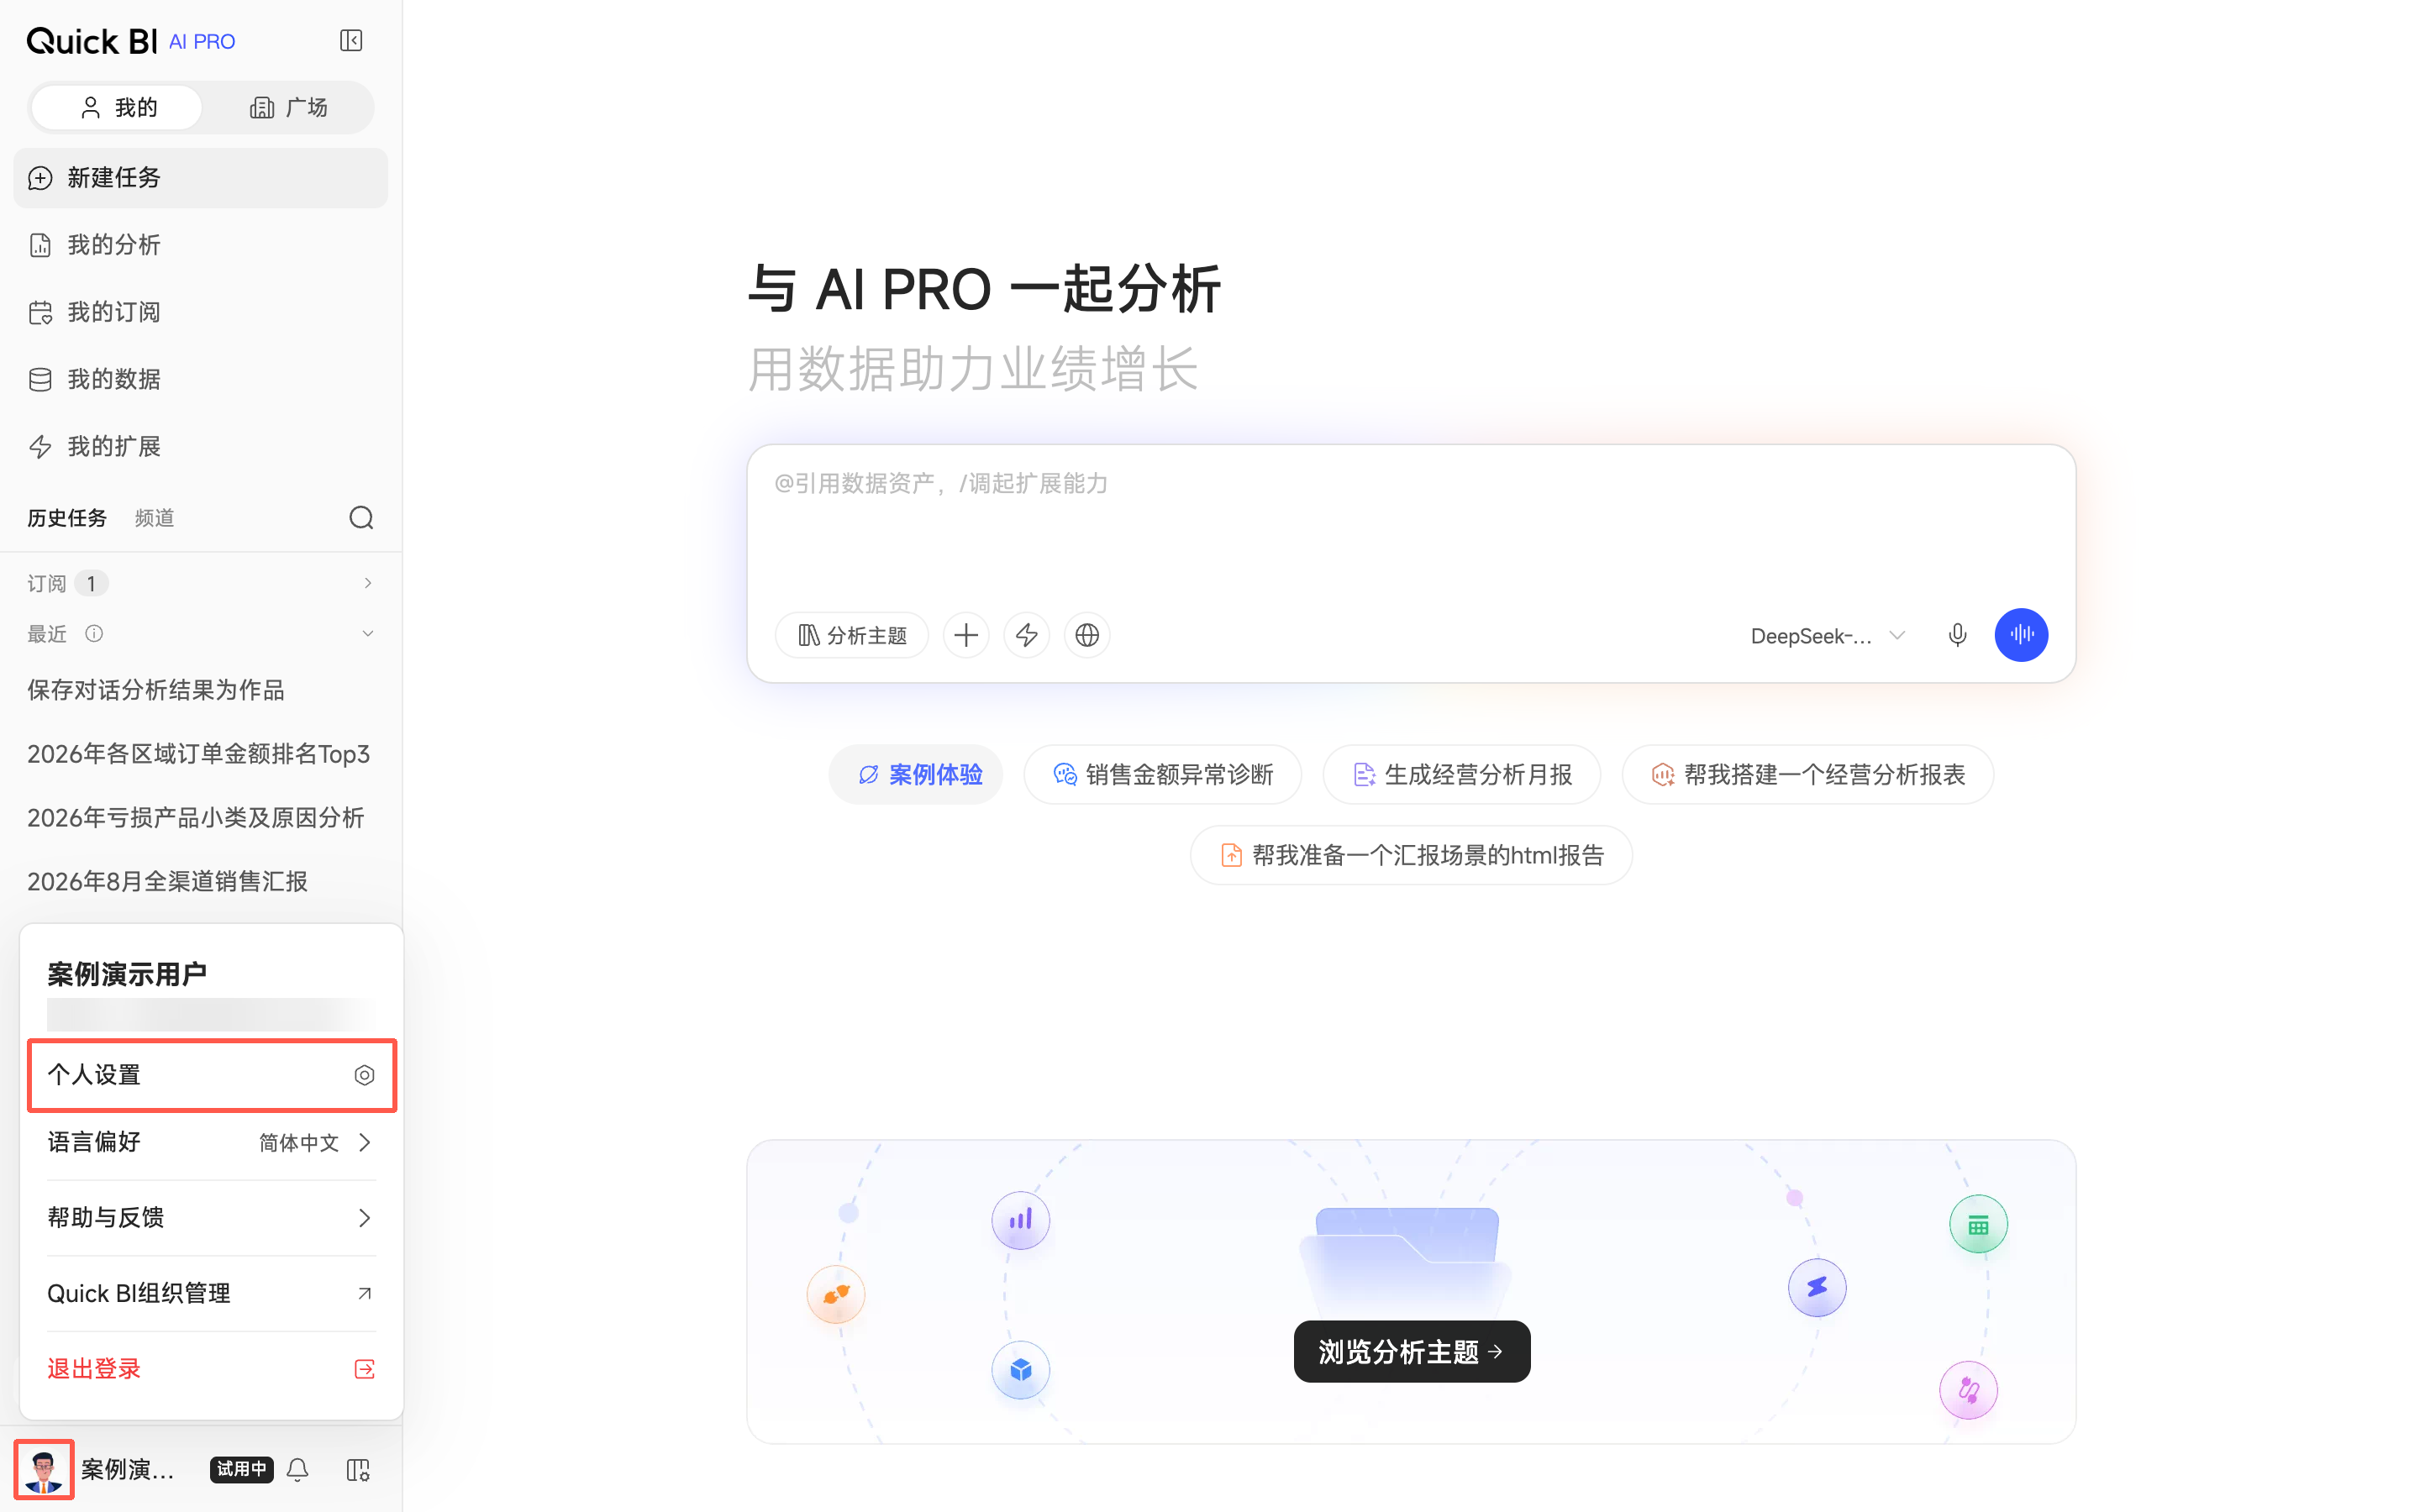
Log in to Quick BI AIPro, hover over your profile picture in the lower-left corner of the page, and click Personal Settings.
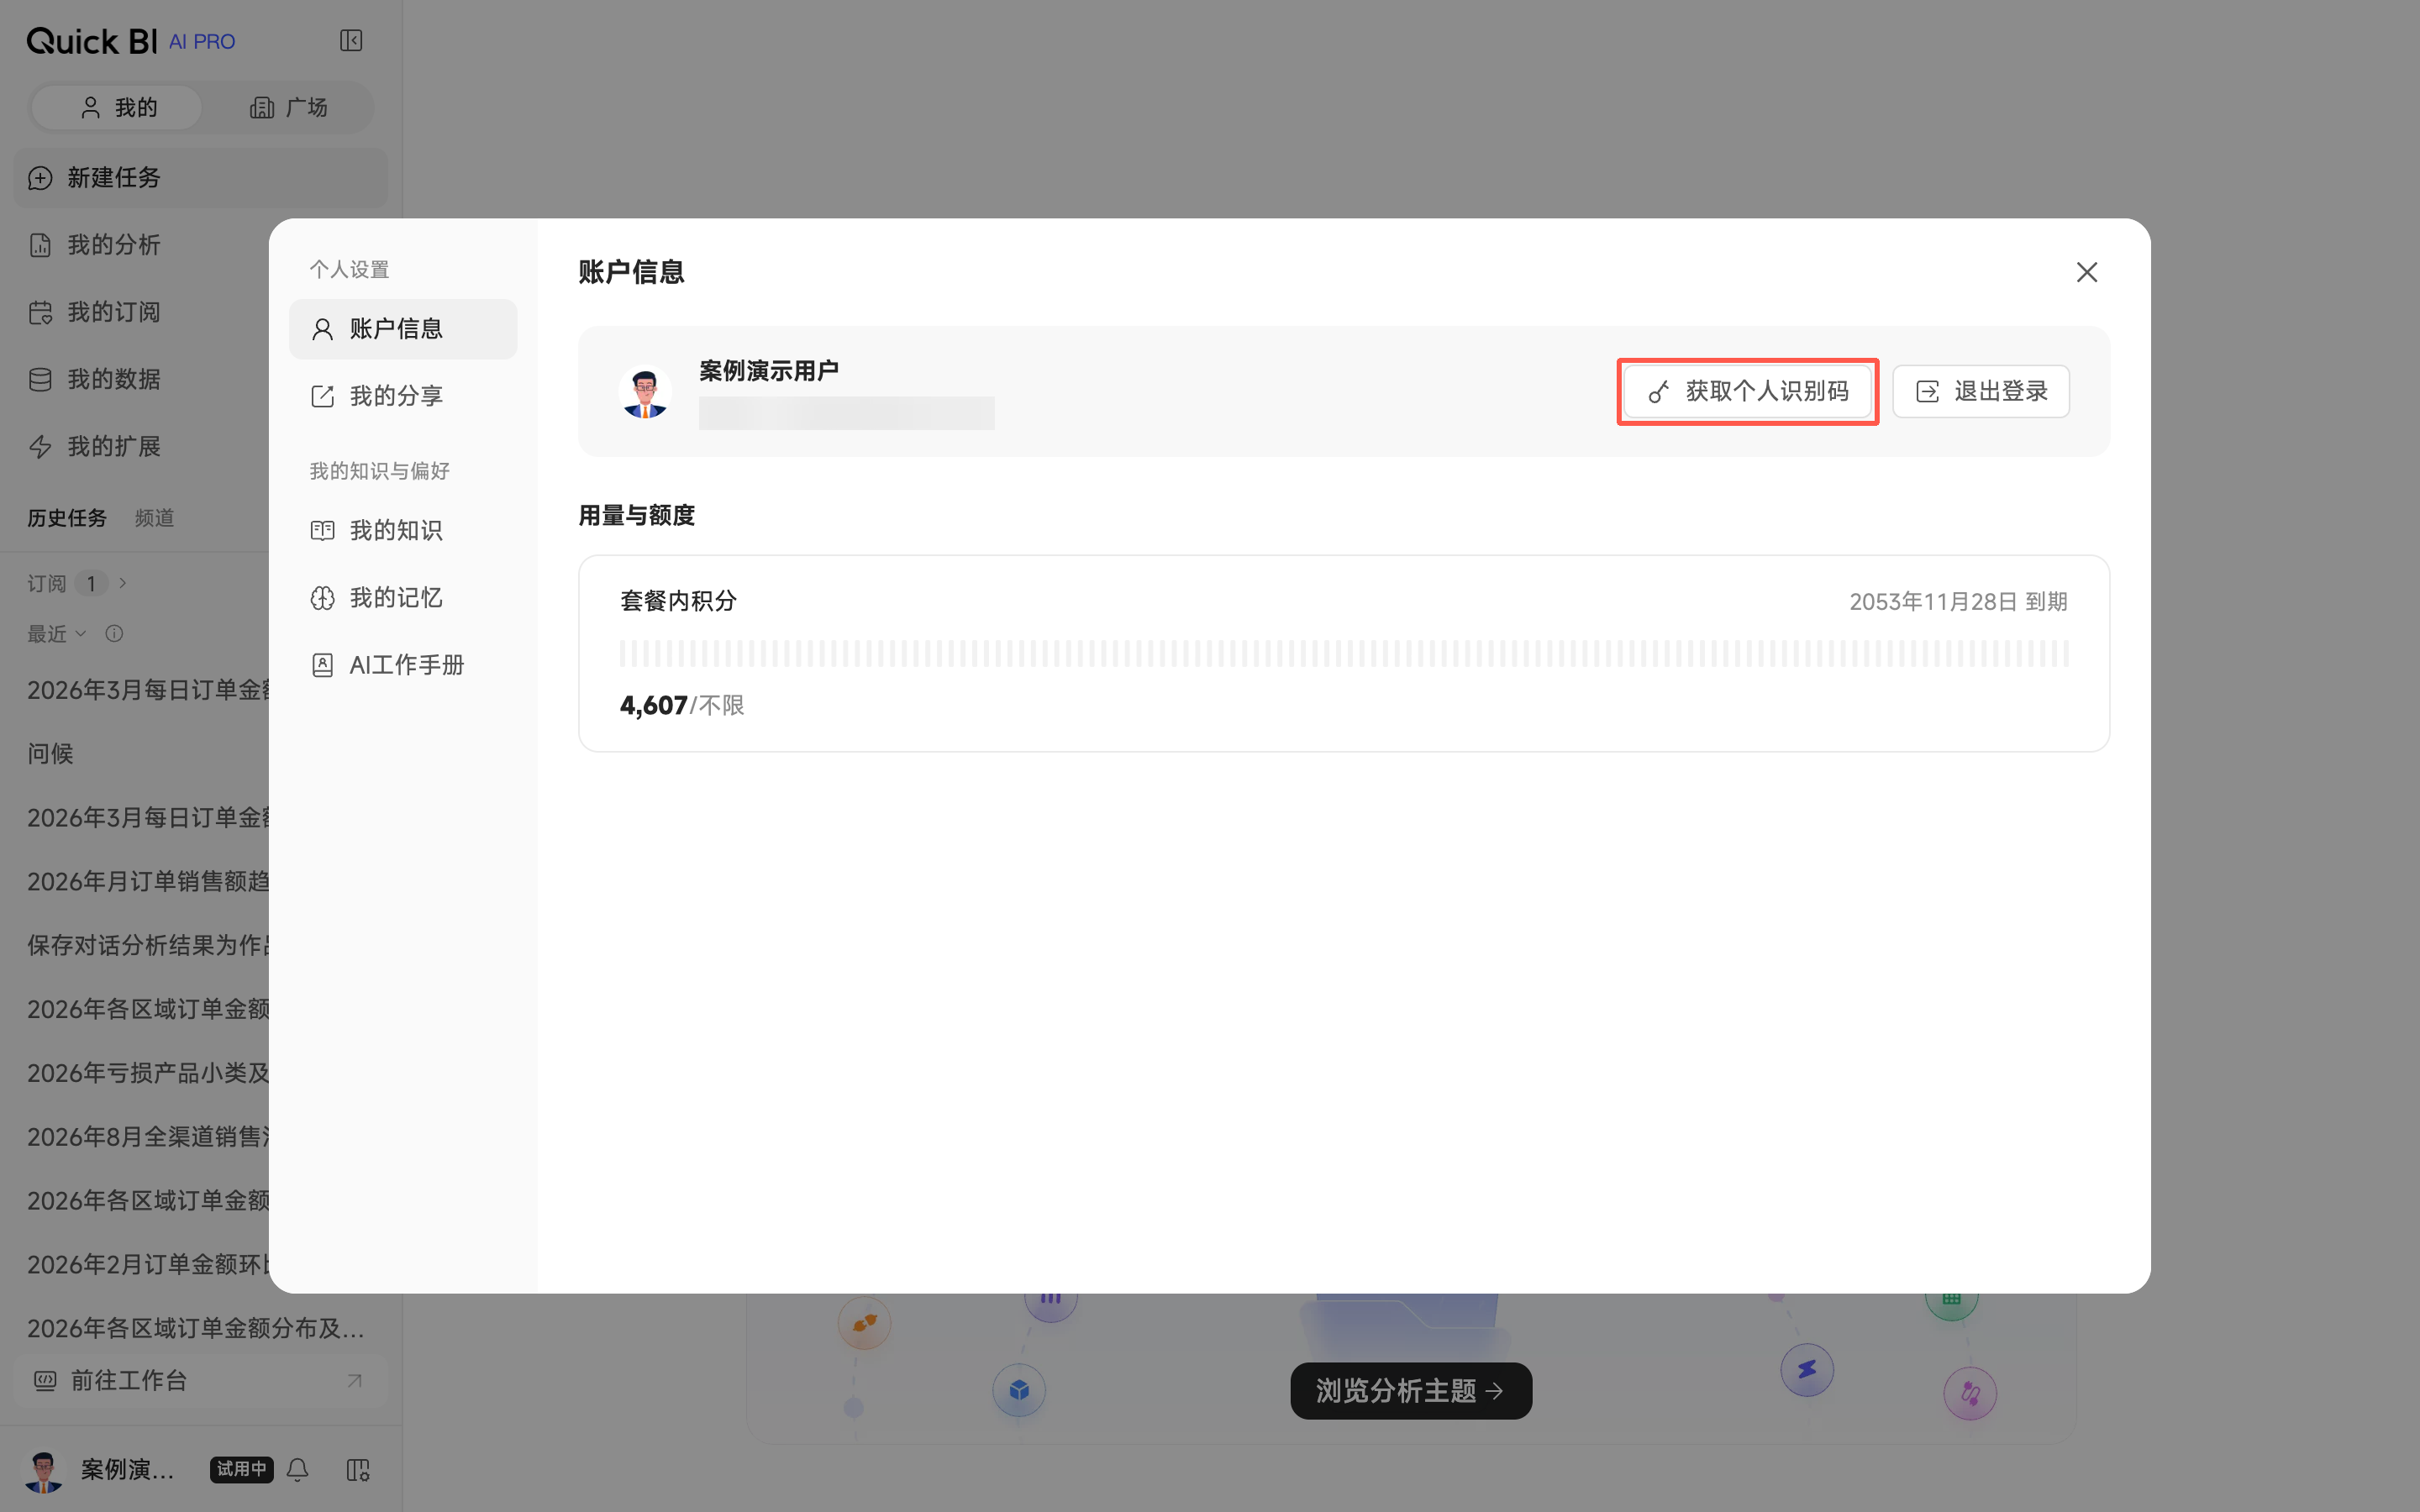
In the Personal Settings dialog box, on the Account Information tab, click Get Personal Identification Code.
On the Personal Identification Code panel, find the MCP Installation card and click Copy. The configuration information is copied to your clipboard. Paste it into the chat dialog in your local IDE, such as Qoder IDE, and the client will automatically apply the Quick BI MCP service configuration.
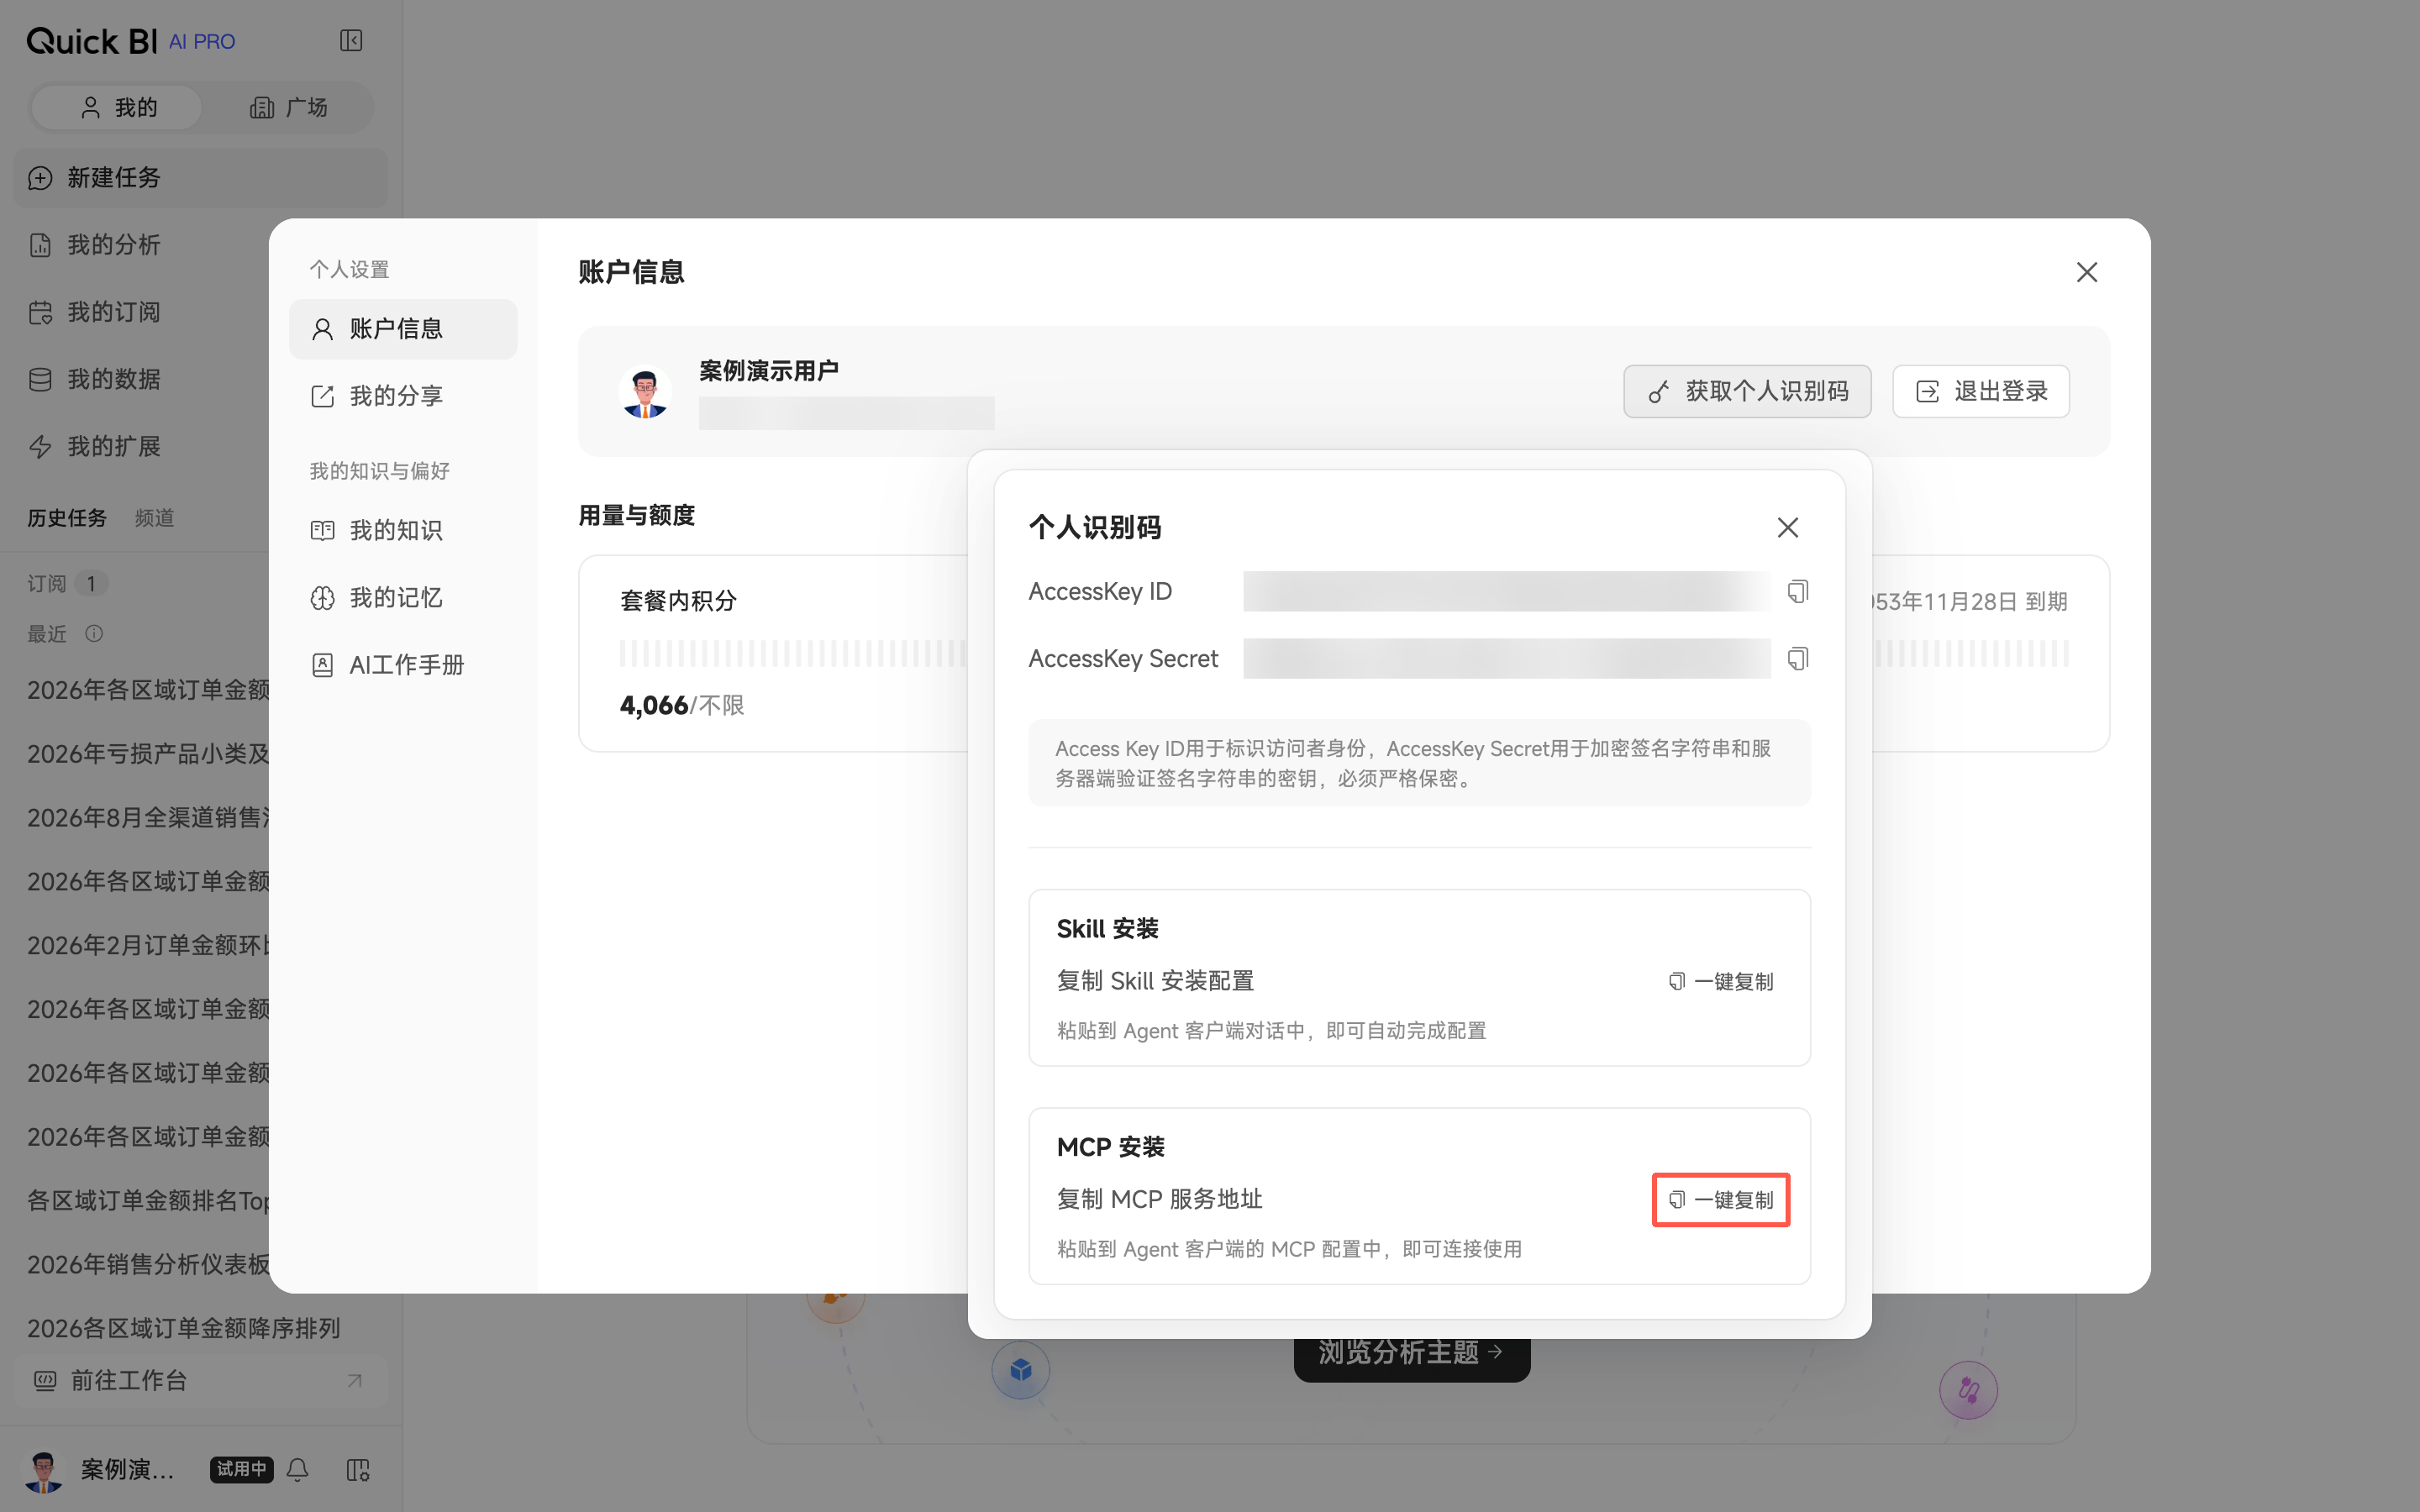 The copied configuration information includes the following:
Configuration
Description
api_keyAn identifier for the caller.
api_secretThe secret key paired with the
api_key.user_tokenA token representing the current user that defines the access scope for data and assets.
server_domainThe Quick BI service endpoint. For the public cloud, this is
https://bi.aliyun.com.ImportantThe
api_keyandapi_secretare sensitive credentials. Share them only with trusted systems and authorized personnel. Keep them secure and prevent disclosure. If you suspect a leak, rotate your credentials immediately.Paste the copied configuration information into the IDE chat dialog and send it. The Skill automatically reads this information to complete the configuration.
Configure the MCP Server structure (optional): If your IDE does not support automatic configuration, you can enter the information manually.
{
  "mcpServers": {
    "quickbi": {
      "url": "<server_domain>",
      "type": "https",
      "headers": {
        "x-quickbi-server-domain": "<server_domain>",
        "x-quickbi-api-key": "<api_key>",
        "x-quickbi-api-secret": "<api_secret>"
      }
    }
  }
}
Load and verify: After saving the configuration, reload the MCP Server or restart the IDE. Confirm that the Quick BI Skill appears in the tool list. If it is unavailable or you encounter connection failures, obtain the configuration information again and retry.
Step 3: Develop the chart
In your local IDE, call the Quick BI custom chart Skill and use natural language to describe your chart requirements to start the development process. For example, "Help me develop a radial bar chart."
The AI will confirm details with you, such as chart type, data fields, and interaction requirements, and then generates a chart implementation plan (PLAN.md) for your review. After you confirm the plan, the AI automatically generates the chart code.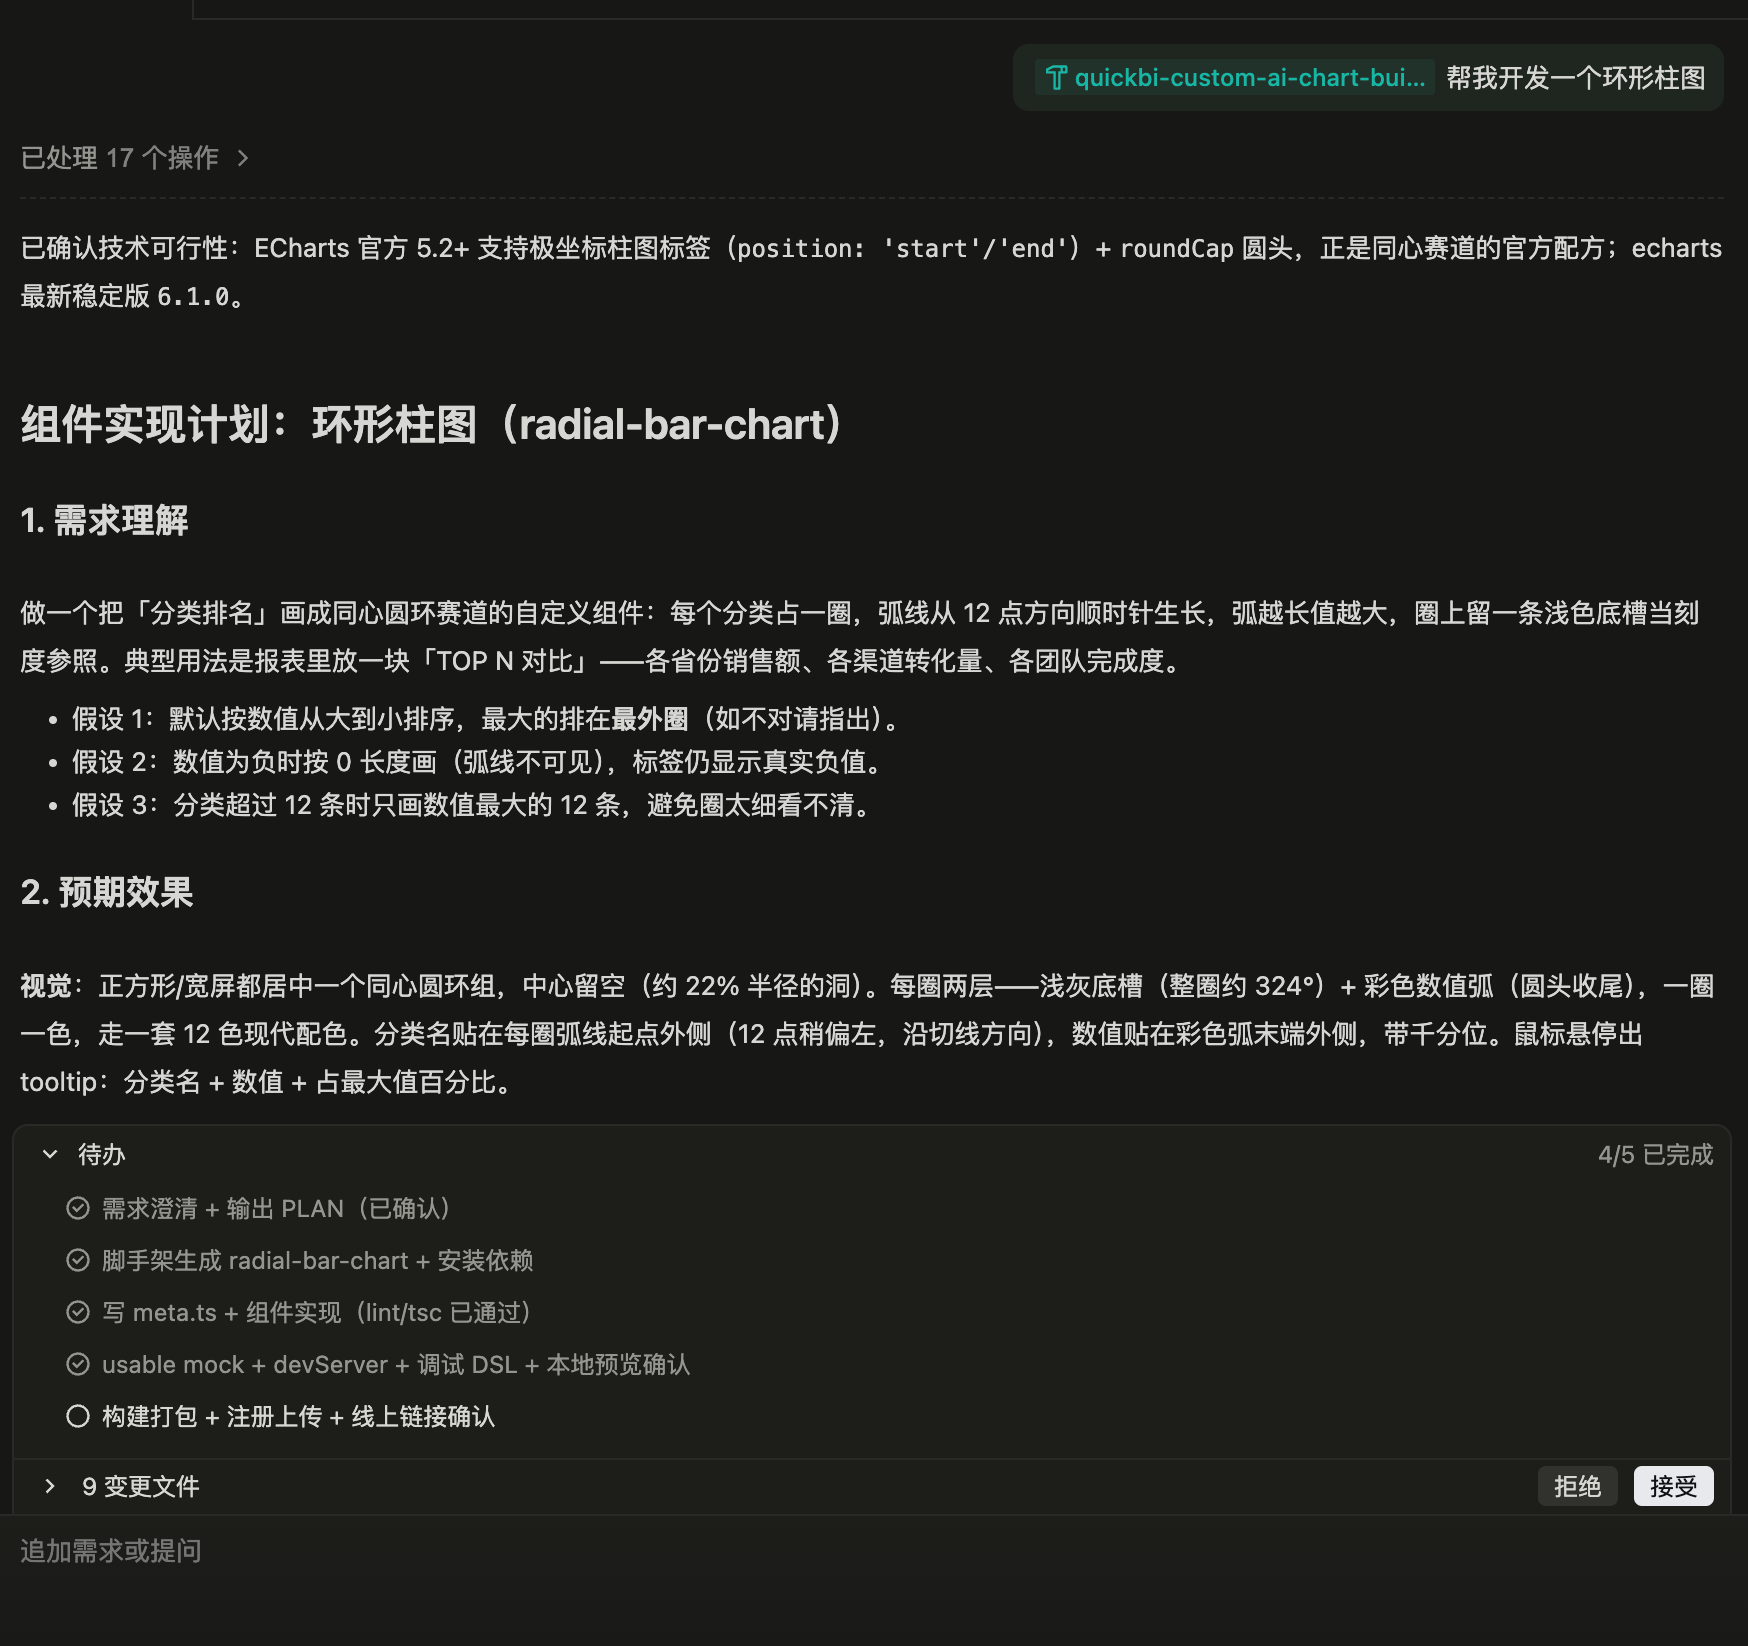
Step 4: Real-time debugging
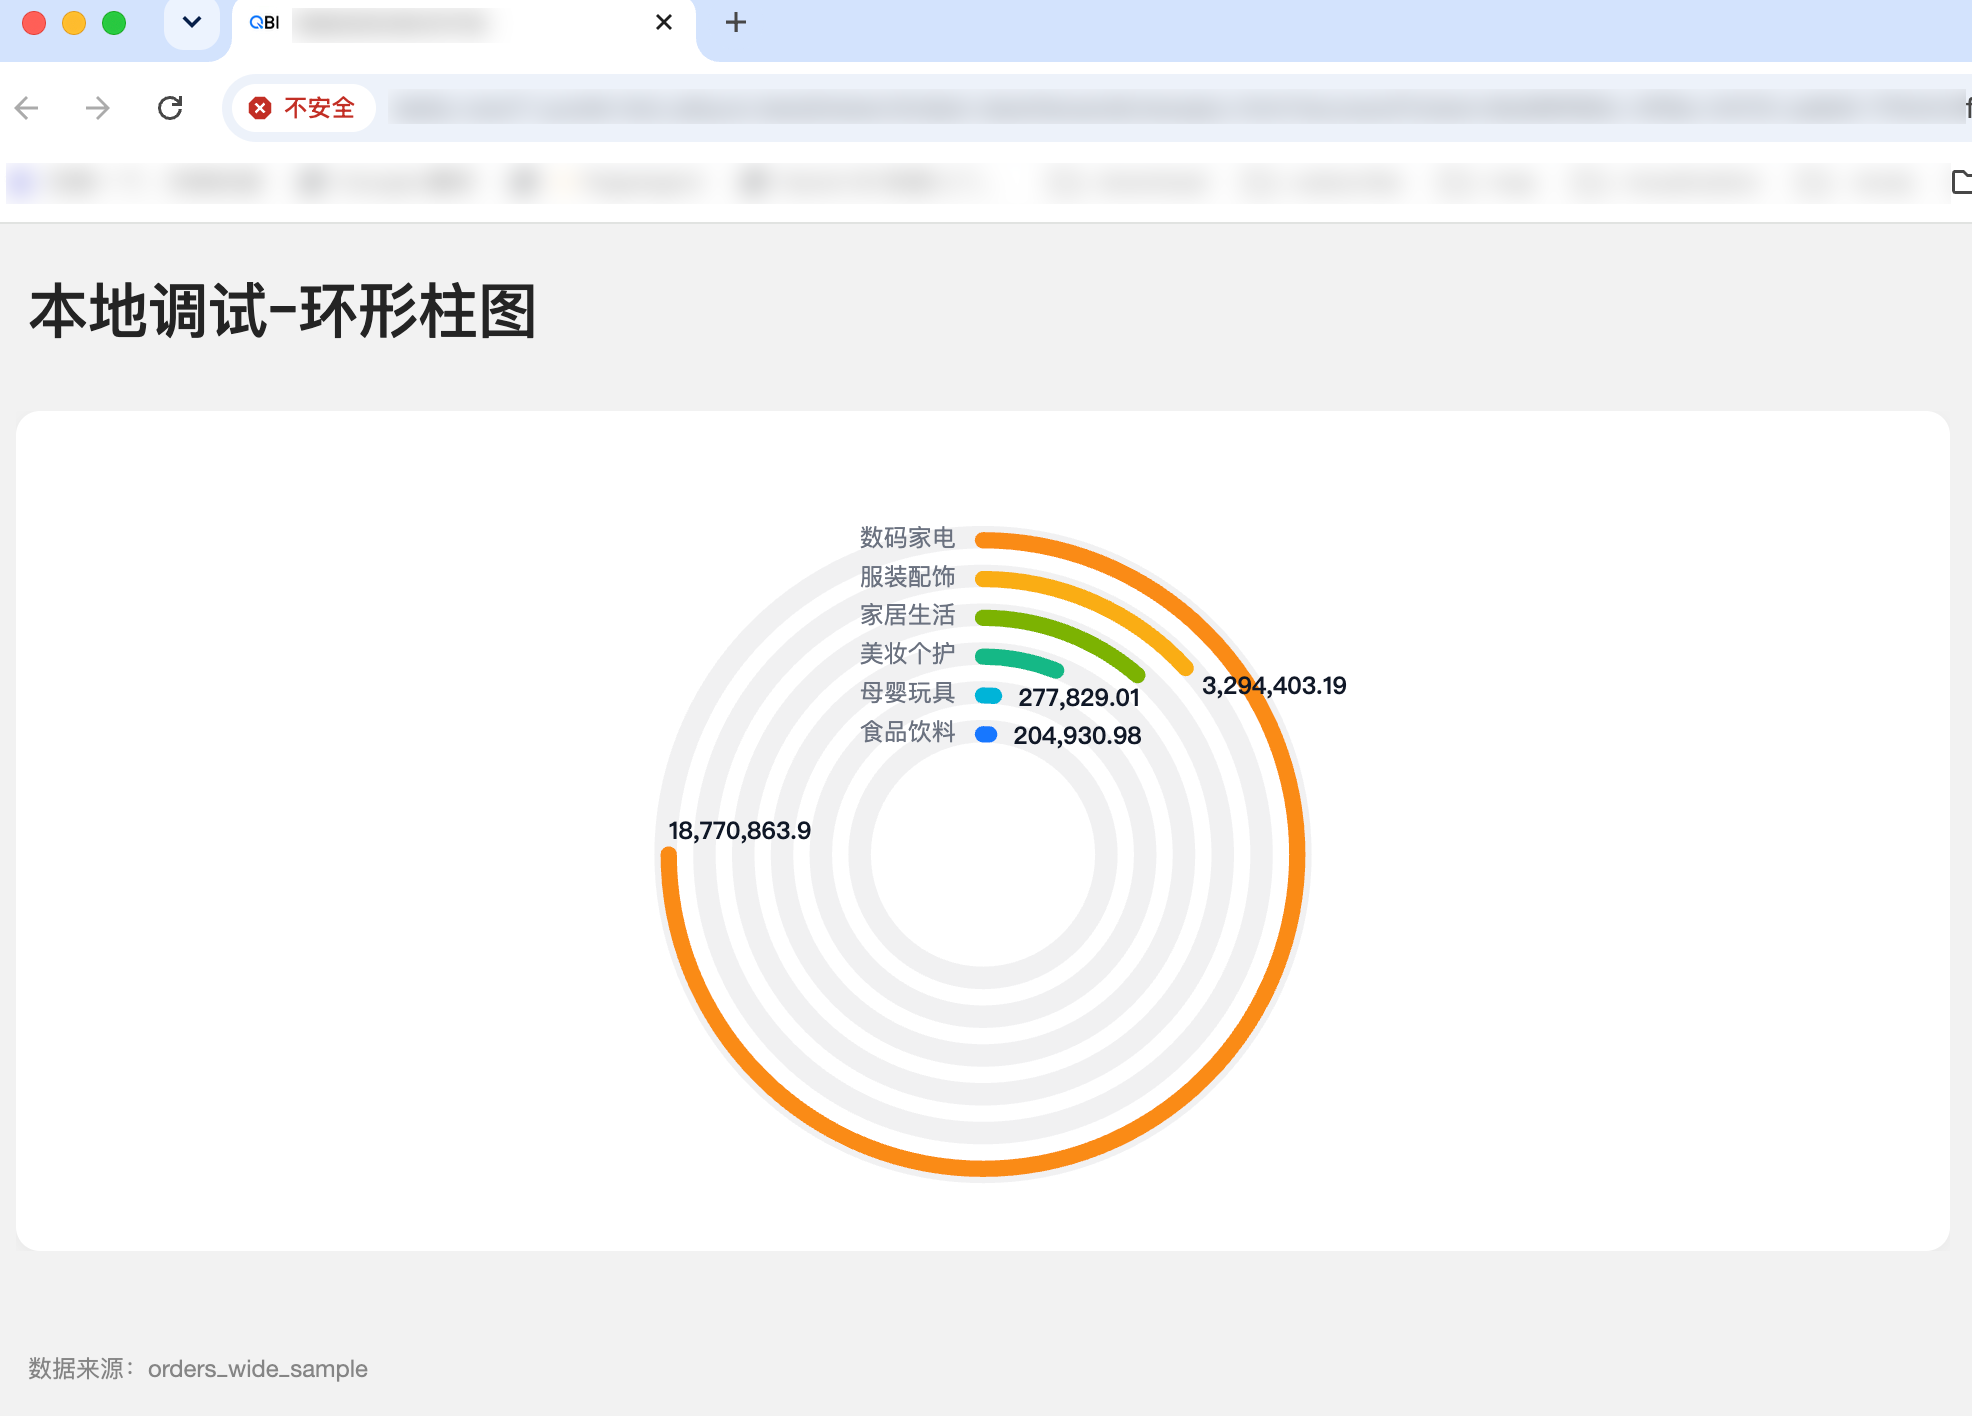
After the chart files are generated, the AI automatically opens a real-time debugging page in your local browser to preview the custom chart. During debugging, the AI automatically retrieves a suitable dataset from My Data to render the chart. You can also specify or change the dataset at any time through conversations in the IDE.
By default, the real-time debugging page only displays the single custom chart that was generated. To test query controls, linkage effects with other charts, or to verify the chart's behavior when filtered or controlled, you can instruct the AI directly in the IDE. For example, "Add a query control and a linked chart for this chart." The AI will automatically generate and run the relevant code and update the debugging page. Refresh the page to see the effects. Continue to adjust the style, color scheme, interactions, and linkage logic using natural language until the custom chart meets your expectations.
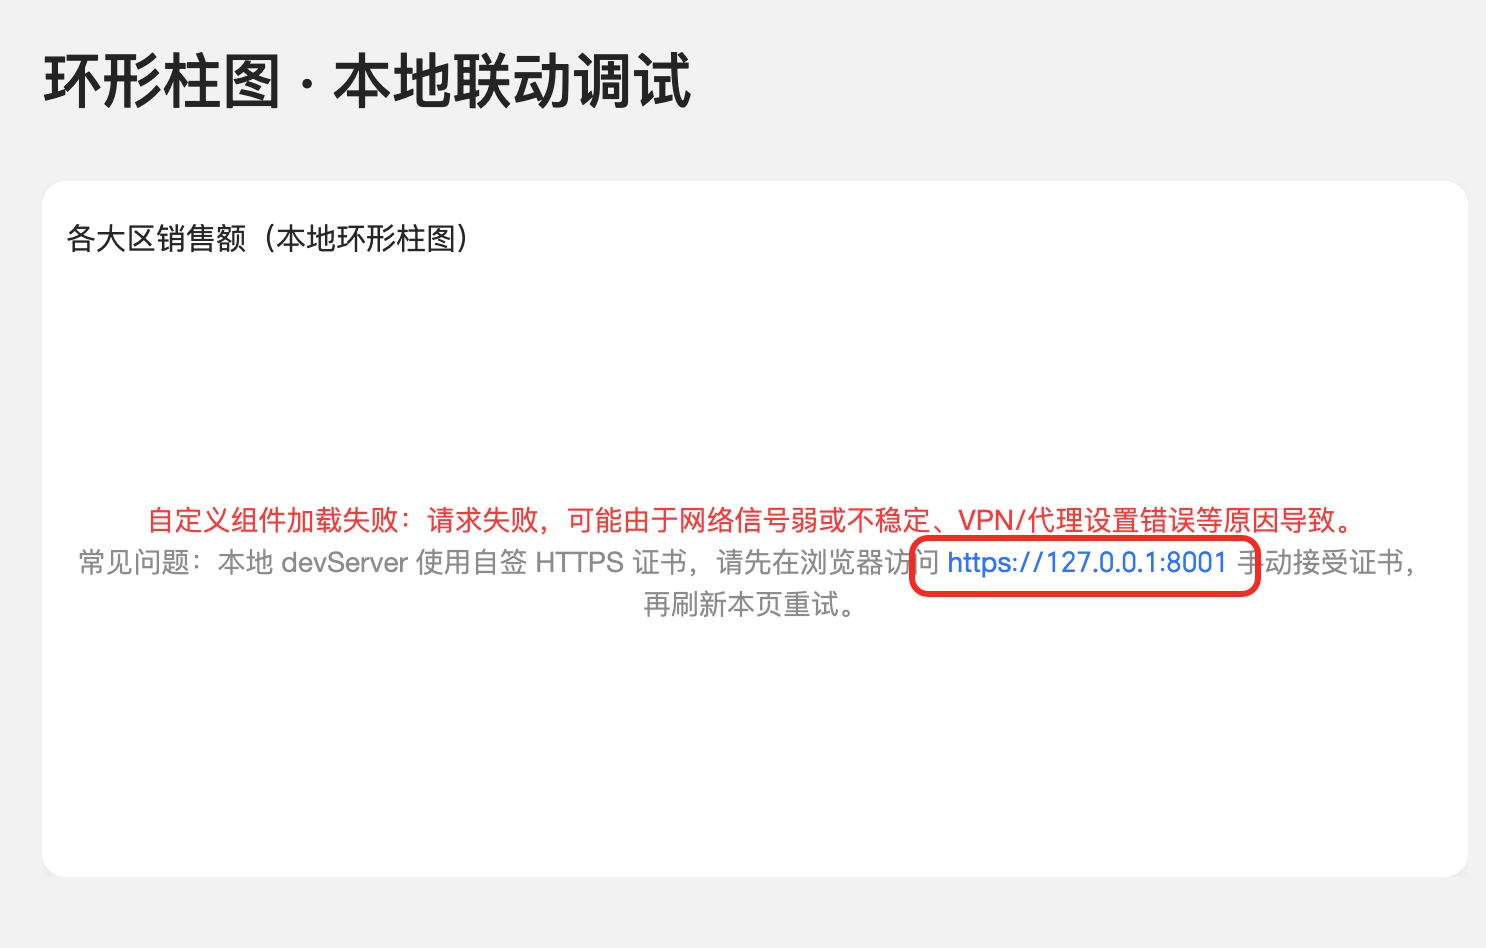
Before entering real-time debugging, the AI first starts a local preview service on your computer. The first time you open it, your browser may show a "Connection is not secure" warning. This is expected because the debugging service uses a local certificate and does not indicate a problem with the chart. Follow the prompts to proceed and accept the certificate, then return to and refresh the debugging page to preview it correctly.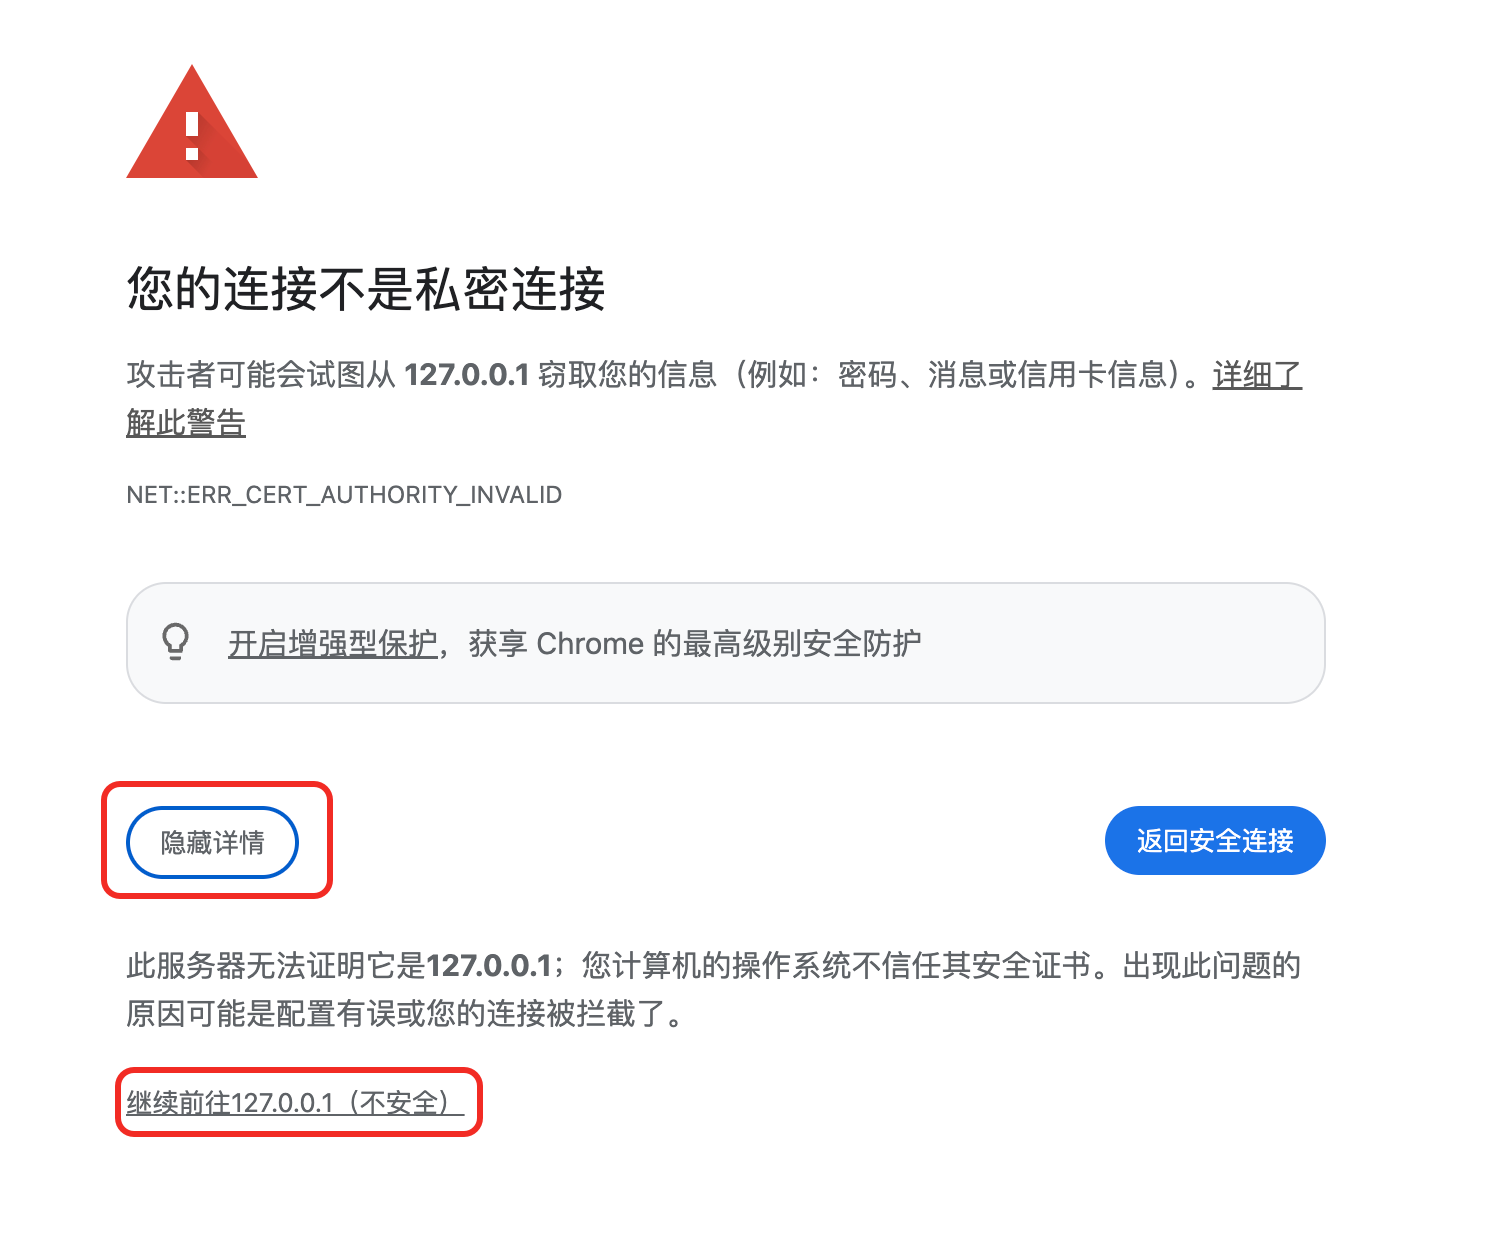
Step 5: Build and upload
Make sure your Quick BI AIPro account has AIPro management permissions. Otherwise, the AI cannot upload the chart.
When the chart meets your expectations, you can tell the AI in the IDE, "The result is satisfactory, you can upload it to the platform now." The AI will then guide you through building, packaging, and uploading the chart to the Quick BI AIPro platform through the MCP interface.
After a successful upload, the chart is visible to all users and enabled by default. It is also automatically installed in My Charts. Other members of your organization can browse and install the chart from the Chart Marketplace. The AI will then automatically select this chart when its name is mentioned or when a user's request semantically matches its description.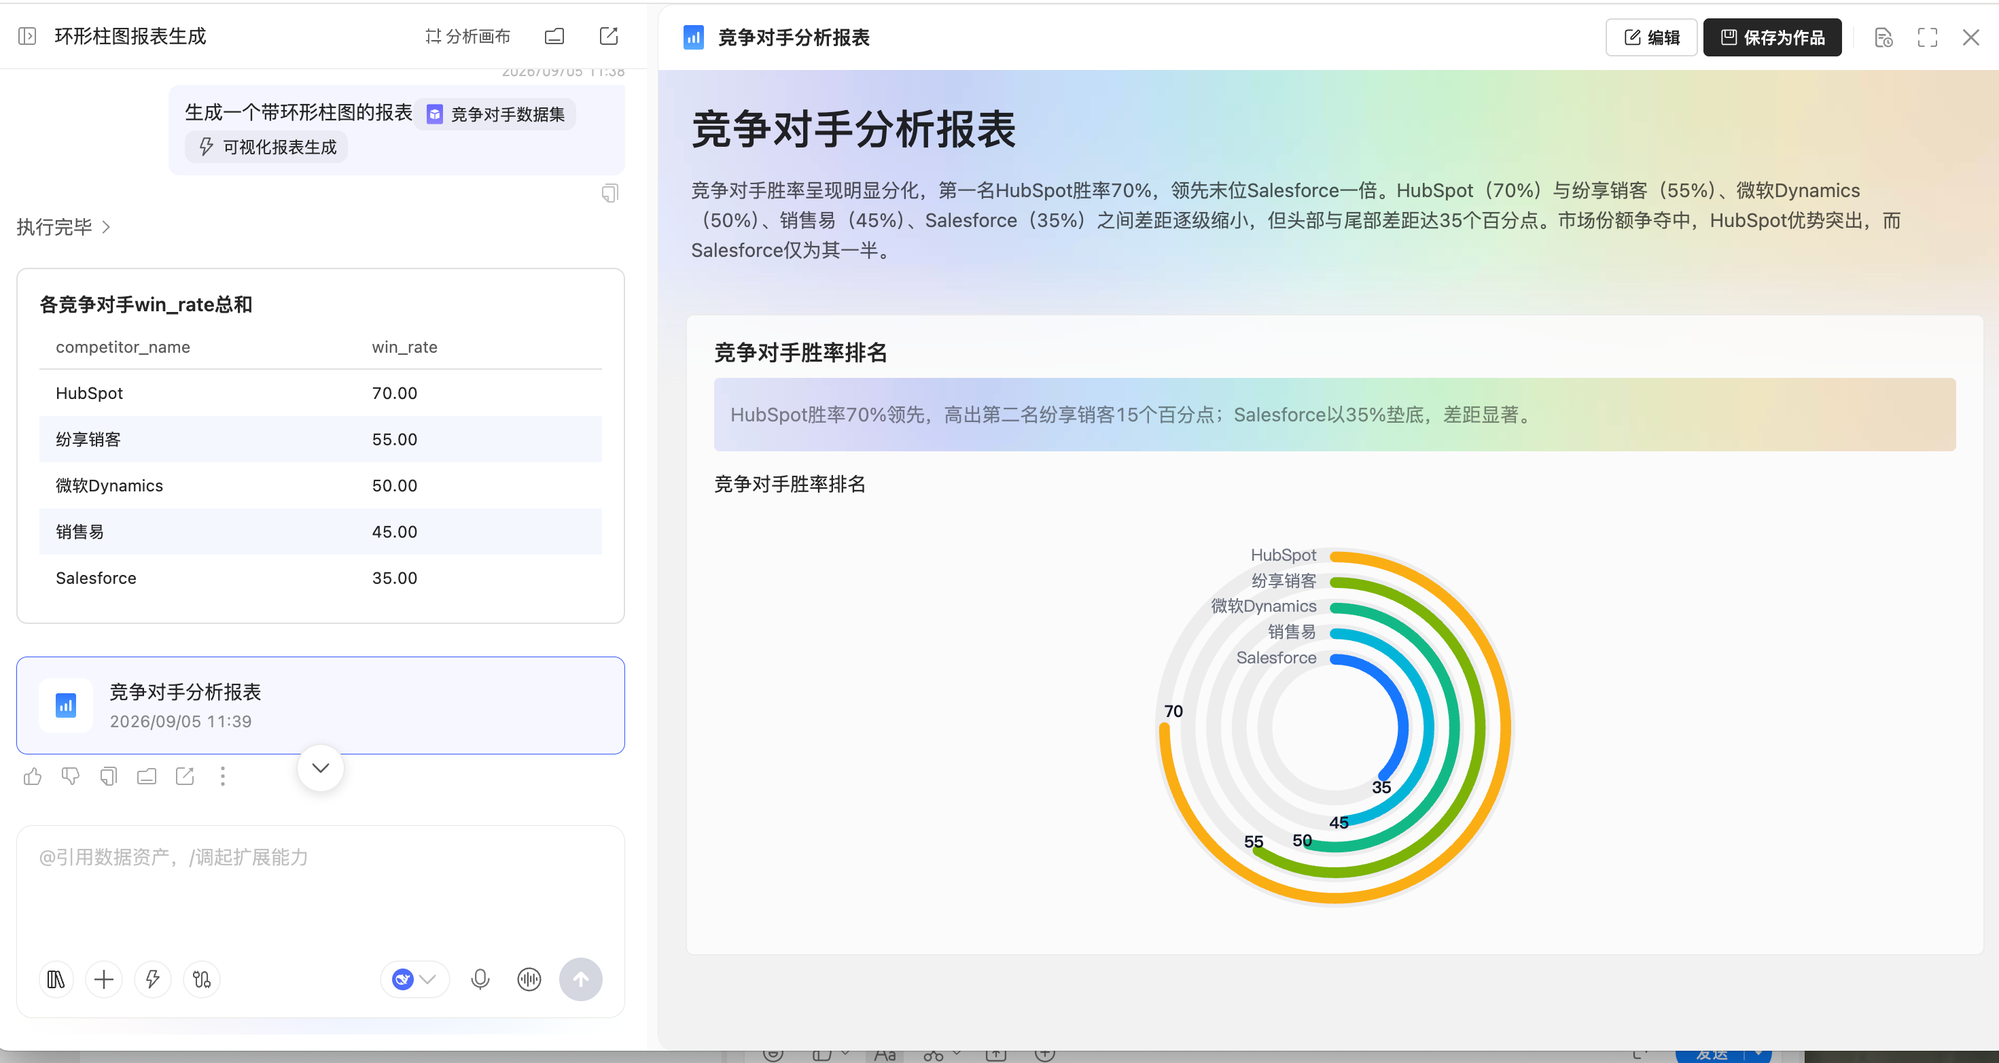
Method 2: Manual code development
Developers write chart code directly using the scaffolding project provided by Quick BI. After debugging, they upload and configure the chart in the Quick BI AIPro Admin Console. This method requires manual coding and is suitable for technical users with front-end development experience.
Prepare your local environment
Install Node.js: Download and install Node.js version 22.20.0 or later from the official website.
npm source: Use the official npm source:
https://registry.npmjs.org.Install a local development tool: Install a local development tool of your choice, such as VS Code.
Procedure
The overall process for developing a custom chart by writing code is: Create a project > Configure the meta file (data contract) > Write the chart code > Configure external dependencies > Build and upload. The following sections describe each step in detail.
Step 1: Create a project
Open your local terminal, navigate to the folder where you want to create the project, and run the following command to create a chart project from the Quick BI scaffolding.
React version
npx -y --registry=https://registry.npmjs.org create-qbi-app@latest my-chart --template ai-chart-react-tsVanilla version
npx -y --registry=https://registry.npmjs.org create-qbi-app@latest my-chart --template ai-chart-vanilla-ts
ImportantThe chart name must start with a lowercase letter and can only contain lowercase letters, numbers, underscores (
_), or hyphens (-). It must be at least two characters long.The resulting project structure is as follows:
my-chart/
├── src/
│   ├── meta.ts          # Data contract definition
│   ├── index.ts          # Entry point (exports lifecycle functions)
│   ├── Component.tsx     # Main component (React version)
│   └── Component.scss    # Styles (optional)
├── qbi.config.ts         # Build configuration
├── package.json
└── tsconfig.json
Run the following command to download and install the project's dependencies.
cd my-chart && npm install --registry=https://registry.npmjs.org
Step 2: Configure meta file (data contract)
In your local development tool, find and open the meta.ts file in the project. This file defines the chart's data contract, which specifies what data (dimensions or measures) the chart requires, whether the data is mandatory, and limits on the number of data fields.
AI-version custom charts use the AIComponentMeta type and only declare dataSchema (data field contract). You do not need to declare a style panel. The chart's data contract is exported through defineMeta.
The following is a code sample:
// src/meta.ts
import type { Interfaces } from '@quickbi/bi-open-react-sdk';
import { defineMeta } from '@quickbi/bi-open-react-sdk';

export default defineMeta<Interfaces.AIComponentMeta>({
  dataSchema: {
    areas: [
      {
        id: 'area_row',                           // Area ID, key in DSL and encoding
        name: 'Dimension',
        description: 'Category axis, bind dimension fields',        // AI semantic description for AI recall
        queryAxis: 'row',                          // Query axis: row / column / drill / filters
        rule: {
          required: true,                          // Specifies whether the field is required
          maxColNum: 1,                            // Maximum number of allowed fields
          fieldTypes: ['dimension'],               // Allowed field types
        },
      },
      {
        id: 'area_column',
        name: 'Measure',
        description: 'Value axis, bind measure fields',
        queryAxis: 'column',
        rule: {
          required: true,
          maxColNum: 3,
          fieldTypes: ['measure'],
        },
      },
    ],
  },
});
Field | Required | Type | Description |
| Yes |
| A list of field areas that define which dimensions and measures the chart requires. |
| Yes |
| The unique identifier for the area. It is also the key for DSL |
| Yes |
| The display name of the area. |
| No |
| Tooltip information for the area name. |
| No (Recommended) |
| This description helps the AI automatically match fields when generating reports. |
| Yes |
| The type of query axis.
|
| Yes |
| Specifies whether the field is required.
|
| Yes |
| The maximum number of fields allowed in the area. |
| Yes |
| The types of fields allowed in the area.
|
| No |
| Allowed field group types. |
| No |
| Allowed field collection types. |
| No |
| Placeholder text. |
Step 3: Write chart code
Implement the chart in the Component.tsx file and export it from the index.ts file. This process transforms incoming data into a rendered chart. The following are code samples:
See Type reference in this topic to learn more about the data structures and parameter specifications to follow when developing custom chart components.
React version
The React component directly receives
AIComponentPropsand is exported using thecreateBIComponentwrapper.// src/Component.tsx import React, { useRef, useEffect } from 'react'; import type { Interfaces } from '@quickbi/bi-open-react-sdk'; const MyChart: React.FC<Interfaces.AIComponentProps> = React.memo( ({ data, encoding, dispatch }) => { const containerRef = useRef<HTMLDivElement>(null); // Read fields from encoding const categoryField = encoding.area_row?.[0]; // Dimension field name const valueFields = encoding.area_column ?? []; // Measure field name array const rows = data?.values ?? []; // Data rows useEffect(() => { if (!containerRef.current || rows.length === 0) return; // Initialize the chart here (for example, by using echarts.init or pure SVG rendering) // ... }, [data, encoding]); return <div ref={containerRef} style={{ width: '100%', height: '100%' }} />; }, ); export default MyChart;// src/index.ts import { createBIComponent } from '@quickbi/bi-open-react-sdk'; import Component from './Component'; export const { bootstrap, mount, unmount, update } = createBIComponent({ element: Component, });Vanilla version
The Vanilla component uses a class style, is wrapped with
LifecycleProps, and reads business data fromprops.customProps.// src/Component.ts import type { Interfaces } from '@quickbi/bi-open-sdk'; class MyChart { mount(props: Interfaces.LifecycleProps<Interfaces.AIComponentProps>) { this.render(props); } update(props: Interfaces.LifecycleProps<Interfaces.AIComponentProps>) { this.render(props); } umount(props: Interfaces.LifecycleProps<Interfaces.AIComponentProps>) { props.container?.replaceChildren(); } private render(props: Interfaces.LifecycleProps<Interfaces.AIComponentProps>) { const { data, encoding } = props.customProps!; const categoryField = encoding.area_row?.[0]; const valueFields = encoding.area_column ?? []; const rows = data?.values ?? []; props.container!.textContent = `${rows.length} rows: ${Object.keys(encoding).join(', ')}`; } } export default MyChart;// src/index.ts import { createBIComponent } from '@quickbi/bi-open-sdk'; import Component from './Component'; export const { bootstrap, mount, unmount, update } = createBIComponent({ element: Component, });
Step 4: Configure external dependencies
If your chart depends on a third-party library, such as ECharts, declare it as an external in the qbi.config.ts file. You must then provide its CDN URL when uploading the chart in the AIPro Admin Console.
The following is a code sample:
qbi.config.ts
import { defineConfig } from '@quickbi/qbi-dev-tools'; export default defineConfig({ entry: { BIComponentMeta: './src/meta.ts', BIComponent: './src/index.ts', }, devServer: { port: 8001, host: '127.0.0.1', server: { type: 'https' }, }, externals: { // Host built-in libraries (pre-configured in the template, no CDN URL required) lodash: '_', react: 'React', 'react-dom': 'ReactDOM', moment: 'moment', // Third-party chart libraries (require a CDN URL) echarts: 'echarts', }, });ImportantThe
@quickbi/bi-open-sdkand@quickbi/bi-open-react-sdkpackages must be included in the chart bundle and cannot be placed inexternals.External Assets (third-party library CDN URLs)
For each external dependency that is not built into the host, you must provide its CDN URL during upload. Use the format
{ name, global, url }:Dependency
Externals
External assets
ECharts
{ echarts: 'echarts' }[{ name: 'echarts', global: 'echarts', url: 'https://cdn.jsdelivr.net/npm/echarts@5.5.0/dist/echarts.min.js' }]Vega Embed
{ 'vega-embed': 'vegaEmbed' }[{ name: 'vega-embed', global: 'vegaEmbed', url: 'https://cdn.jsdelivr.net/npm/vega-embed@6.24.0/build/vega-embed.min.js' }]React / lodash / moment
Pre-configured in template
Not required (built into the host)
Step 5: Build and upload
After writing the code, preview and debug the chart in your local browser. Once satisfied, build the code package and upload it to the Quick BI AIPro platform for use.
Debug: Run the following command in the project's root directory to start the local service. You can then view the chart's implementation and debug it as needed.
qdt startPackage and build: After confirming that the chart works as expected, run the following commands to build the chart code package.
qdt build # → dist/main.js + dist/meta.js + dist/main.css (optional) qdt bundle # → project root directory/{name}-{version}.zipNoteBefore building, check the following:
dist/main.jsanddist/meta.jsexist and are not empty.The total size of the build artifacts is 10 MB or less. If it exceeds this limit, check if you have forgotten to declare a third-party library in
externals.
Upload manually
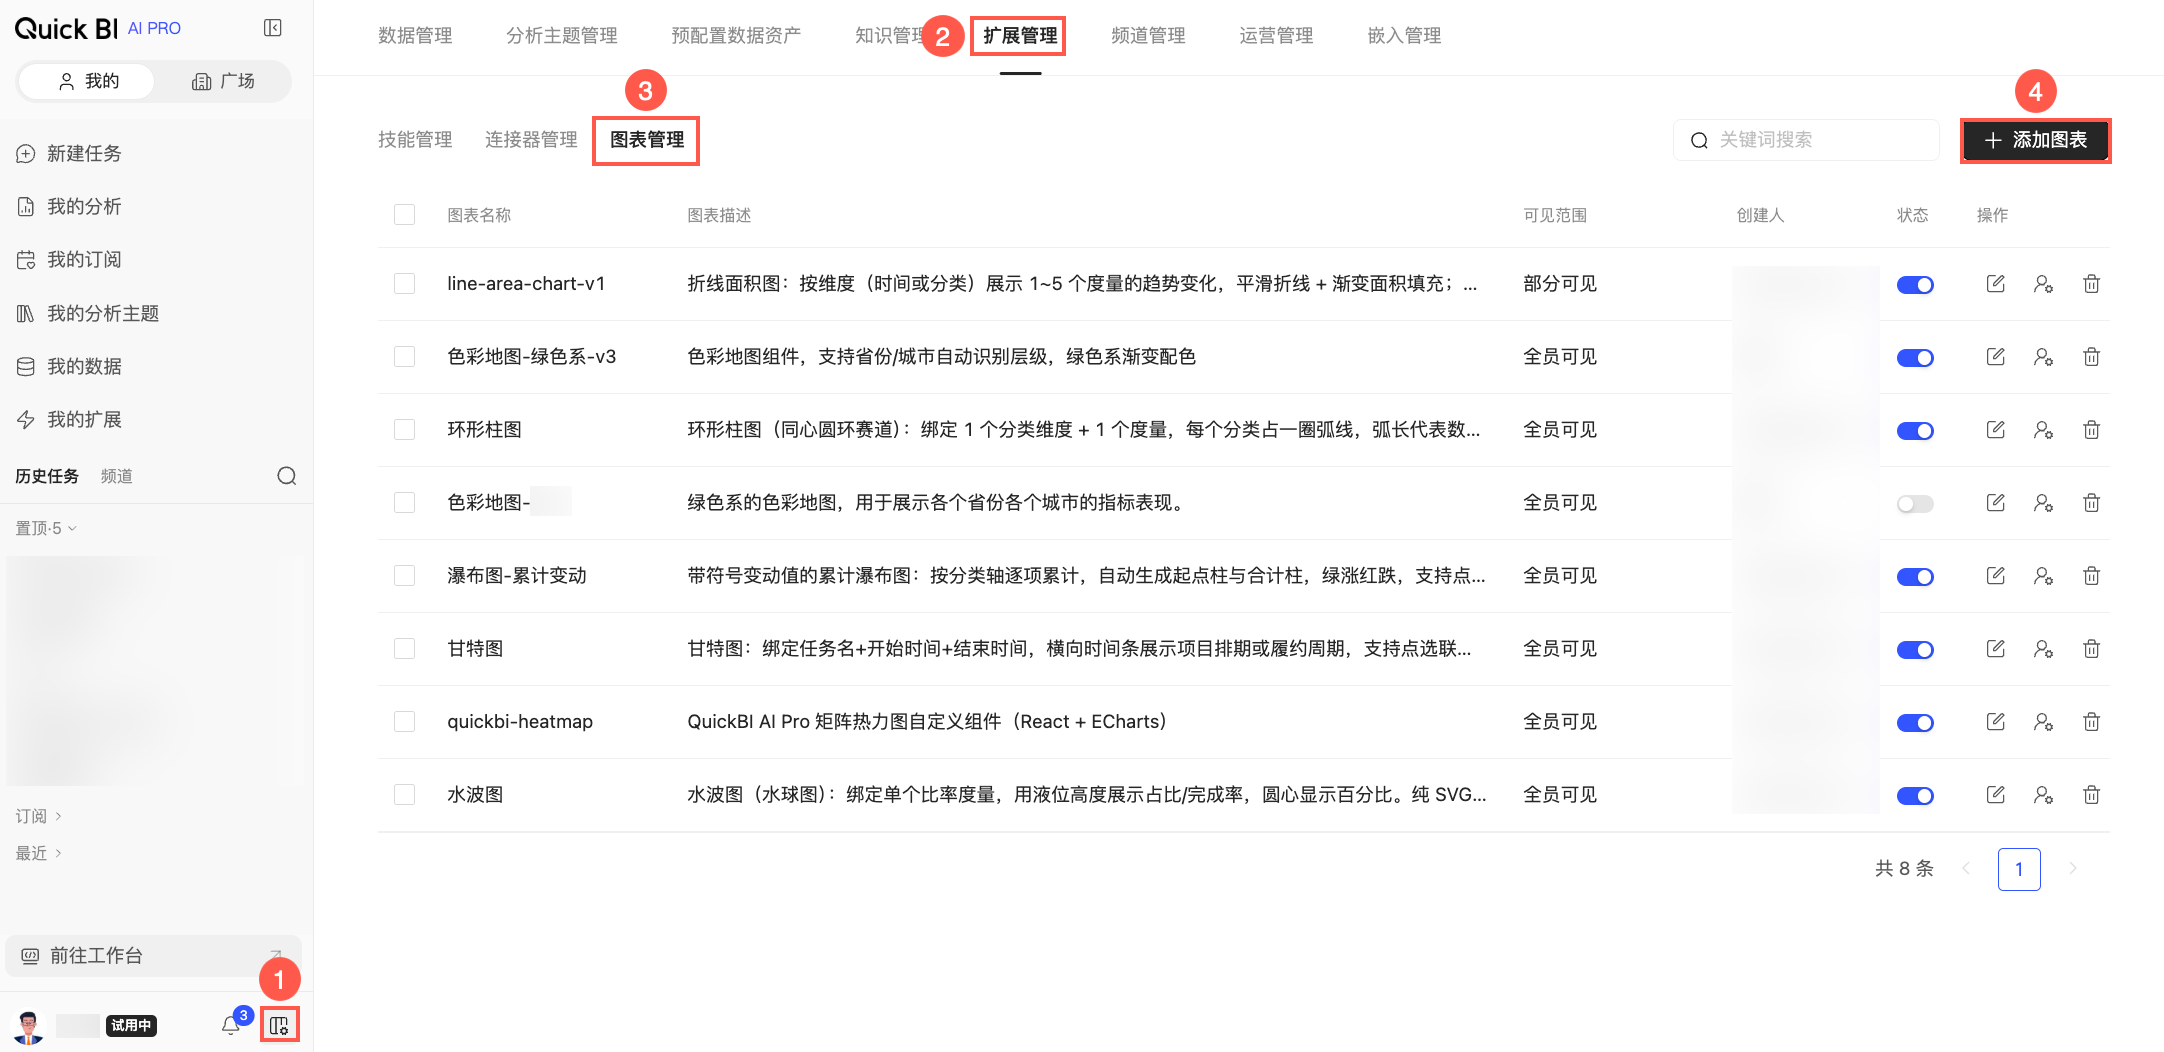
Log in to the Quick BI AIPro Admin Console, go to Extension Management > Chart Management, and click Add Chart in the upper-right corner of the page.

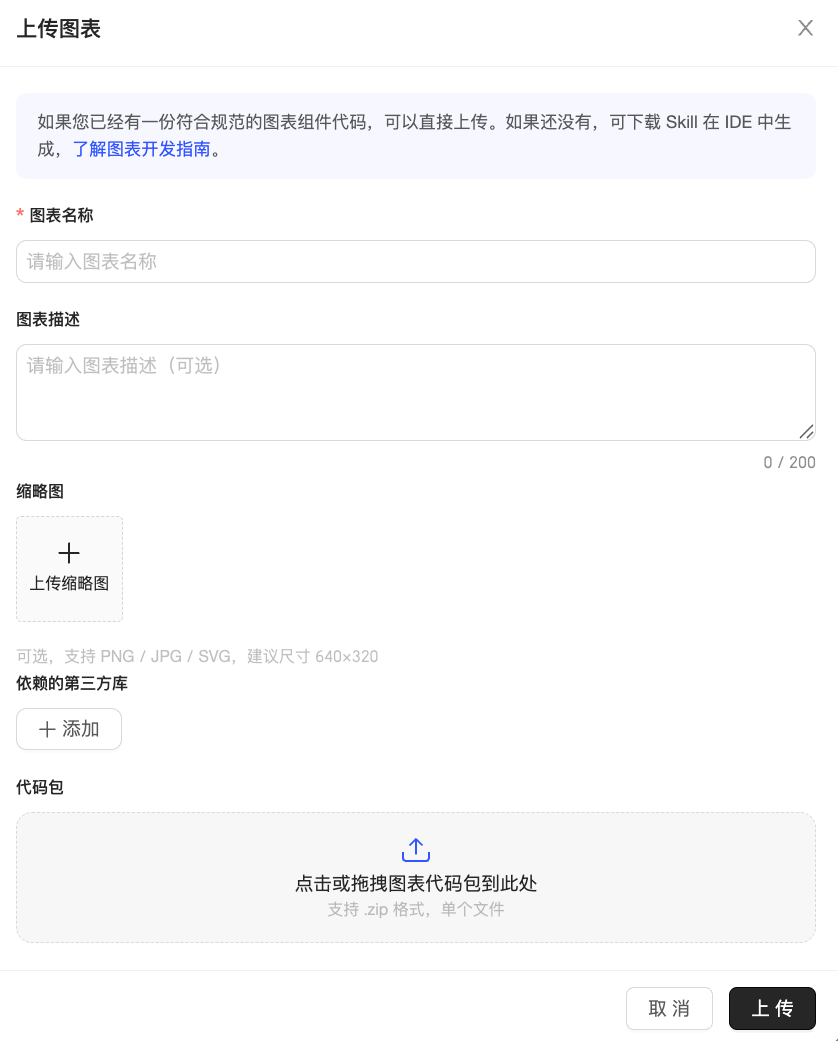
In the Upload Chart dialog box, configure the chart's information.
Parameter
Description
Chart name
Enter a custom name for the chart. You can name it based on its business purpose or core function. Make sure the name is unique within your organization.
Chart description
Enter a description for the chart, such as its usage scenarios or business functions. This information helps team members and the AI understand and use the chart correctly. The description must be 200 characters or less.
Thumbnail
Upload a thumbnail for the chart to provide a visual representation of its appearance. The file can be in PNG, JPG, JPEG, or SVG format, and its size must be 200 KB or less.
Dependent third-party libraries
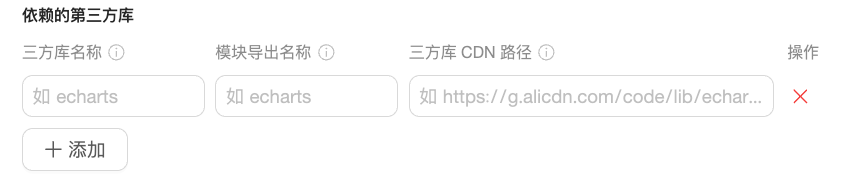
If the chart uses a third-party library, such as ECharts, click Add to enter the library's information.
Third-party library name: The package name from the
importstatement (e.g.,echartsinimport * as echarts from "echarts").Module export name: The name of the global variable for a third-party library, for example,
echartsinwindow.echarts.Third-party library CDN path: The CDN URL for the library. It must be a UMD module.
Code package
The packaged and built chart code file. You can add it to the upload area by clicking or dragging. The file must be in .zip format and its size must be 10 MB or less.
After configuring the information, click Upload. After a successful upload, the chart is visible to all users and enabled by default. It is also automatically installed in My Charts. Other members of your organization can browse and install the chart from the Chart Marketplace. The AI will then automatically select this chart when its name is mentioned or when a user's request semantically matches its description.
Type reference
The following is a type reference for Quick BI AIPro custom charts. It helps you understand the data structures and parameter specifications to follow when developing custom chart components.
AIComponentMeta
Defines the chart's field data contract. The source of truth is in @quickbi/bi-types.
interface AIComponentMeta {
  /** Data contract */
  dataSchema?: AIComponentMetaDataSchema;
}

interface AIComponentMetaDataSchema {
  areas: DataSchemaArea[];
}

interface DataSchemaArea {
  id: string;                                          // Unique identifier for the area
  name: string;                                        // Display name of the area
  nameTip?: string;                                    // Tooltip for the name
  description?: string;                                // AI semantic description (recommended)
  queryAxis: 'row' | 'column' | 'drill' | 'filters';  // Query axis
  rule: DataSchemaAreaRule;                            // Field rules
}

interface DataSchemaAreaRule {
  required?: boolean;                                  // Specifies whether the field is required
  maxColNum?: number;                                  // Maximum number of fields
  placeholder?: string;                                // Placeholder text
  fieldTypes?: ('dimension' | 'measure')[];            // Field types
  fieldGroupTypes?: string[];                          // Field group types
  fieldCollectionTypes?: string[];                     // Field collection types
}
AIComponentProps
The shape of the runtime props data passed from the host to the chart.
interface AIComponentProps {
  /** Component data: an array of rows, where each row is a Record<string, unknown> */
  data: { values: ReadonlyArray<Readonly<Record<string, unknown>>> };

  /** Field encoding mapping: area id → array of field names */
  encoding: Readonly<Record<string, string[]>>;

  /** Dispatches host interaction actions (optional) */
  dispatch?: AIComponentPropsDispatch;
}
Data retrieval example:
// Read the dimension field name
const categoryField = encoding.area_row?.[0];

// Read the list of measure field names
const valueFields = encoding.area_column ?? [];

// Read the data rows
const rows = data?.values ?? [];

// Iterate through the data
rows.forEach((row, index) => {
  const category = row[categoryField];   // Dimension value
  const value = row[valueFields[0]];     // Measure value
});
Interaction dispatch
The chart uses dispatch to send interaction events to the host, enabling capabilities such as drill-down, linkage, and jump.
type AIComponentPropsDispatch = (
  param:
    | AIComponentPropsActionSelect
    | AIComponentPropsActionCancelSelect
    | AIComponentPropsActionCancelDrill
    | AIComponentPropsActionCancelLinkage,
) => void;

// Select (triggers drill-down, linkage, or jump)
interface AIComponentPropsActionSelect {
  type: 'select';
  payload: {
    dataIndex: number;  // The index of the selected row in data.values
  };
}

// Cancel selection
interface AIComponentPropsActionCancelSelect {
  type: 'cancelSelect';
}

// Cancel drill-down
interface AIComponentPropsActionCancelDrill {
  type: 'cancelDrill';
}

// Cancel linkage
interface AIComponentPropsActionCancelLinkage {
  type: 'cancelLinkage';
Usage example:
// Trigger drill-down when a chart element is clicked
chart.on('click', (params) => {
  dispatch?.({ type: 'select', payload: { dataIndex: params.dataIndex } });
});

// Cancel selection when a blank area is clicked
chart.getZr().on('click', (e) => {
  if (!e.target) {
    dispatch?.({ type: 'cancelSelect' });
  }
});
List of dispatch actions:
Type | Payload | Resulting effect |
|
| Triggers a data retrieval request to update the chart (drill-down, linkage, or jump). |
| None | Cancels the selection and linkage effect. |
| None | Cancels the drill-down and returns to the previous level. |
| None | Cancels the linkage and restores its independent display. |
Related operations
After the chart is uploaded, you can perform the following operations:
In Chart Management, manage the visibility and enabled status of existing charts, or edit or delete charts. For more information, see Manage Custom Charts.
Members of your organization can browse and install custom charts published by the enterprise in the Chart Marketplace. For more information, see Chart Marketplace.
In My Charts, you can view the charts installed under your account and control whether they are used in AI report generation and editing. For more information, see My Charts.
FAQ
Q: The chart area displays the error "Failed to load external dependency: xxx has no resource URL."
A: Eachexternal_assetsentry for a third-party external dependency must have a URL. You can fix this by editing the chart and updating only theexternal_assets.
Q: The system reports that the build artifact size is too large.
Check if theexternalsconfiguration for third-party chart libraries is missing. Large libraries such as ECharts should be declared asexternaland loaded via CDN.
Q: A certificate error occurs during local debugging.
A: The locally started devServer uses a self-signed HTTPS certificate. Because this certificate is not signed by a Certificate Authority (CA), the browser marks it as insecure. To resolve this, navigate directly to the service URL in your browser (e.g., https://127.0.0.1:{port}), accept the certificate warning, and then refresh the debugging page.Q: The browser displays the error "127.0.0.1 refused to connect."
A: This indicates that the local custom chart devServer is not running. Run qdt start in the project's root directory to start the service, and then refresh the page.Q: The preview does not update after I modify the code.
The devServer has hot: false set by default (the output is a UMD external script). After the devServer finishes rebuilding, manually refresh the browser.Q: I have already uploaded and used a chart. Can I replace its code package? Will the changes apply to existing reports?
A: Yes. When you update a chart's code package, the changes are automatically applied to all existing reports that use it. No manual regeneration is required.